I. INTRODUCTION
Nanoindentation has been widely used for measuring mechanical behavior of nanocrystalline (nc) coatings.Reference Pan, Nieh and Chen1–Reference Pan and Chen8 Hardness and elastic modulus can be obtained by adopting the method proposed by Oliver and Pharr.Reference Oliver and Pharr9 The Oliver–Pharr method relies on an analysis of the unloading behavior which is assumed to be elastic. However, nc metallic coatings are reported to possess high strain rate sensitivity values, which are mainly a result of time-dependent (creep) deformation.Reference Pan, Nieh and Chen1, Reference Schwaiger, Moser, Dao, Chollacoop and Suresh2, Reference Pan and Chen8, Reference Lucas and Oliver10–Reference Dao, Lu, Asaro, De Hosson and Ma13 Accordingly, it has been noticed that the modulus and hardness values of nc metals were strongly influenced by testing parameters, such as loading rate, holding time at peak load, and unloading rate.Reference Pan, Nieh and Chen1, Reference Cheng11, Reference Ngan and Tang14–Reference Ma, Long, Pan and Zhou17 A “nose” was observed in the unloading load–displacement (P–h) curve at short holding time and/or low unloading rate.Reference Ngan and Tang14, Reference Fujisawa and Swain15 The appearance of the nose makes accurate estimation of the contact stiffness impossible. Chudoba and RichterReference Chudoba and Richter18 also reported that the deviations of the hardness and modulus for various metallic thin films were as large as 20% if the loading rate and hold time in nanoindentation have not been chosen properly.
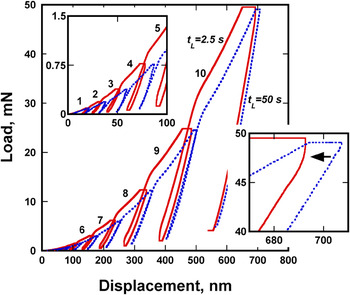
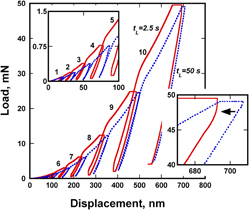
Metals and alloys having microcrystalline grains usually do not show anelastic and creep characteristics at ambient temperatures. It may not be true for their nc counterparts in which high volume fraction of grain boundaries and high density of point defects are present.Reference Sakai, Tanimoto, Kita and Mizubayashi19–Reference Lohmiller, Eberl, Schwaiger, Kraft and Balk21Figure 1 is an example showing the P–h curves of multicycle indentation tests for a nc Fe–Ni alloy. The multicycle tests contained 10 consecutive cycles each of which consisted of four segments including (i) loading to a peak load,  (i = 1–10), within a constant time period t L, (ii) holding at the peak load for 10 s, (iii) unloading at the same rate of loading to a load of
 , and (iv) holding at the load for 0.2 s. The peak load of each cycle was determined in such a way that
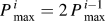 and that of the last cycle is 49 mN. It is noted that the displacement keeps increasing on holding at the peak load of each cycle. The loads and displacements of the first 5 cycles are small and are illustrated in the upper-left inset in Fig. 1. The holding displacement is relatively small at t L = 50 s, whereas significant forward (holding) displacements at the peak loads and reverse displacements at one-tenth of the peak loads are observed at t L = 2.5 s. Substantial hystereses are thus observed during the unloading and loading segments for tests carried out at a short loading time. The exhibition of the hystereses indicates that at least a portion of the holding displacement is recoverable upon unloading. In other words, displacements resulted from both anelastic (recoverable) and creep (non-recoverable) processes are observed. In addition, a small “nose” appears at the onset of unloading at t L = 2.5 s, as indicated by an arrow in the lower-right inset in Fig. 1. The nose results in an overestimated contact stiffness, and the application of the Oliver–Pharr method on the metals exhibiting both anelastic and creep characteristics is inappropriate.
Load–displacement curves obtained from multicycle tests at t L = 50 s and t L = 2.5 s, respectively.

To solve the problem, an elastic–viscoelastic correspondence analysis has been used to simulate the displacement–time relation in indentation for polymers.Reference Cheng11, Reference Ngan and Tang14, Reference Oyen22–Reference Yang, Zhang and Zeng26 The elastic modulus and time-dependent parameters, such as relaxation time constant and viscosity can be derived from analyzing the load–depth or displacement–time curves. The material parameters derived, however, vary with the testing conditions in some cases, and no standard method for routine nanoindentation test is suggested.Reference Liu, Lee, Sung and Nguyen23, Reference Oyen25, Reference Yang, Zhang and Zeng26 Moreover, this analysis has not been applied on metallic materials yet.
In this study, an attempt was made to analyze the nanoindentation data for the above mentioned nc Fe–Ni alloy exhibiting elastic, plastic, anelastic, and creep characteristics using a method based on the correspondence principle. Results indicated that material parameters related to the time-dependent deformations could be yielded from indentation creep tests at a high loading rate. The indentation behavior and the variations of the hardness and modulus at different testing conditions can be well explained. A discussion of the choice of proper loading/unloading rate so that the viscoelasticity is not prevalent and the conventional Oliver–Pharr method would suffice is also given. It is also suggested that the material parameters can be used for clarifying the underlying mechanism of the time-dependent deformation in the future.
II. EXPERIMENTAL AND ANALYTICAL METHODS
A. Materials
A Fe–Ni alloy coating was electrodeposited on a brass substrate (20 × 50 × 0.5 mm3) from a sulfate electrolyte consisting of nickel sulfate (196 g/L), ferric sulfate (28 g/L), ammonium chloride (16 g/L), boric acid (31 g/L), ascorbic acid (8 g/l), and wetting agent (0.1 g/L). The electrolyte temperature was 298 K, and the pH value of the electrolyte was 2.0. The sample was deposited at current density 0.02 A/cm2 for 7200 s to reach a thickness of about 50 μm. The as-deposited coupon was then cut to 10- × 10-mm2 samples and one of them was annealed at 673 K for 60 s in an infrared furnace in vacuum (P ∼ 1 × 10⁻³ Pa). Both the as-deposited and annealed coupons were ground and polished to a mirror-bright surface before the indentation tests. The residual thickness of the coating is 30 μm or higher, which is 30–40 times as high as the indentation depth. The iron content of the deposit was determined to be 51 wt% using an electron microprobe (JXA 8900R) operating at 15 kV. The grain size of the samples was characterized by x-ray diffraction (D5000, Siemens, Karlsruhe, Germany) using Cu Kα radiation operating at 40 kV and 30 mA. The diffraction profile was analyzed based on the Stokes–Wilson equation using TOPAS software. The as-deposited and 673 K annealed samples possess grain sizes (volume-averaged column height) of 6 nm and 11 nm, respectively.
B. Nanoindentation tests
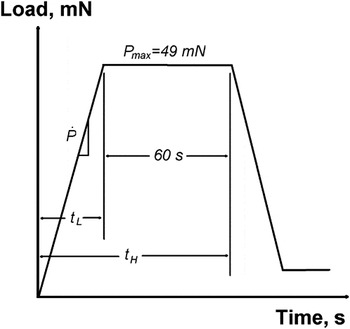
The indentation tests were performed using an MTS XP nanoindentation system equipped with a Berkovich diamond indenter at room temperature. The indenter tip was calibrated before the tests using a fused silica sample. In addition to the multicycle tests mentioned above, indentation creep tests with a peak load of 49 mN and a holding time of 60 s were conducted at four loading/unloading rates of 0.05, 0.2, 1, and 20 mN/s, respectively. The test schedules and related definition of the parameters are shown in Fig. 2. Thermal drifting was measured by holding the load at 10% of the maximum load for 60 s right after final unloading segment. The drift rates were in a range of 0.01–0.07 nm/s, and all the data were corrected.
Schematic load–time curve and definition of test parameters for the indentation creep test.

C. Analysis of indentation data
On the basis of the Oliver–Pharr method,Reference Oliver and Pharr9 the reduced elastic modulus E r is calculated by measuring the contact stiffness S and the contact area A c at the onset of unloading as
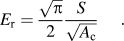
The measurement of the contact area under peak load P max actually relies on an area function for the Berkovich indenter

where h c = h − 0.75 P max/S is the contact depth.Reference Oliver and Pharr9 The hardness is calculated from the relation:

However, as will be described in the following discussion, the anelastic effect makes an accurate estimation of the contact stiffness impossible. An apparent hardness is thus used as:
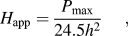
where h is the total indent depth.
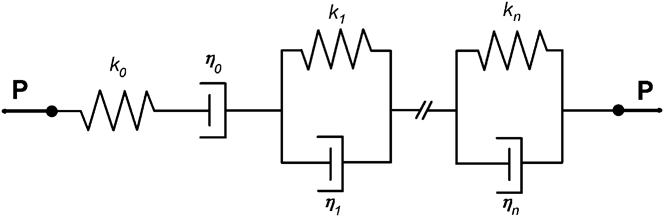
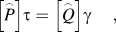
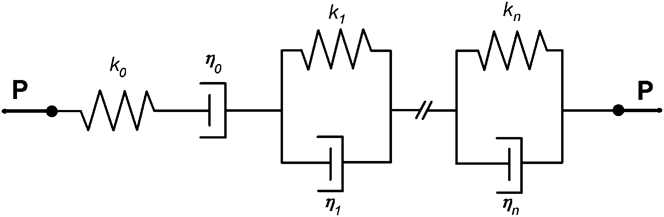
For the analysis applying the correspondence principle, the indent depth, h A, after subtracting the plastic part from the total indent depth h, of the nc alloy in response to the applied load is modeled by considering that the material is made up of a number of dashpots and linear springs. In the present case a model containing a Maxwell unit and a (or several) Kelvin unit(s) in series is used as shown in Fig. 3. The anelastic process, which will be saturated on loading and is recoverable upon unloading, is described by the Kelvin unit. The creep deformation, that proceeds as long as the stress is applied and is, nevertheless, not recoverable, is modeled by the dashpot in the Maxwell unit. The employment of multiple Kelvin units is indeed based on the indentation creep test results, which will be described in the next section. For simplicity, only one Kelvin unit is considered in the following derivation. If the alloy is subjected to a loading, the constitutive relation for shear stress and shear strain can be written asReference Findley, Lai and Onaran27:
Viscoelastic model used in the present study: one Maxwell unit and one or several Kelvin unit(s).
where


In the above equations, D denotes the differential operator 
For indentation test in elastic solid using Berkovich indenter, the indent depth h A(t) and the associate loading P(t) are correlated as
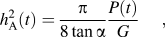
where α = 70.3° is the half included angle of the indenter. In addition, the assumption with Poisson’s ratio equal to 0.5 has been made.Reference Oyen25 By employing the correspondence principle,Reference Findley, Lai and Onaran27 the response of a viscoelastic medium can be found by replacing the G with  . The relationship of the Eq. (5) becomes
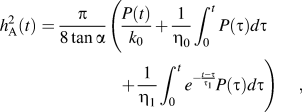
where the time constant τ 1 is defined as  . For constant ramp loading with loading rate
 , i.e.,
 , the response becomes

For t H > t > t L, the indent depth can be derived by applying the Boltzmann superposition principle as

where t H is the finish time of holding and thus t H = t L + 60. For t > t H, the indent depth is written as
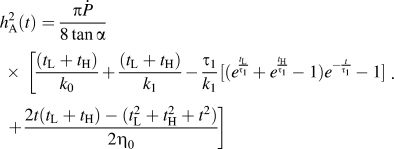
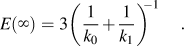
The relaxation modulus, E(∞), can therefore be obtained as:
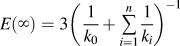
In the case of n Kelvin units are chosen,
III. RESULTS
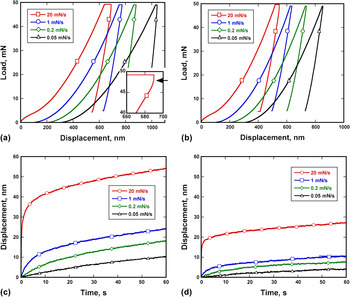
Figures 4(a) and 4(b) show the typical P–h curves at four different loading rates for the as-deposited and 673 K annealed samples, respectively. Higher load is needed to indent the material to the same depth at a higher loading rate. The displacement on holding at the peak load increases with increasing loading rate. Moreover, the P–h curve exhibits a nose at the onset of unloading when the loading rate is high (20 mN/s), as shown as an inset in Fig. 4(a). The nose results in a high slope value of the initial unloading curve, otherwise the slope increases with decreasing loading rate from 1 to 0.05 mN/s. Figures 4(c) and 4(d) shows the h–t curves at the holding stage. For the lowest loading rate of 0.05 mN/s, the displacement increases with time nearly monotonically with a rate of 0.17 nm/s for the as-deposited sample and 0.06 nm/s for the annealed one. Nevertheless, an abrupt increase of displacement in the first few seconds of holding is observed followed by a nearly monotonic increase of displacement with time at loading rate of 20 mN/s. The total displacement of the annealed sample is about half as much as that of the as-deposited one.
Load–displacement curves of the indentation creep test for the (a) as-deposited and (b) annealed samples at four different loading rates, and displacement–time curves for the (c) as-deposited and (d) annealed samples showing the displacement on holding.

Equation (8) was used to fit the holding displacement data to obtain the material parameters. Since the model only deals with the elastic- and time-dependent deformations, the plastic displacement has to be subtracted from the total displacement. In the present case, the plastic displacement h p was estimated by fitting the unloading curve at loading rate 20 mN/s in a form ofReference Oliver and Pharr9, Reference Oyen25:

where B is a constant, Δh hold = h(t H) − h(t L) and n ∼1.4. The plastic displacement was derived as 473 nm in average for the as-deposited sample. The square of the holding displacement, h A2(t), is therefore obtained by

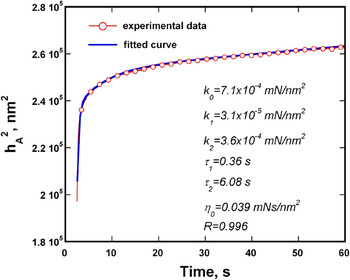
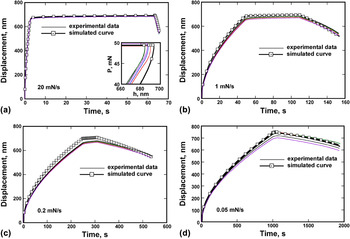
Best fitting results (R > 0.995) for tests at 20 mN/s were obtained by choosing a model containing one Maxwell unit and two Kelvin units in series. Figure 5 shows an example of the fitting result for the as-deposited sample, and the average values of the parameters from at least eight sets of test data are listed in Table I for both samples. As mentioned above that the values of the material parameters should not be a function of loading rate. On evaluating the validity of the model, the full h–t curves are calculated from Eqs. (7)–(9) and (12) using the parameters listed in Table I, for the as-deposited sample as an example, not only for test at 20 mN/s but also for tests at other loading rates. Figures 6(a)–6(d) show the experimental and the simulated h–t curves for tests at four loading rates. It is no surprise that the h–t curves at  = 20 mN/s are fitted very well. A nose also appears at the onset of unloading in the simulated P–h curve shown as an inset in Fig. 6(a). Figures 6(b)–6(d) show the simulated h–t curves at lower loading rates. The simulated curves coincide relatively well with the experimental ones, though deviation appears to become more prevalent with decreasing loading rate. It is worth noting that the plastic displacement was estimated at loading rate 20 mN/s as mentioned above and was used in all the simulations. We realize that the effective stress for plastic deformation on loading is decreased due to the increase of contact area, which is a result of increasing creep and anelastic displacements with decreasing loading rate. In other words, the plastic displacement should decrease with decreasing loading rate. The deviation is mainly contributed from an overestimated displacement of plastic deformation at low loading rates. The parameters listed in Table I are therefore valid to describe the mechanical properties of the nc alloy. Accordingly, the anelastic deformation contains at least two relaxation processes having a short relaxation time of 0.37 s (assigned as AN1 process hereinafter) and a long relaxation time of 6.8 s (assigned as AN2 hereinafter) in an as-deposited state. In addition, the creep deformation is described by a viscosity value of 4.2 × 10⁴ GPa·s. After annealed at 673 K for 60 s, the relaxation times of AN1 and AN2 keep at similar values but the viscosity value increases about four times to 16.4 × 10⁴ GPa·s.
Displacement–time curve illustrating an example of the data analysis result.

Experimental and simulated displacement–time curves for tests at (a) 20 mN/s, (b) 1 mN/s, (c) 0.2 mN/s, and (d) 0.05 mN/s.

The fitted material parameters of the nanocrystalline Fe–Ni alloy.

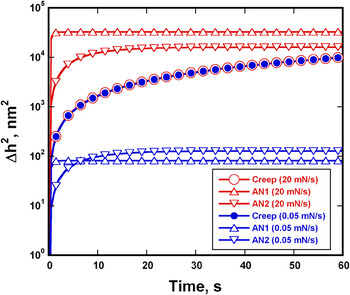
Before further discussion of the material parameters, one issue has to be addressed about why the experimental data of the tests at the highest loading rate were used to yield these parameters. Figure 7 shows the square of holding displacement, contributed from creep and two anelastic processes, respectively, as a function of holding time simulated at two loading rates, 0.05 and 20 mN/s. Due to a long loading time, the anelastic displacements are relaxed mostly on loading and are in a very small portion of the holding displacement. They are thus difficult to be resolved accurately from the low loading rate data. On the other hand, the displacement contributed from creep is relatively large at the late stage of holding and can be resolved without difficulty at all loading rates. Therefore, the data at 20 mN/s were chosen for parameter fitting.
Simulated displacements for elastic and anelastic deformations as a function of holding time.

IV. DISCUSSION
A. Unloading behavior
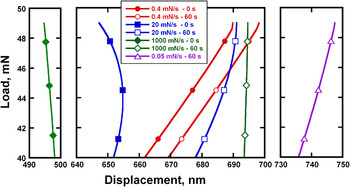
The appearance of the nose in the unloading P–h curve is an effect of time-dependent deformation.Reference Ngan and Tang14, Reference Fujisawa and Swain15, Reference Liu, Lee, Sung and Nguyen23, Reference Lu, Wang, Ma, Huang and Viswanathan24 Feng and Ngan studied the issue using the corresponding principle based on a Maxwell model and concluded that a nose will appear at a low loading rate and/or a short holding time.Reference Ngan and Tang14, Reference Feng and Ngan16 On the other hand, study carried out by Liu et al.Reference Liu, Lee, Sung and Nguyen23 showed that a nose was observed for polymers having a lower viscosity value of ∼102 GPa·s or less. Figure 8 shows the simulated unloading P–h curve for indentation creep tests at different loading rate and holding time using the material parameters for the as-deposited alloy. The loading rate is equal to the unloading rate in all the simulations. Unlike the prediction made by Feng and Ngan, the unloading curve possesses a negative slope at the onset of unloading at an extremely high loading rate of 1000 mN/s without holding at the peak load.Reference Ngan and Tang14, Reference Feng and Ngan16 The slope changes to positive as a 60-s holding time is used. A significant nose can be observed at loading rate 20 mN/s and holding time 0 s. The nose becomes less significant as the holding time is extended to 60 s. A low loading rate of 0.4 mN/s results in a low slope value regardless the holding time. Finally, the unloading slope increases again on further decreasing loading rate to 0.05 mN/s. The simulation results coincide very well with the experimental data shown in the inset in Fig. 4(a) at the loading rates of 0.05–20 mN/s.
Simulated load–displacement curves at different loading/unloading rate and holding time.

The variation of the unloading slope with the loading rate and the holding time can be explained by examining the variation of the displacements contributed from the anelastic and creep processes upon unloading.
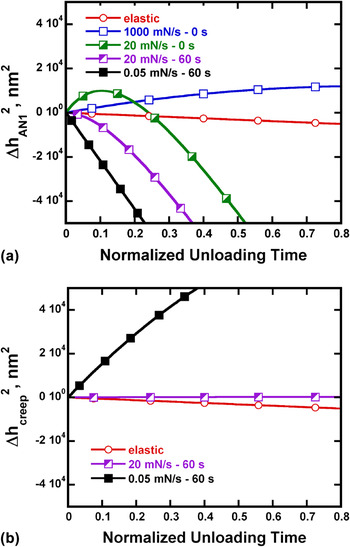
Figures 9(a) and 9(b) show the variation of the anelastic (AN1) and creep displacements as a function of unloading time, respectively. The displacement is expressed as  , where i corresponds to either the anelastic or the creep processes, and the unloading time is a normalized value as
 . Figure 9(a) shows that a significant forward displacement contributed from the AN1 process is relaxed gradually at unloading rate 1000 mN/s and results in a negative slope. This is due to an extremely short loading time of ∼0.05 s, which does not allow a complete relaxation of the forward anelastic displacement on loading. At the loading rate of 20 mN/s, the unloading time (∼2.5s) is long enough for a fully relaxation of the AN1 process within the first 0.5 s. Thus, the nose observed at loading rate 20 mN/s in Fig. 8 is also a result of the relaxation of the AN1 process. For the test carried out at 20 mN/s, the forward displacement of the AN1 process is fully relaxed when the holding time is prolonged to 60 s, but the delay rebound of the backward displacement results in a less substantial nose in the P–h curve. Figure 9(b) shows that the contribution of the creep displacement can be ignored due to short unloading times at high rates of 20 mN/s or higher. However, creep produces a large forward displacement at a very low loading rate of 0.05 mN/s and results in a high slope value as shown in both Fig. 4 and Fig. 8. As a consequence, both the creep and the anelastic deformations are responsible for the high unloading slope or the nose. The nose appearing in the unloading P–h curve for an Al thin film, reported by Feng and Ngan, at low unloading rate is exactly a result of the creep deformation.Reference Feng and Ngan16 A high viscosity value, on the other hand, can result in a pronounced nose at moderate loading rate.Reference Liu, Lee, Sung and Nguyen23 The influence of the anelastic deformation becomes more substantial as the loading time is close to or smaller than the relaxation time.
Simulated displacement–time curves for (a) AN1 process and (b) creep process at various testing conditions. Elastic displacement is also shown for reference.

B. Anelastic and creep behavior
Two anelastic processes, AN1 and AN2, were observed with relaxation time constant of 0.24–0.37 s and 6.4–6.8 s, respectively, in the present case, indicating that at least two kinds of defects might be involved. The ratio of anelastic displacement, in term of  , to the elastic displacement,
 , is as large as 37 at the end of holding segment. This value can be easily yielded by taking the ratio of
 to
 . The inverse of k 1 (or k 2) may therefore be proportional to the concentration of the defects corresponding to the relaxation process. Accordingly, the density of the defects which correspond to the AN1 process is about one order of magnitude higher than that of AN2. The values of
 and
 in fact decrease of about 40 and 70%, respectively, after the sample was annealed at 673 K for 60 s.
A small but distinguishable internal friction peak, having a time constant of 7 × 10⁻³ s at room temperature, was reported in nc nickel.Reference Lohmiller, Eberl, Schwaiger, Kraft and Balk21 The peak was attributed to interactions of dislocations and point defects. A much larger time constant of ∼1.5 × 10⁷ s was reported in nc Ni by Bonetti et al.Reference Bonetti, Campari, Bianco, Pasquini and Sampaolesi28 Moreover, Tanimoto et al.Reference Tanimoto, Sakai and Mizubayashi20 reported that cooperative motion of atoms near the grain boundaries in nc Au can result in a significant anelastic deformation at ambient temperature. The corresponding time constants of the relaxation processes are in a range of 0.4–200 s. The anelastic processes observed in the present alloy may also be related to the cooperative motion mechanism since the alloy contains a high volume fraction of grain boundaries. However, further study is definitely needed to obtain the activation energy to clarify the hypothesis.
Grain boundary sliding is proposed to be one of the major deformation mechanisms for nc metals (Ref. Reference Meyers, Mishra and Benson12 and references therein). Fu et al.Reference Fu, Benson and Meyers29 has shown that the effective viscosity for grain boundary sliding can be expressed as
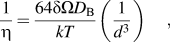
where δ is the grain boundary thickness, Ω is the atomic volume, D B is the diffusivity of grain boundary, and d is the grain size. The grain boundary diffusivity is thus estimated from the grain size (6 nm versus 11 nm) and the viscosity values shown in Table I to be 3.4 × 10⁻²³ (as-deposited) –5.4 × 10⁻²³ (annealed) m2/s by taking δ = 0.5 nm and Ω = 1.95 × 10⁻² nm3. The values are very similar and are higher than those of pure Ni ranging from 5.5 × 10⁻²⁶ to 8.5 × 10−38 m2/s at room temperatureReference Brandes and Brook30 and also higher than that of an nc Fe–40Ni alloy of 1.4 × 10⁻³⁴ m2/s.Reference Kang, Lee, Divinski and Herzig31 Transmission electron microscopy study (result not shown) revealed that the grain boundaries are mostly nonequilibrium in nature. The high diffusivity value obtained in the present study is thus possible as a result of the nonequilibrium nature of the grain boundaries.Reference Kang, Lee, Divinski and Herzig31
C. Mechanical properties
Though the alloy shows viscoelasticity on loading, more than three-fourths of the total displacement is contributed from plastic deformation. Accordingly, after removing the interference of the time-dependent displacement, the hardness and elastic modulus yielded in the nanoindentation tests can still be valid to describe the elastic–plastic characteristics of materials. It should be emphasized that the relaxed modulus in Eq. (11) should be very close to the modulus obtained from uniaxial tensile test at low strain rate. A comparison of the relaxation modulus and the modulus obtained from the unloading curve will be given below.
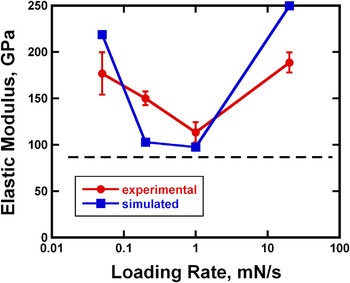
Figure 10 shows the elastic modulus for the alloy in an as-deposited state calculated using the Oliver–Pharr method [Eq. (1)] as a function of loading rate. The dash line represents the relaxed modulus value. The modulus can be as high as 176.9 GPa at a low loading rate of 0.05 mN/s and decreases to 113.4 GPa with increasing loading rate to 1 mN/s. High moduli at low loading rates have also reported for polymers.Reference Lu, Wang, Ma, Huang and Viswanathan24 This phenomenon can be well explained by the high creep displacement in the forward direction, resulting in high contact stiffness, as demonstrated in Fig. 9(b). At the highest loading rate of 20 mN/s, the appearance of the nose at the onset of unloading results in a high stiffness value as well and therefore a high modulus of 189 GPa. The moduli obtained from the simulation data are also represented in Fig. 10 and show a similar trend. A high modulus at high loading rate (or short loading time) has also been reportedReference Feng and Ngan16, Reference Ma, Long, Pan and Zhou17 and can thus be explained by the relaxation of the forward anelastic displacement. Therefore the elastic modulus obtained by the Oliver–Pharr method is close to the relaxed modulus only at a very narrow range of loading rates. This loading rate range within which the Oliver–Pharr method can be applied is determined by the time-dependent material parameter, such as relaxation time constants and viscosity.
Moduli calculated from the experimental and simulated unloading curves as a function of loading rate.

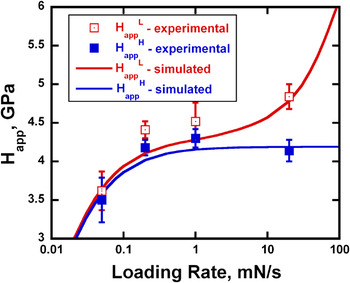
Figure 11 shows the apparent hardness as a function of loading rate for the as-deposited sample. Two apparent hardness values are calculated according to Eq. (3) by using the displacement at the end of the loading segment (assigned as  hereinafter) and that at the end of the holding segment (assigned as
 hereinafter). It is shown that
 increases rapidly with increasing loading rate to 0.2 mN/s, stays at the same value till
 = 1 mN/s and then increases rapidly again with increasing loading rate to 20 mN/s. However,
 first increases with increasing loading rate to 0.2 mN/s and then keeps a constant value with further increasing loading rate. The simulated
 and
 values as a function of loading rate are also shown in Fig. 11 and coincide very well with the experimental data.
Apparent hardness calculated from the experimental and simulated data as a function of loading rate.

The relaxed modulus of the as-sputtered alloy is obtained of 85 GPa, which is much lower than the bulk value of ∼180 GPa.Reference Renaud, Steinemann, Russell and Smith32 The modulus increases dramatically to a value of 141 GPa after the alloy was annealed at 673 K for 60 s. In addition, the apparent hardness (1 mN/s) is 4.3 GPa in the as-deposited state and increases to 7.2 GPa after the alloy was annealed at 673 K for 60 s. In other words, the nc alloy shows a “strengthening on annealing” phenomenon.Reference Huang, Hansen and Tsuji33, Reference Chang, Kao and Chen34 The low modulus and hardness values in the as-deposited state may be a result of high density of defects at the grain boundaries and in the grain interiorReference Chang, Kao and Chen34 and will be discussed in detail in a separate articles.
D. Test method proposed
The present study therefore opens an opportunity to use the depth-sensing method on studying the anelastic and creep behaviors of nc metals with a merit of a small detecting volume needed. The multicycle test offers a quick way to characterize the time-dependent characteristics of a material. The appearance of hysteresis during loading/unloading indicates the presence of anelastic deformation, whereas a substantial displacement on holding without accompanying hysteresis reveals that only creep deformation occurs. A proper viscoelastic model can be chosen accordingly. A series of indentation creep tests at three or four loading rates is suggested to be conducted. The displacement–time relation obtained from indentation creep test at the highest loading rate and a long enough holding time, for instance, 20 mN/s and 30–300 s, respectively, is used to estimate the plastic displacement and to derive the anelastic and creep parameters. The validity of the viscoelastic model adopted can be examined by fitting the displacement–time relation at lower loading rates using the material parameters obtained.
The relaxed modulus and apparent hardness ( ) yielded in the indentation creep test can be justified with the Young’s modulus and yield stress obtained in tensile tests due to their low strain rate nature. The parameters related to the time-dependent deformation can be used for characterizing the underlying mechanism of the anelastic behavior. In addition, the traditional Oliver–Pharr method can still be used to yield the hardness and modulus at high loading rates of 1–10 mN/s for materials exhibiting creep deformation only. A low loading rate of 0.1–1 mN/s is suggested if the materials are deformed anelastically.
Finally, it has to be pointed out that the indentation creep test is carried out in a constant load condition, which is different from the traditional creep test in a constant stress condition. This is the limitation of the technique.
IV. CONCLUSIONS
An analytical method based on the correspondence principle for linear viscoelasticity was developed to characterize nanoindentation behavior for a nc Ni–Fe alloy exhibiting anelastic and creep characteristics. The holding displacement–time data obtained in indentation creep tests at a high loading rate of 20 mN/s were analyzed and material parameters related to the elastic, anelastic, and creep characteristics, such as elastic constant, relaxation time, and viscosity, were derived using a model containing one Maxwell unit and two Kelvin units. The anelastic deformation thus contains at least two relaxation processes having relaxation times of 0.37 and 6.8 s, respectively, and the creep deformation is described by a viscosity value of 4.2 × 10⁴ GPa·s for the alloy in an as-deposited state. The displacement–time relation in the whole testing history was simulated for tests at lower loading rates and coincided well with the experimental data. Accordingly, not only can the test results be interpreted correctly at an arbitrary loading rate and holding time but also the underlying mechanism of creep and anelasticity can be studied in detail in the future. In addition, the modulus and hardness yielded at a proper loading rate, 1 mN/s in the present case, with minimum interference from the viscoelasticity is still valid to describe the elastic–plastic properties of the alloy. A strengthening on annealing phenomenon is observed when the alloy was annealed at 673 K.
ACKNOWLEDGMENTS
This work was financially supported by the National Science Council under NSC-95-2221-E-110-031 and the Center for Nanoscience and Nanotechnology, National Sun Yat-Sen University.