I. INTRODUCTION
YAG (Y3Al5O12) single crystals have been used for more than forty years for solid-state laser media because YAG has a relatively stable lattice and high thermal conductivity.Reference Ikesue1–Reference Koechner3 It has been shown that the optical properties of transparent Nd:YAG ceramics are nearly equivalent to those of single crystals. Transparent YAG ceramics also have potential for transparent armor applications because of their higher hardness, and thus greater abrasion resistance, than most transparent oxide ceramics.
Transparent ceramics are produced from either chemically synthesized powders or by solid-state reaction in which the metal oxides, including the fluorescing element oxide (e.g., Nd2O3, Yb2O3), are mixed and formed into a shape. Vacuum sintering of these solid-state mixtures at ≥1700 °C results in transparent ceramics.Reference Ikesue1 During the reactive sintering approach, Y4Al2O9 (yttrium aluminum monoclinic, YAM), YAlO3 (yttrium aluminum perovskite, YAP), and YAG are formed in situ in the shaped part prior to densification. Incomplete reaction or non-YAG phases significantly degrade the optical properties of YAG. Therefore, an understanding of the factors affecting YAG formation is important to ensure phase purity after sintering as well as for the synthesis of phase-pure YAG powders by solid-state reaction.
The phase diagram of the Y2O3–Al2O3 system shows that only three ternary compounds exist: YAG, YAP, and YAM.Reference Cockayne4 YAM and YAP are intermediate phases which form during YAG formation. YAM, or yttrium orthoaluminate, is monoclinic, whereas YAP can exist in either an orthorhombic (perovskite structure) form or a hexagonal form. Hexagonal YAP is normally observed as an intermediate phase in solution-synthesized YAG, whereas the perovskite phase is observed in solid-state-reacted powders.
The solution synthesis of YAG powders has been extensively reported and these processes often result in the direct formation of YAG from the precursors with a strong exotherm at 950–1000 °C. Although requiring a higher temperature for the YAG phase formation,Reference Ikesue, Kinoshita, Kamata and Yoshida5,Reference Su, Zhang, Shao, Liu, Wan and Yin6 solid-state-reacted powders have advantages in process scalability and lower cost relative to solution- or vapor-synthesized powders. The solid-state reaction sequence has been reported a number of times, but the importance of the initial powder characteristics, and in particular, the relative size of the alumina and yttria particles (d A/d Y) has yet to be investigated.
Lee et al.Reference Lee, Kochawattana, Messing, Dumm, Quarles and Castillo7 reported the phase formation of mixtures of 100–300 nm Al2O3 powder with 1–2 µm Y2O3 powder (a 10:1 Y2O3:Al2O3 size ratio) and a small fraction of 1–2 µm Nd2O3 powder. Their powders were pressed into pellets and calcined for 2 h at temperatures from 1000 to 1500 °C. X-ray diffraction (XRD) showed that YAM, YAP, and YAG formed in the ranges 1100–1200 °C, 1200–1300 °C, and 1300–1400 °C, respectively, with 1500 °C required for complete YAG formation.
A recent paper reported the phase formation progression of an Y2O3/Al2O3 powder mixture over a temperature range of 600–1500 °C.Reference Li, Liu, Liu, Liu, Zeng, Ba, Xie, Jiang, Liu, Pan, Feng and Guo8 The powders were calcined at these temperatures for 4 h, cooled, and analyzed by XRD. This work involved one set of powders, for which the particle sizes were not reported, but they appear from the micrographs to be on the order of 200 nm for the Al2O3 powder and >10 µm for the Y2O3 powder. After milling, the powder appears to be homogeneous in size with all the particles on the order of 200–300 nm and thus with a 1:1 Y2O3:Al2O3 size ratio. They report YAM formation at a temperature as low as 600 °C, YAP and YAG at 1000 °C and 90–95% YAG formation by 1500 °C. While they observe these phases forming at lower temperatures than those reported by Lee et al.,Reference Lee, Kochawattana, Messing, Dumm, Quarles and Castillo7 it is difficult to make a direct comparison since their calcination time was twice as long as that in the earlier study.
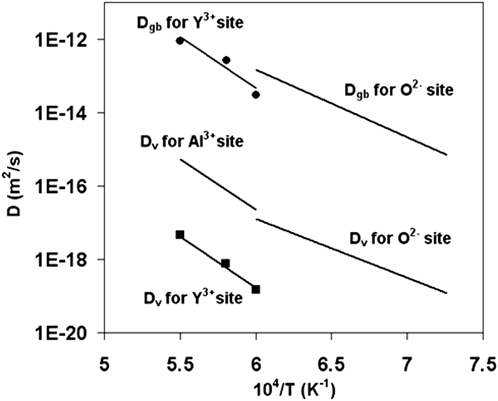
The solid-state reaction of YAG requires the diffusion of Al3+, O2−, and Y3+ species. In Fig. 1 we have collected the existing data for the diffusion of Al3+, Y3+, and O2− in YAG ceramics and crystals.Reference Sakaguchi, Haneda, Tanaka and Yanagitani9–Reference Jimenez-Melendo, Haneda and Nozawa11 The ionic radii for the species of interest are Al3+ = 0.039 nm, Y3+ = 0.102 nm, and O2− = 0.126 nm.Reference Li, Liu, Liu, Liu, Zeng, Ba, Xie, Jiang, Liu, Pan, Feng and Guo8,Reference Sakaguchi, Haneda, Tanaka and Yanagitani9,Reference Parthasarathy, Mah and Matson12,Reference Parthasarathy, Mah and Keller13 As seen in Fig. 1, the kinetics of Y3+ volume diffusion in YAG is more than two orders of magnitude slower than either Al3+ or O2− volume diffusion. In contrast, Y3+ grain boundary diffusion in YAG ceramics is ∼5 orders of magnitude faster than the volume diffusion of Y3+ in YAG.Reference Parthasarathy, Mah and Keller13 During solid-state reaction, the rate-limiting process is governed by the rate of diffusion of the faster diffusing species into the source of the slower diffusing species (i.e., volume diffusion). These data suggest that the solid-state reaction between Al2O3 and Y2O3 is controlled by the volume diffusion of Al3+ into yttria particles, and in fact Glushkova et al. established, using diffusion couples, that Al3+ diffuses into Y2O3, and that Y3+ does not diffuse into Al2O3.Reference Glushkova, Krzhizhanovskaya, Egorova, Udalov and Kachalova14 Consequently, the diffusion distance between Y3+ and Al3+ sources (i.e., Y2O3 and Al2O3 particles) should play an important role during the solid-state reaction of YAG. Thus, reducing the particle size of the starting powders and improving the homogeneity of the mixed batch accelerate the kinetics and the completion of YAG formation at a lower temperature and in less time.
Temperature dependence of the volume and grain boundary diffusion coefficients for each metal ion in stoichiometric YAG ceramics.Reference Lee, Kochawattana, Messing, Dumm, Quarles and Castillo7–Reference Sakaguchi, Haneda, Tanaka and Yanagitani9

As reaction occurs between the Al2O3 and Y2O3, concentric shells of YAM, YAP, and YAG will form on the surface of the Y2O3 particles. Al3+ ions will thus diffuse through the intermediate YAM and YAP and then YAG and Y2O3. Unfortunately, there has been no diffusion data published relating to YAM and YAP, but we expect that the diffusion of Al3+ into the other phases will always be the rate-controlling species. Therefore, the fact that Al3+ must diffuse through them to reach the remaining Y2O3 does not change the results, only the kinetics of the overall reaction.
In this paper, we report the effects of the scale of mixing and the particle sizes of Al2O3 and Y2O3 powders on the YAG phase formation. To vary the scale of mixing, commercial Al2O3 and Y2O3 powders of different particle sizes were used. The formation of the YAM, YAP, and YAG phases was observed in situ using high-temperature XRD and Rietveld refinement. From this data, we demonstrate that decreasing the size of the Y2O3 particles is the most important factor controlling the reaction kinetics and that the particle size of Al2O3 is less important. However, an analysis of size ratio reveals that a more favorable condition exists for 100% YAG formation when the alumina particle size is approximately the same as the yttria particle size.
II. EXPERIMENTAL PROCEDURE
A. Sample preparation
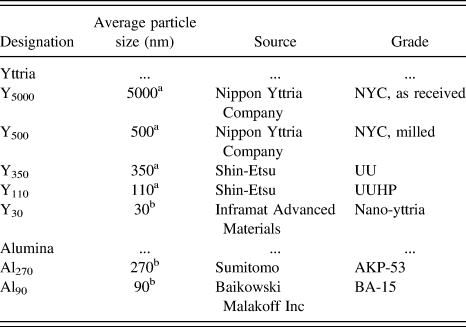
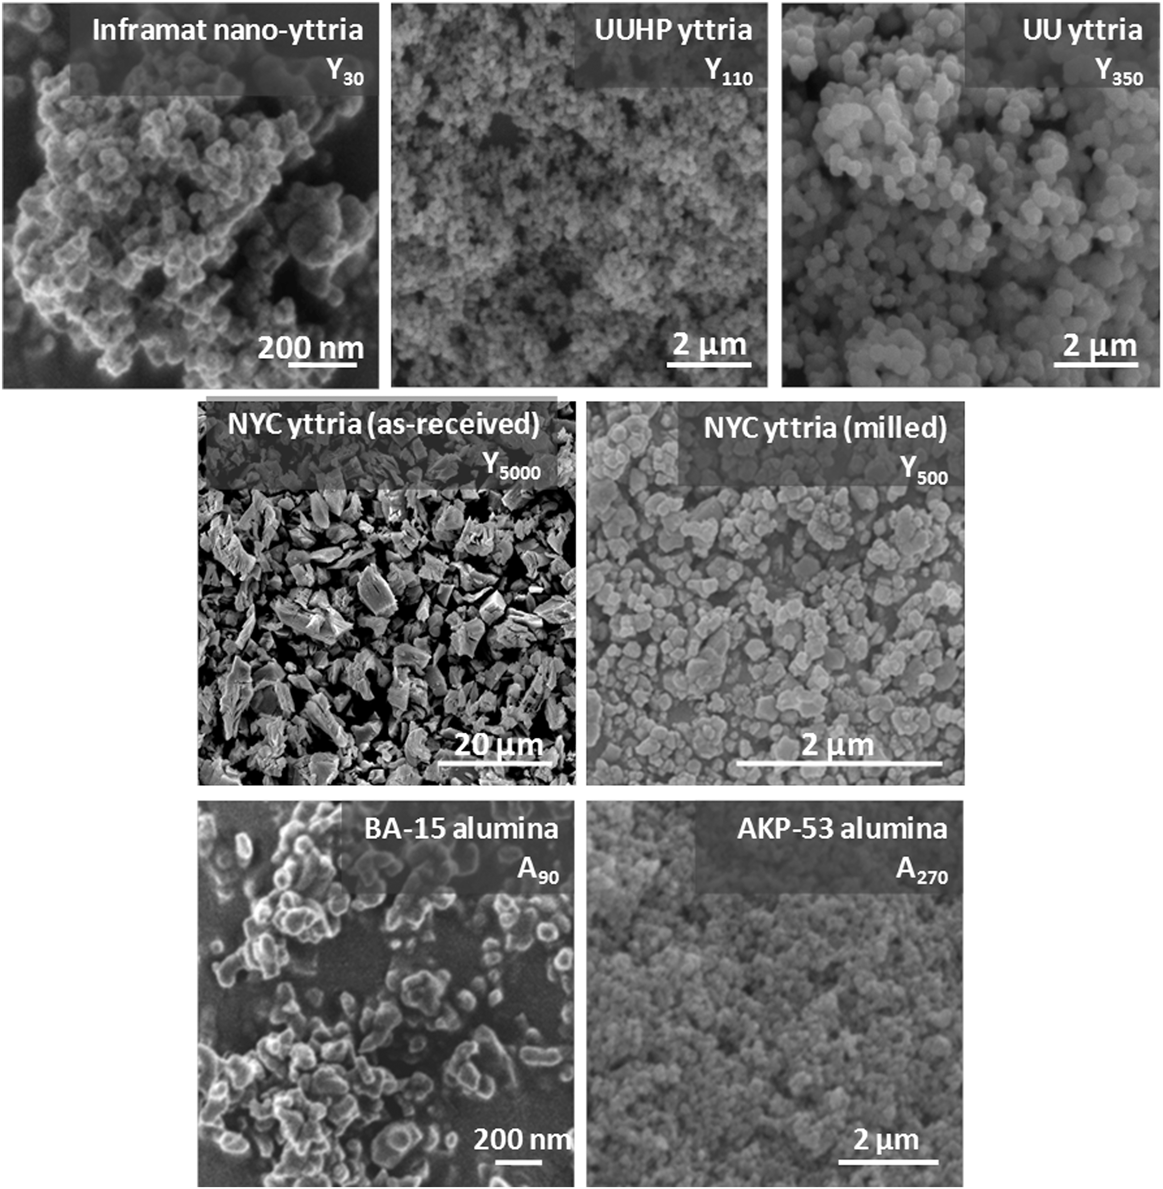
Powder mixtures of YAG stoichiometry (i.e., with molar ratios of Y3+ to Al3+ equal to 3–5 or 48.6 vol% Al2O3 solids basis) were prepared using five different sizes of yttria (Y5000, Y500, Y350, Y110, and Y30, where the numbers indicate the average particle sizes in nanometers) and two sizes of α-Al2O3 (A270 and A90), as listed in Table I. The morphologies of the powders are shown in the micrographs in Fig. 2. The particle sizes used in this paper are those measured from scanning electron microscope (SEM) images (Y5000, Y500, Y350, Y110) or calculated as equivalent spherical particle diameters from Brunauer Emmett Teller (BET) measurements (Y30, A270, A90).
Sources and material specifications for the alumina and yttria powders used in this study.
a Measured from SEM images.
b Calculated from BET specific surface area.
All powders are ≥99.95% pure.
Micrographs of the starting yttria and alumina powders.
Powder mixtures of YAG stoichiometry were dispersed in ethanol and then mixed overnight with high purity alumina balls (99.9%, 5 mm diameter, Nikkato Corporation, Sakai, Japan) in a mill jar. The volume ratio of powder:balls:ethanol was 1:4:8. The homogeneous suspensions were dried in an oven, hand ground with an alumina mortar/pestle, and passed through a 90 μm screen before x-ray analysis.
B. Phase analysis
For x-ray analysis, about 0.5 grams of powder was suspended in a small amount of ethanol. The fluid suspension was dripped onto a sapphire sample holder of 5 cm × 1.5 cm × 0.1 cm. A smooth coating of about 1 mm thickness was achieved by rocking the holder until the suspension dried.
XRD experiments were performed using a custom-built high-temperature XRD stage developed for precise temperature control and temperature uniformity across the specimen.Reference Speakman, Richardson, Mitchell and Misture15 The diffractometer used a Siemens D500 goniometer (Siemens, New York, NY) operating in theta–theta mode with cobalt radiation. A position sensitive detector (PSD) with a collection range of up to 15° 2θ was used to measure the diffracted beam intensity. This setup offered rapid collection of accurate, high count data up to 1450 °C. X-ray scanning was performed on the powder sample during heating at 100 °C increments over the temperature range of 850–1450 °C. The heating rate from room temperature to 850 °C was 180 °C min−1 and from 850 °C to 1450 °C was 60 °C min−1. Data were collected over 10°–70° 2θ. The PSD was adjusted to collect the data only 4° from the center of the sample (to minimize focus error in the collected data) with a scan rate of 10° 2θ per minute. This translates to a count time of roughly 0.12 s per step with a 0.02° step size.
XRD patterns were analyzed using the Jade powder diffraction software package (Material Data Inc., Livermore, CA). Phase compositions were quantified using the software Topas® version 4 from Bruker-AXS. The XRD data refinement range was 10–65° 2θ using 5-term Chebychev background and fundamental parameters' peak shapes along with sample displacement correction. Satisfactory refinements with R wp < 12% were obtained for all samples without preferred orientation or sample roughness corrections, yielding estimated standard deviations of the phase quantities from 0.2 to 0.8 wt%. An example of a refinement plot is illustrated in Fig. 3.
Typical Rietveld fit to the in situ XRD data for 90:30 Al2O3:Y2O3 as measured at 1150 °C, with R wp = 11.4% and GOF = 1.8. Measured, calculated, and difference profiles are shown, with peak location markers for YAM, Al2O3, and Y2O3, from top to bottom. For clarity, only the major peaks are identified, but all the peaks belong to the phases YAM, Al2O3, and Y2O3.
III. RESULTS AND DISCUSSION
A. Effect of Y2O3 particle size on phase formation
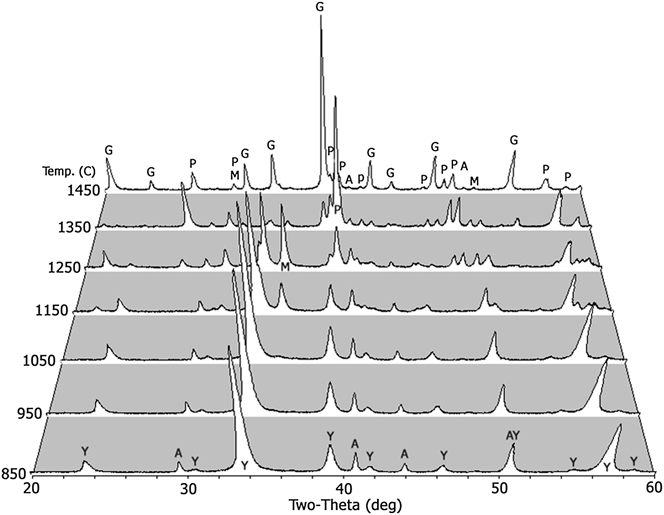
Figure 4 shows a typical series of XRD patterns obtained at 100 °C increments during the heating of a mixture of Al2O3 and Y2O3 powders at 60 °C min−1 to 1450 °C. These data were quantified by the Rietveld refinement analysis to obtain the YAM, YAP, and YAG phase formation plots (Fig. 5) for mixtures composed of the 30, 500, and 5000 nm yttria powders and 270 nm Al2O3 powder. In each case, YAM crystallizes first, followed by YAP (perovskite phase) and then YAG.
XRD patterns of Al2O3 (270 nm) and Y2O3 (500 nm) mixture with the YAG stoichiometry heated to 1450 °C at 60 °C min−1 (A = alumina, Y = yttria, M = YAM, P = YAP, G = YAG).
Quantitative phase formation during heating for three different size yttria powders with 270 nm alumina for (a) YAM, (b) YAP, and (c) YAG. The standard deviation values for the data are all <0.8 vol% (smaller than the size of the markers), and thus are not shown on the plots.
As seen in Fig. 5, there is no change in the temperature at which YAM begins to crystallize when the Y2O3 particle size is reduced from 5000 to 30 nm. However, for the case of the 30 nm Y2O3 powder, the rate of YAM crystallization is fastest and the maximum YAM content is reached at a lower temperature than for the 500 and 5000 nm Y2O3 powders. YAP begins to crystallize at least 100 °C above the initial formation temperature of YAM and the rate of YAP formation increases past the point where the YAM content is highest. All of the samples show a peak in the YAP content at 1350 °C, although the maximum YAP content is inversely proportional to the particle size of the Y2O3 powder. YAG begins to form between 1250 and 1350 °C and rapidly becomes the majority phase at 1450 °C for all of the Y2O3 powders. Residual Al2O3 and YAP are present at 1450 °C for all samples.
The quantitative analysis of the YAM and YAP formation (Fig. 5) shows that the reduction of Y2O3 size from 5000 to 30 nm does not eliminate the formation of the YAM and YAP intermediate phases as seen for the solution-synthesized YAG. However, the XRD patterns do show that the temperature at which YAP is first detected decreases from 1250 to 1150 °C. These results clearly indicate that shortening the diffusion distance for Al3+ into Y2O3 by decreasing yttria particle size increases the reaction rate, so that the reaction is complete in a shorter time and at a lower temperature. These data also confirm that YAP does not form until after YAM has crystallized. In addition, although YAG forms after the initial formation of YAM and YAP, all three phases may coexist due to the sequential nature of the process. The reaction sequence5 is:
 $${\rm{A}}{{\rm{l}}_2}{{\rm{O}}_3} + {{\rm{Y}}_2}{{\rm{O}}_3} \to {\rm{YAM}} + {\rm{A}}{{\rm{l}}_2}{{\rm{O}}_3} \to {\rm{YAP}} + {\rm{A}}{{\rm{l}}_2}{{\rm{O}}_3} \to {\rm{YAG}}\quad {\rm{.}}$$
The effect of Y2O3 particle size on the rate of YAG formation is quantitatively demonstrated by comparing the slopes on the YAG formation plots in Fig. 5. YAG formation rates, as measured between 1350 and 1450 °C are approximately 20, 30, and 48 vol% min−1 for the mixtures with 5000, 500, and 30 nm Y2O3, respectively. These results demonstrate that the reduction of Y2O3 particle size from 5000 to 30 nm accelerates the rate of YAG formation by ∼2.5 times.
The mixture of 90 nm alumina and 30 nm Y2O3 powder has the highest probability for direct formation of YAG since the diffusion distances required for the solid-state reaction to form YAG are the shortest. Figure 6 illustrates the phase formation progression for this mixture as a function of temperature. As with all the other mixtures, YAM crystallizes first, with the first evidence of this phase occurring at 1050 °C. YAP is first detected at 1250 °C and YAG at 1350 °C. Therefore, it is again shown that the direct reaction between Al2O3 and Y2O3 to form single-phase YAG does not occur in the solid state, suggesting that the process is diffusion controlled for the conditions studied here.
Phase formation plots for the Y30A90 powder mixture on heating to 1450 °C at 60 °C min−1. The standard deviation values for the data are all <0.8 vol% (smaller than the size of the markers), and thus are not shown on the plots.
B. Effect of Al2O3 particle size on phase formation
When the alumina particle size is decreased from 270 to 90 nm, the YAM peak is reduced by ∼25 °C. YAP crystallization, on the other hand, begins at about the same temperature (i.e., 1150 °C) as with the coarser Al2O3, and its rate of formation is faster. YAG begins to crystallize at 1300 °C, or ∼25 °C lower, but the YAG formation rates are almost identical by the time the materials reach 1450 °C, and ultimately, the yield of YAG is the same (i.e., 90–91%). At 1450 °C, the XRD pattern for each powder mixture showed the presence of residual Al2O3 and YAP, while all of the Y2O3 was consumed (by 1250 °C and 1350 °C for the samples containing 90 and 270 nm Al2O3, respectively) and all of the YAM was consumed by 1350 and 1450 °C for the 90 and 270 nm Al2O3, respectively. The presence of residual Al2O3 and YAP indicates that when yttria no longer exists, the phase formation is rate limited by the diffusion of Al3+ into the intermediate YAP phase. Thus, the physical distribution of Al2O3 in the mixture and the size of the Al2O3 particles play important roles during phase formation since the Al2O3 particle size and coordination around each Y2O3 particle fixes the distance over which Al3+ must diffuse to reach the core of the YAM/YAP intermediate particles. As a result, the reduction of the alumina particle size should further accelerate the kinetics of phase formation as well as the YAG formation temperature.
C. Scaling effects on solid-state reaction of YAG
We can understand the effect of the reduced yttria particle size by assuming that the reaction kinetics follows a parabolic rate law. For YAG formation the critical diffusion distance is defined as the maximum distance that Al3+ diffuses to reach the center of an Y2O3 particle or layer of particles if there is more than one layer between Al2O3 particles (i.e., when the Al2O3 particle size is greater than the Y2O3 particle size). Therefore, reducing the yttria particle size from 5000 to 30 nm reduces the diffusion distance from 2500 to 30 nm, with a corresponding theoretical increase in the reaction rate to almost 7000 times. Empirically, however, the reaction rate only increased by a factor of two and a half times when the Y2O3 particle size was decreased from 5000 to 30 nm. Thus, in addition to minimizing the diffusion distance into the static phase (e.g., Y2O3), it is critical to have the proper distribution of the Al2O3 powder around the core particle (i.e., maximize the number of alumina–yttria particle contacts). In other words, the Al2O3:Y2O3 particle size ratio may be as important as the yttria particle size in determining the phase formation kinetics.
We are interested in how the alumina and yttria particles are distributed relative to each other since the YAG reaction is controlled by the diffusion of Al3+ into the yttria particles. While a two-particle model has the appeal of showing what happens at particle:particle contacts, it does not account for how the individual particles are distributed and coordinated with each other in the mixture. The ratio of the number of particles of Al2O3 to Y2O3 (N A/N Y) is equal to the ratio of the volumes of the particles ((d Y/d A)3) after taking into account the different densities of the two materials. Bouvard and LangeReference Bouvard and Lange16 showed how the size ratio (R) in a bimodal particle system affects the number of particles (Z im) in contact with a central spherical particle. With an approximation for the dense random packing limit of 0.55,Reference Onoda and Liniger17 the formula for Z im is:
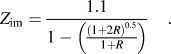 $${Z_{{\rm{im}}}} = {{1.1} \over {1 - \left( {{{{{\left( {1 + 2R} \right)}^{0.5}}} \over {1 + R}}} \right)}}\quad .$$
In our case, the number of alumina particles in contact with a single yttria particle depends on R = d A/d Y. Table II lists number ratios, size ratios, and coordination numbers for all of the yttria/alumina powder combinations studied. We gain further insights into the reacting system by comparing the number of available alumina particles for reaction with the number of particles in contact with each yttria particle. For the 18.5:1 system (Y5000/Al270), Z im = 838 and thus the alumina particles are in contact with the larger yttria particle, but, based on the relative volumes needed to form stoichiometric YAG, there are 6350 alumina particles per yttria particle in the system. This simple calculation demonstrates that the majority of the alumina particles are not in direct contact with any yttria particles for this size ratio; thus Al3+ must diffuse from the most distant alumina particles. However, because the yttria particles have a diameter of 5000 nm, the yttria particle size determines the rate of YAG phase formation for this mixture of particle sizes.
Particle statistics for the Y2O3 and Al2O3 powder mixtures used in this study.
a Adjusted for real volume fractions of Y2O3:Al2O3.
We saw that reducing the yttria particle size from 5000 to 500 nm for a constant alumina particle size of 270 nm yielded essentially equivalent YAG contents at 1450 °C. The small change in the degree of reaction despite the 10-fold reduction in the diffusion distance to the core of the Y2O3 particles suggests that the Al3+ diffusion distance through the 270 nm alumina particle network is rate limiting for this mixture. When the yttria particle size is decreased to 30 nm, YAG formation is 90% complete at 1450 °C. Note that the diffusion distance here is the diameter of the yttria particles, not the radius, since there is a double layer of yttria particles between each adjacent alumina particle and Al3+ must diffuse through an entire layer to meet the diffusion front from a neighboring particle.
A similar result is obtained when the alumina particle size is reduced to 90 nm. In this case, diffusion through the alumina particles is rate limiting for the A90/Y30 case also, and thus Al3+ diffusion was rate controlling during the latter stage of YAG formation.
The above results illustrate that if Al3+ diffusion into the yttria particles is rate limiting, then the source of Al3+, i.e., alumina particles in this case, must be (i) homogeneously distributed with respect to the yttria particles and (ii) the diffusion distance in the yttria particles must be minimized. The scale models in Fig. 7 illustrate how changes in the particle size affect the relative distributions and diffusion distances between the alumina and yttria particles. In the coarsest mixture (Y5000/A270), the critical diffusion distance is the yttria particle radius of 2500 nm. That distance decreases to as small as 30 nm for the nanosize yttria.
Scale models of the distribution of Al2O3 and Y2O3 particles in YAG mixtures. The smaller Y30/A90 and Y30/A270 schematics are to scale with the Y5000/A270 and Y500/A270 drawings. The larger versions of the Y30/A90 and Y30/A270 schematics are included for clarity.
Ironically, although this study analyzed the phase formation behavior of a series of Y2O3:Al2O3 size ratios from 18.5:1 to 1:9, a wide range of number ratios and coordination numbers, it is the yttria particle size or critical diffusion distance that controls the rate of the YAG formation and thus the final YAG yield for the conditions studied here. Figure 8 shows that there is a plateau at ≥90% yield of YAG for critical diffusion distances less than 200 nm (i.e., 400 nm diameter Y2O3 particles), while between 200 and 2500 nm, corresponding to Y2O3 particles of 400 to 5000 nm, the YAG yield plateaus at ∼70 vol%. Clearly, heating for a longer time and a higher temperature would yield >99% YAG.
YAG content at 1450 °C in volume percent for the Y2O3/Al2O3 powder mixtures studied, as a function of critical diffusion distance. The standard deviation values for the data are all <0.8 vol% (smaller than the size of the markers), and thus are not shown on the plot.
IV. SUMMARY
Based on the results presented here and the fact that unless you have atomic mixing of the Al and Y (which, by definition, means that solid-state reaction is not necessary), the solid-state reaction of Al2O3 and Y2O3, regardless of particle size, precludes the direct formation of YAG. The mechanism of phase formation follows the sequence:
 $${\rm{A}}{{\rm{l}}_2}{{\rm{O}}_3} + {{\rm{Y}}_2}{{\rm{O}}_3} \to {\rm{YAM}} + {\rm{A}}{{\rm{l}}_2}{{\rm{O}}_3} \to {\rm{YAP}} + {\rm{A}}{{\rm{l}}_2}{{\rm{O}}_3} \to {\rm{YAG}}\quad {\rm{.}}$$
The reduction of yttria particle size from 5000 to 30 nm accelerates the kinetics of the phase formation of YAM, YAP, and YAG. The YAG formation rate at 1350–1450 °C increases from 20 to 48 vol% min−1 when the yttria particle size is decreased from 5000 to 30 nm when mixed with 270 nm alumina particles. For the composition using nano-yttria, the reduction of the alumina size from 270 to 90 nm results in significantly faster kinetics of phase formation. At 1450 °C, ≥90 vol% phase-pure YAG is obtained by reducing the Y2O3 particle size, thereby shortening the distance the aluminum ions have to diffuse into the yttria particles. Both fine particle sizes and optimal distribution of starting powders are required to accelerate the kinetics of phase formation, allowing phase-pure YAG to form at lower temperatures and in less time.
ACKNOWLEDGMENTS
This work was supported by VLOC Inc. through funds received from VLOC's prime contract #N66001-00-c-6008. SK is particularly grateful for the support of a Royal Thai Scholarship. We also thank E. Meuschke and Baikowski Malakoff Inc. for supplying the BA-15 alumina powder used in this study.