I. INTRODUCTION
Poly(lactic acid) (PLA) not only possesses biodegradability and biocompatibilityReference Jia, Zhang, Tan, Han, Dong and Yang1–Reference Nguyen, Petchsuk, Tangboriboonrat, Opaprakasit, Sharp and Opaprakasit5 but also exhibits good physical and mechanical properties.Reference Rincon Lasprilla, Rueda Martinez, Lunelli, Jaimes Figueroa, Jardini and Filho3, Reference Li, Venkateshan and Sun4 However, flexibilityReference Jia, Zhang, Tan, Han, Dong and Yang1 is its chief defect which limits its scope for practical applications. It is noteworthy that the amount of D-lactic acid affects the melting point and crystallinity of PLA, and also has a great effect on its physical and degradable properties.Reference Rincon Lasprilla, Rueda Martinez, Lunelli, Jaimes Figueroa, Jardini and Filho3 Poly(ethylene glycol) (PEG), which has excellent physical and biomedical properties,Reference Mothé, Azevedo, Rumond and Wang2, Reference Nguyen, Petchsuk, Tangboriboonrat, Opaprakasit, Sharp and Opaprakasit5 such as hydrophilicity, biocompatibility, nontoxicity and nonimmunogenicity, is often used as an ingredient of biomedical and pharmacological materials. Recently, some reportsReference Mothé, Azevedo, Rumond and Wang2, Reference Nguyen, Petchsuk, Tangboriboonrat, Opaprakasit, Sharp and Opaprakasit5–Reference Wu, He, Fan, Jia Wei and Li8 have been published on special block copolymers, which were synthesized from poly(L-lactic acid) (PLLA) and PEG by melting polymerization and possess their chemical structures by virtue of having two or three blocks. The prepared copolymers had distinctive properties on biomedical applications because the PLLA was the main chain of the copolymer structure.
Not only the chemical structures, molecular weights and their distributions have a great effect on the crystallization behavior but also the crystallization conditions and kinetic mechanisms play important roles in the crystallization processes. The crystallization processes can yield some control parameters, such as crystallinity, the sizes and dimensions of the crystals, the molecular structure of lamellar zone, interfacial zone, amorphous region, superstructure and morphology; these properties may affect thermodynamic, kinetic and mechanical behavior of the polymers. Thus, the authors’ studies of crystallization kinetics are intended to explore whether the crystallization conditions and kinetic mechanism have a great effect on crystals of the polymers in the crystallization processes. In general, crystallization behaviorReference Liu, Wang, He, Fan and Li9–Reference Yang and Qiu11 of the polymers always concerns with two factors; i.e., crystallization rate and diffusion rate for a crytallizable unit which diffuses to the edge of a crystal. The crystallization rate is an elemental physical unit for studying the crystallization behavior and divides into the rate of nucleation, the rate of crystal formation and the rate of combining with the former factor; i.e., the overall crystallization rate. Thus, the measurement of crystallization rate is the most important method for studying the crystallization kinetics.
In this study, the poly(L-lactide)-poly(ethylene glycol) (L-PEG) block copolymers have been synthesized using melt polymerization. The chemical structures of L-PEG block polymers were confirmed by proton nuclear magnetic resonance (1H NMR) and Fourier transform infrared spectroscopy (FTIR) analysis, and the molecular weights were also measured by gel permeation chromatography (GPC) analysis. From the data on thermal properties, which were measured by thermogravimetric analysis (TGA) and differential scanning calorimetry (DSC), one can study the changes of melt and crystallization behavior in these series of prepared copolymers and also describe isothermal crystallization kinetics.
II. EXPERIMENTAL
A. Materials
L-lactide (LA) was purchased from Bio Invigor Corp. (Taipei, Taiwan) and poly(ethylene glycol) (PEG) was obtained from Showa Kako Corp. (Osaka, Japan). Chloroform (99.8%) and stannous octanoate (99.0%) were supplied by Japan Reagent Corp. (Osaka, Japan). Tetrahydrofuran (THF) (99.0%) was purchased from Tedia Company (Fairfield, OH). An oil bath heater and Pyrex flasks were used.
B. Methods
1. Preparation of poly(L-lactide)-poly(ethylene glycol) block copolymers
In crucibles were placed 1 mol of PEG200, 1 mol of PEG600, 1 mol of PEG1000, and 1 mol of PEG2000. The crucibles were placed in an oven at 95 °C for 24 h. Then the 4 PEG samples were each added to 100 mol LA in flasks. The flasks were purged of air and filled with nitrogen and sealed. Then, each flask was placed in an oil bath heater at 125 °C. The flasks were held in the oil bath until their temperatures were stable and all reactants had completely dissolved. Then Sn(Oct)2 (0.013% w/w)Reference Mothé, Azevedo, Rumond and Wang2, Reference Nguyen, Petchsuk, Tangboriboonrat, Opaprakasit, Sharp and Opaprakasit5–Reference Hu, Xu, Zhong, Luo and Li7 was added to each flask. The reaction in each flask proceeded at 120–130 °C for 12 h. When the reaction was complete, the products were cooled to room temperature, drawn from the flasks, ground into particles and the settled copolymers with chloroform were filtered.Reference More, Pasale, Honkhambe and Wadgaonkar12, Reference Sonmez, Karadag and Onaran13 Then, the treated products were put into a vacuum oven at 120 °C for 3 h and stored in a desiccator at room temperature until used.
C. Measurements
1. Gel permeation chromatography
Instrument model: Analytical Scientific Instrument Model 500 (Richmond, CA) and experiment conditions: Flow rate: 1 mL/min. We placed 0.03 g of each solid copolymer sample in 5 mL of THF. Once completely dissolved, the samples were centrifuged at 13,000 rpm and 30 °C for 10 min. When centrifugation was complete, we extracted the L-PEG block copolymer samples from the test tubes using a syringe. We then injected the copolymer samples into the GPC machine.
2. Fourier transform infrared spectroscopy
Instrument model: Perkin Elmer Spectrum One (Oshawa, Canada) and experiment conditions: scanning range: 4,000–650 cm−1, ZnSe MIRacle ATR Accessory, resolution: 4 cm−1.
3. Proton nuclear magnetic resonance spectroscopy (1H-NMR)
Instrument model: Bruker 500 MHz NMR (Bruker BioSpin, Switzerland). We placed a 50-μL sample into a NMR rotor, which was subsequently placed in a probe coil at the 54.7° magic angle with the external static magnetic field. We had to spin the coil rapidly to cancel out dipolar interaction and the line broadening effects caused by chemical shift anisotropy. We also used deuterium lock and shimming techniques to enhance field homogeneity and to obtain spectra with high resolution.
4. Thermogravimetric analysis
Instrument model: Perkin Elmer TGA 7 (San Jose, CA) and experiment conditions: N2 flow rate: 10 mL/min, heating from 25 to 500 °C at 10 °C/min.
5. Differential scanning calorimetry
Instrument model: Perkin Elmer series 6 DSC and experiment conditions: N2 flow rate: 10 mL/min. The experimental operations in this study were primarily of nonisothermal crystallization and isothermal crystallization of the sample.
The nonisothermal crystallization experiment was completed in six phases:
(i) Isothermal: place the aluminum plate in the DCS, raising temperature by 10 °C/min to achieve equilibrium temperature of 190 °C.
(ii) Temperature scan: increase the temperature from 25 to 190 °C, at a rate of 40 °C/min.
(iii) Isothermal: maintain the temperature at 190 °C for 2 min to erase the thermal history of the sample.
(iv) Temperature scan: reduce the temperature from 190 to 10 °C, at a rate of 1 °C/min.
(v) Isothermal: maintain the temperature at 10 °C/min to achieve equilibrium temperature.
(vi) Temperature scan: increase the temperature from 10 to 190 °C again, at a rate of 2 °C/min.
The isothermal crystallization experiment was completed in six phases:
(i) Isothermal: place the aluminum plate in the DCS, holding a temperature of 10 °C for 1 min to achieve equilibrium temperature.
(ii) Temperature scan: increase the temperature from 10 to 190 °C, at a rate of 40 °C/min.
(iii) Isothermal: maintain the temperature at 190 °C for 2 min to erase the thermal history of the sample.
(iv) Temperature scan: reduce the temperature from 190 °C to the isothermal crystallization temperatures (T1, T2, T3, T4, T5), at a rate of 50 °C/min.
(v) Isothermal: maintain the temperature of isothermal crystallization (T1, T2, T3, T4, T5) for the required time.
(vi) Temperature scan: increase the temperature from the isothermal crystallization temperatures (T1, T2, T3, T4, T5) to 190 °C, at a rate of 40 °C/min.
III. RESULTS AND DISCUSSION
A. Fourier transform infrared spectroscopy
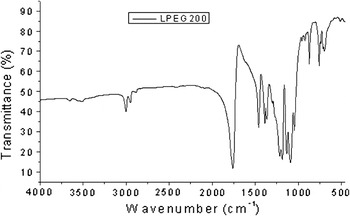
The mid-infrared region (4000–200 cm−1) in infrared spectra is a major absorption area for most organic matter. Thus, the distinct absorption peaks created by specific functional groups and atoms are a significant basis for the identification of organic molecules. Figure 1 shows the FTIR of L-PEG200, where C=O stretching is shown at 1757 cm−1, OH asymmetric stretching is shown at 3650 cm−1, C–O symmetric stretching is shown at 1200 cm−1, and the stretching and symmetric stretching of CH, CH2, and CH3 are shown at 3000 and 1456 cm−1, respectively. The results of the FTIR analysis indicate that all L-PEG copolymers synthesized in this study possess the aforementioned chemical structures.
The FTIR spectrum of L-PEG200.

B. Proton nuclear magnetic resonance spectrometer
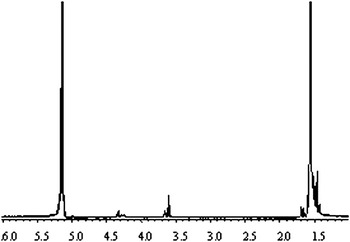
The analytical results of 1H-NMR spectrum (Fig. 2) shows the primary absorption of the PLLA portion in L-PEG copolymers in the form of multiple peaks at δ = 5.15–5.23 ppm. The absorption of methylene units within molecules and the end of the chain are presented by the multiple peaks at δ = 4.2–4.4 ppm and the single peak at δ = 1.4–1.6 ppm, respectively. The primary absorption of the PEG portion in the copolymers is shown in the single peak at δ = 3.65 ppm; the absorption of its methylene units are displayed by the multiple peaks at δ = 4.2–4.4 ppm. The results of the 1H NMR analysis indicate that the L-PEG copolymers synthesized in this study all possess the aforementioned chemical structures.
The 1H NMR spectrum of L-PEG200.

C. Gel permeation chromatography
Gel permeation chromatography is the most basic separation technique to obtain the polydispersity of polymers. Using the significant differences in molecular weight, any oligomers, monomers, or other additives in complex polymer solutions can be separated and analyzed. Table I shows the molecular weights of L-PEG derived via gel permeation chromatography.
The molecular weights and their distributions in L-PEG using gel permeation chromatography.
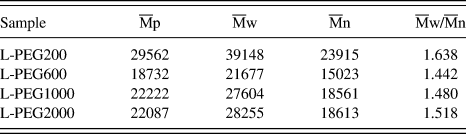
The Mw of L-PEG 200–2000 are 39148, 21677, 27604, and 28255; the respective Mn are 23915, 15023, 18561, and 18613, resulting in Mw/Mn of 1.638, 1.442, 1.480, and 1.518, respectively. Among these copolymers, the determined molecular weight of L-PEG200 was greater than other L-PEG copolymers. Thus, the result shows that self-polymerization is seemingly apt to occur in PEG200 with lower molecular weight.
D. Thermogravimetric analysis
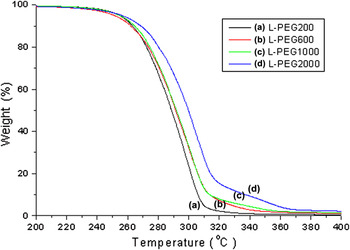
TGA is a technique that determines the mass-temperature relation of a substance, using controlled temperature procedures. The sample is heated within an environment where linear temperature changes can show the curve of the mass change. The compositions of residues and the stability of the original sample and any intermediary products are analyzed. Figure 3 presents the TGA results of LA polymerized with PEGs of various molecular weights. Approximately 5 mg of L-PEG was analyzed using a thermogravimetric analyzer. The temperature was increased from 25 to 600 °C, and the changes in temperature and mass were recorded to determine the decomposition temperatures (Td) of LA polymerized with PEGs of various molecular weights. Td is defined as the temperature at which a weight loss of 5 wt% occurs.
The TGA curves of L-PEG series. (a) L-PEG200 (b) L-PEG600 (c) L-PEG1000 (d) L-PEG2000.

Because self-polymerization is predisposed to occur in PEG monomers during L-PEG200 synthesis, the molecules are arranged in branched chains as opposed to the structure of block copolymers. Consequently, the Td of L-PEG200 is higher than that of L-PEG600. The Td of the remaining block copolymers increases in proportion to the molecular weight of the connecting PEGs. Figure 3 shows that the pyrolysis of L-PEG200 begins to accelerate once the temperature rises to 280 °C, implying that the thermal stability of L-PEG200 is greater than that of L-PEG2000. In addition, the residual ash is relatively more abundant than that of the other L-PEG copolymers.
E. Nonisothermal crystallization
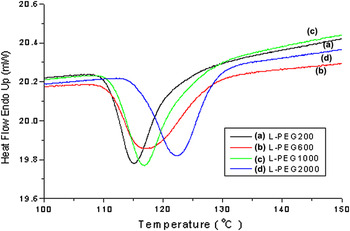
After heating the samples until they have completely melted, crystallization is performed by the cooling in nonisothermal conditions. Figure 4 shows the DSC curve derived from the nonisothermal crystallization of the L-PEGs. The time periods to complete crystallization in the experiment for L-PEG200, L-PEG600, L-PEG1000, and L-PEG2000 were 24.25 min (crystallization peak at 115.17 °C), 24.41 min (crystallization peak at 117.48 °C), 23.35 min (crystallization peak at 116.97 °C), and 21.22 min (crystallization peak at 122.59 °C). The aforementioned results show that PEGs with higher molecular weight in L-PEGs require less time for crystallization, resulting in a higher crystallization rate.
The DSC curves of L-PEG series for scanning from 210 to 25 °C at cooling rate of 1 °C/min. (a) L-PEG200 (b) L-PEG600 (c) L-PEG1000 (d) L-PEG2000.

F. Melting subsequent to nonisothermal crystallization
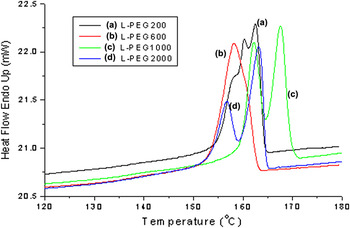
Figure 5 presents the DSC curve of L-PEG melting subsequent to nonisothermal crystallization. The curve shows the various melting points (Tm) and melting peak circumstances of L-PEG200, L-PEG600, L-PEG1000, and L-PEG2000; e.g., L-PEG200 displays triple melting peaks at the melting point of 162.48 °C; L-PEG600, L-PEG 1000 and L-PEG2000 reveal single, double and double melting peaks at the melting points, respectively. These results indicate that the molecular weight of the PEG under investigation is irrelevant to the grain growth of L-PEG copolymers.
The DSC curves of L-PEG series for scanning from 25 to 210 °C at heating rate of 2 °C/min. (a) L-PEG200 (b) L-PEG600 (c) L-PEG1000 (d) L-PEG2000.

G. Isothermal crystallization
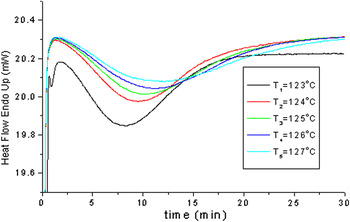
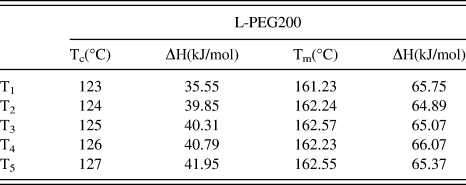
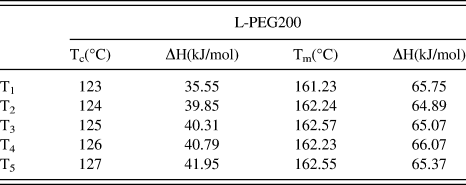
Figure 6 presents the crystallization curves and subsequent melting curves of L-PEG200 at various isothermal crystallization temperatures. The figure shows that the periods for complete isothermal crystallization of L-PEG200 at 127 and 123 °C were 35.78 and 17.48 min, respectively. The results show that the isothermal crystallization rate of L-PEG200 is higher in environments with lower temperatures. Differences in the crystallization rate may be due to lower temperatures being more conducive to nucleation. Table II lists the total enthalpy of melting and crystallization of L-PEG200 at various isothermal crystallization temperatures.
The DSC curves of L-PEG200 at various isothermal crystallization temperatures.

The total melt and crystallization enthalpy of L-PEG200 at various isothermal crystallization temperatures.
H. Relative crystallinity
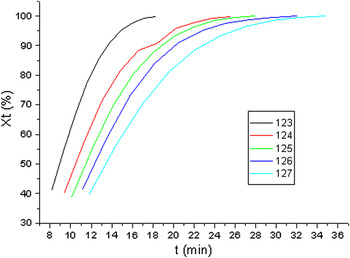
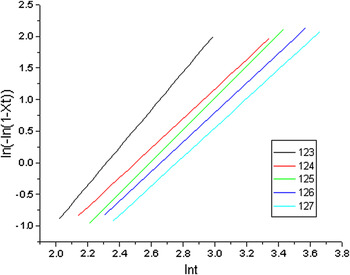
This study uses the Avrami equationReference Liu, Wang, He, Fan and Li9, Reference Yang, Chen, Xu, Li, Wu and Liu10, Reference Wu, Gong and Yang14 to describe the dynamic properties of L-PEG200 isothermal crystallization. Figure 7 presents the isothermal crystallization curves of L-PEG200 at different temperatures, each of which forms a parabola. Observing the straight portions of each curve (the region between 40 and 90%) shows that the slopes of each curve are different and in proportion to the isothermal crystallization temperature. As the slope indicates the crystallization rate at that temperature, a greater slope also signifies a higher crystallization rate. Figure 8 is the ln{−ln[1−Xt]} on the lnt graph calculated by the Avrami equation regarding the isothermal crystallization of L-PEG200 at various temperatures (T1, T2, T3, T4, T5). Each curve in the figure forms straight lines; thus, the index n (the slope of the line) and the crystallization constant k (the x-intercept of the curve) can be obtained using the Avrami equation. For example, the index n and the crystallization constant k of T1 are 2.987 and 2.319, respectively. The index n and the crystallization constant k of T4 are 2.342 and 2.658, respectively.
The curves of Xt versus time for L-PEG200 at various isothermal crystallization temperatures.

The curves of ln[−ln(1−Xt)] versus lnt for L-PEG200 at various isothermal crystallization temperatures.

The Avrami equation primarily describes the dimensions of grain growth and crystallization rates of crystalline substances under various isothermal crystallization conditions. Table III presents the isothermal crystallization data of the L-PEG samples at various temperatures calculated using the Avrami equation. The data in Table III indicate the dimensions, types, and rates of crystallization displayed by the L-PEG copolymers in isothermal crystallization procedures at discrete temperatures. For L-PEG200, Table III shows that the index n in the Avrami equation drops from 2.9 to approximately 2.3 during isothermal crystallization procedures, meaning that the dimensions experienced a reduction from nearly 3 to 2. The index n of L-PEG600 remained between 1.8 and 2.0, maintaining a dimension between 1 and 2. That of L-PEG1000 remained at approximately 2.2–2.8, indicating stable growth in the two-dimensional direction. The index n of L-PEG2000 remained at approximately 2.1–2.6, presenting a similar result to that of L-PEG1000.
The index of Avrami equation (n) and crystallization constant (k) of L-PEG at various isothermal crystallization temperatures.

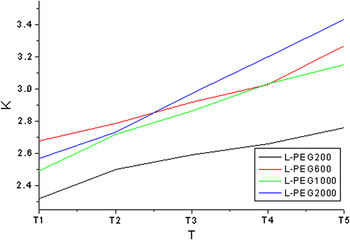
Regarding copolymers synthesized from PEGs with various molecular weights in this study, the dimensional stability of crystallization increased with the molecular weight of the PEG. The crystallization constant k (x-intercept) in the Avrami equation describes the crystallization rate of the substance; the closer the curve is to the origin (the x-intercept approaches 0), the smaller the crystallization constant k, and thus, the increase in crystallization rate. The data in Table III indicate the relation between the isothermal crystallization temperature and the molecular weight of PEG, as well as that between the isothermal temperature and the crystallization constant k. In the same L-PEG copolymer, a lower isothermal crystallization temperature derives a smaller crystallization constant k, hence a higher crystallization rate. Within the same temperature zone, a lighter molecular weight of PEG also generates a smaller crystallization constant k and a higher crystallization rate. Figure 9 displays these phenomena.
The curves of K versus T for L-PEG at various molecular weights.

IV. CONCLUSIONS
This study synthesized LA and PEG of various molecular weights into biodegradable L-PEG copolymers using melt polymerization. Analyses using FTIR and 1H-NMR indicated similar chemical structures in the L-PEG products. The results of TGA analysis showed an increase of thermal stability in L-PEG copolymers with longer PEG chain segments; however, lower molecular weights in PEGs showed higher decomposition temperatures due to self-polymerization. During the nonisothermal crystallization experiments with DSC, the L-PEG product with higher molecular weight in PEGs displayed a higher crystallization rate. During isothermal crystallization, crystallization rates were seemingly higher at lower isothermal crystallization temperatures within a certain temperature range (123–127 °C). However, the corresponding crystallization constants (k) in the Avrami equation were also smaller. The isothermal crystallization results calculated using the Avrami equation revealed that among L-PEG copolymers, the grain growth behavior of L-PEG2000 was more stable, with a growth trend toward three dimensions.