I. INTRODUCTION
Erbium (Er) doped fiber amplifiers (EDFA) have been crucial components for long-range optical fiber telecommunications since the 1990s, due to their emission (Er-4f-shell emission) at a wavelength of 1.54 µm where common optical fibers (SiO2) exhibit minimum loss.Reference Kanjilal, Rebohle, Voelskow, Skorupa and Helm1 However, the loss of their optical emission above 900–1000 °C limits their potential use for aerospace applications, in which harsh environments (including high temperatures) are very common. The development of new generation EDFA depends on improving their thermal resistance, which requires an in-depth understanding of the nanostructural evolution upon thermal exposure. After two decades of research on Er-related emission in silica glass, the nature and the relative variation of phases responsible for changes in optical emission are still poorly understood.
The beneficial effect of introducing excess Si+ into the Er/SiO2 system on the Er 4f-shell emission at 1.54 µm is well-known and reported in the literature.Reference Kanjilal, Rebohle, Voelskow, Skorupa and Helm1–Reference Franzò, Vinciguerra and Priolo3 The presence of excess Si+ in the SiO2 matrix (upon annealing treatment) results in the formation of Si nanocrystals (Si-nc) that are found to act as sensitizers, thus allowing more efficient Er-related optical emission.Reference Kanjilal, Rebohle, Voelskow, Skorupa and Helm1–Reference Priolo, Franzò, Pacifici, Vinciguerra, Iacona and Irrera7 The size variation and inter-particle spacing of Si-nc, as well as the Er concentration are important parameters which affect the efficiency of energy transfer from Si-nc to Er ions and their optical emission.Reference Pi, Zalloum, Wojcik, Knights, Mascher, Todd and Simpson8,Reference Polman, Jacobson, Lidgard, Poate and Arnold9 On the other hand, in recent studies on EDFA for space applications,Reference Thomas, Myara, Troussellier, Burov, Pastouret, Boivin, Melin, Gilard, Sotom and Signoret10,Reference Gusarov, Van Uffelen, Hotoleanu, Thienpont and Berghmans11 it was determined that the presence of Er-doped nanoparticles increases the radiation resistance of optical fibers by reducing the quenching of Er luminescence due to the generation of nonradiative defects.
Kanjilal et al. studied the effects of (single or two-step) rapid thermal annealing (RTA), between 6 s to 10 min of annealing at a temperature range of 850–1050 °C, on Er luminescence with oxidized silicon substrates initially implanted with Si.Reference Kanjilal, Rebohle, Voelskow, Skorupa and Helm1 In another study, the ion-implantation of Er was conducted prior to Si and the formation of nanostructures was investigated after single-step annealing (1100 °C, 1 h).Reference Crowe, Kashtiban, Sherliker, Bangert, Halsall, Knights and Gwilliam12 Even though the formation of Si-nc and Er-rich nanoclusters was observed in earlier studies, the relative evolution of these phases in a broad temperature range is still ambiguous. This is due to the variations in processing conditions such as annealing procedure and ion-implantation order, which prevent direct comparison.
Here, our overall objective is to identify the key structural changes that can improve the thermal stability of Er/Si ion-implanted fused silica. This understanding will be used to determine potential routes for the development of new generation EDFA with superior resistance to thermal, mechanical, and radiation stimuli. We present results on the nanostructural evolution of fused silica containing Er and Si-rich sublayers, as well as their relative evolution upon annealing. The samples were produced using ion-implantation, allowing precise depth and concentration control of atomic species in the silica substrate. To describe the complex precipitation mechanism of nanoclustering in the temperature range studied (900–1200 °C), our experimental methodology compares investigations by Raman spectroscopy and transmission electron microscopy (TEM). This approach provides data on the changes in type and density of chemical bonding, as well as on the depth-distribution, chemical composition, and crystal structure of nanoparticles allowing a complete picture of nanostructural evolution.
II. EXPERIMENTAL PROCEDURE
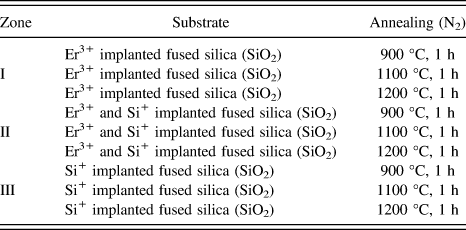
Ion-implantation experiments were designed [as shown in Fig. 1 (inset)] so as to obtain three distinct zones on the same fused silica sample, namely: zone (1) implanted with Er3+ ions only, zone (2) with both Si+ and Er3+ ions and zone (3) with Si+ ions only. Commercial fused silica (UV-grade) substrates are initially implanted with 28Si+ of 50 keV with a fluence of 7 × 10¹⁶ ions/cm2 (≈10 at.%), and Er+3 ion-implantation was subsequently conducted at an energy of 120 keV with a fluence of 5 × 10¹⁵ ions/cm2 (≈3 at.%). The short description of ion-implantation used for the preparation of our samples was reported elsewhere.Reference Zhang, Cai, Zhang, Wang, Wang, Ross and Barba13 Annealing treatments were performed after ion-implantation in an atmosphere controlled tubular furnace (Lindberg–Blue) for 1 h under ultra-high purity nitrogen flux (N2) at the annealing temperatures listed in Table I. Raman spectroscopy and photoluminescence-visible (PL-visible) measurements were conducted using an AIST CombiScope Scanning Probe Microscope (AIST-NT, Novato, California) coupled with 532 nm laser excitation and 100x objective (0.9 NA) enabling the fine positioning of the laser excitation on the sample surface. The spectral resolution of these measurements is about 1 cm−1. Moreover, 405 nm laser-diode was used for PL measurements at room temperature (RT) in the Near-Infrared (NIR) range. For TEM investigations, the cross-sectional samples from individual zones of implantations were initially cut using a low speed diamond saw. Subsequently, cross-sectional TEM discs of about 300 µm thickness were obtained via ultrasonic cutting. After grinding/polishing, an additional dimple grinding was used to obtain discs with ≈20–30 µm thickness in the region of interest. The sample preparation was completed by Ion-beam polishing (PIPS) via Gatan Model 691 (3–10° gun tilt and 4–5 keV) (Gatan Inc., Pleasanton, California). TEM analysis was conducted at 200 kV using a JEOL 2100F microscope (JEOL, Tokyo, Japan), equipped with Oxford Instruments energy dispersive spectroscopy (EDS) Detector (Oxford Instruments, Oxfordshire, UK) used for high resolution EDS mapping (scanning transmission electron microscopy [STEM]).
PL-NIR spectra exhibiting comparison of Er 4f-shell emission (4I13/2→4I15/2) between zone 1) Er3+ and 2) Si+ and Er3+ (designation of different implantation zones on amorphous SiO2 is shown in figure inset; 1) Er3+, 2) Si+ and Er3+, 3) Si+).

The summary of conditions studied.
III. RESULTS AND DISCUSSION
PL measurements upon 900 °C annealing for 1 h (Fig. 1) under N2 atmosphere in the NIR range indicated 4-fold increase in Er 4f-shell emission (4I13/2 → 4I15/2) at 1.535 µm due to the presence of excess Si+ as consistent with previous studies.Reference Kanjilal, Rebohle, Voelskow, Skorupa and Helm1–Reference Franzò, Vinciguerra and Priolo3 The comparison of Raman spectra between zone 2 (co-implanted section with both Si+ and Er3+) and zone 3 (Si+ only implanted zone) annealed under the same conditions (1100 °C, N2 atmosphere for 1 h) is shown in Fig. 2, before (a) and after (b) the subtraction of the fused silica spectral contribution measured in the nonimplanted sample. Raman spectra for zone 2 sample in as-implanted condition exhibits an additional broad PL-emission related to the effects of structural defects induced by ion-implantation [Fig. 2(a)], which superimposes to the fused silica Raman signature. After annealing, the sharp Raman peak observed [Fig. 2(b)] around 519 cm−1 is associated with the well-known optical phonon signature of Si-nc,Reference Faraci, Gibilisco, Russo, Pennisi and La Rosa14,Reference Barba, Demarche, Martin, Terwagne and Ross15 where phonon confinement effects predict energy shifts of 1–10 cm−1 below the bulk Si phonon.
The comparison of Si-nc peaks in Raman spectra obtained from zone-2 (top) and zone-3 (bottom) samples annealed at 1100 °C, before (a) and after (b) removing the contribution of fused silica.
In the Er-implanted region, a broad spectral luminescence emission compatible with Er-4f: 4S3/2-4I15/2 transition (≈553 nm) is observed around a Raman shift of 550 cm−1 (based on 532 nm laser excitation) in Fig. 2(b). A difference of about 160 cm−1 between this measured emission energy and the tabulated value is reported, which is consistent with an energy shift induced by crystal-field effects on the 4I15/2 ground state at RT.Reference Laachira, Moussetadb, Adhirib and Fahlia16 This PL peak superimposes with the Si-nc phonon peak around 519 cm−1 for measurements recorded in zone 2. After subtracting the Er PL emission from the spectral background, the Raman peak intensity of Si-nc phonons indicated a 2-fold increase compared to the region without Er, whereas no significant energy shifts were measured. The intensity of phonon peaks can be directly related to the density of chemical bonds associated with the respective vibrations, as we do not observe a measurable increase in surface roughness of silica substrate upon implantation which has been reported to affect the Raman intensity.Reference Merlen, Sangar, Torchio, Kallepalli, Grojo, Uteza and Delaporte17 When Er is present in the SiO2 matrix in addition to the excess Si, the spectral increase observed in zone 2 indicates that more Si–Si bonding occurs in this sample. In other words, this indicates that the presence of Er promotes the nucleation of Si-nc. The effect of Er atoms on Si-nc nucleation and growth was previously reported, stating that Er promotes the formation of Si-nc (with similar size) in the vicinity of Er under thermal activation. Above a certain Er concentration (3.5 × 10¹⁸ atoms/cm3), increase in Er amount resulted in coalescence of Si-nc.Reference Mustafa, Biggemann, Martens, Kirschhock, Tessler and Breynaert18 However in another study, the increase of Er content was observed to decrease the Si-nc size by acting as heterogeneous nucleation sites.Reference John, Coffer, Chen and Pinizzotto19 On the other hand, in an equivalent system where only Si+ ions were implanted into SiO2 (without Er involved), the fraction of excess Si+ that takes part in the nucleation of Si-nc is only about 50%,Reference Wang, Smirani and Ross20 hence enabling the possibility of the 2-fold increase of Si clustering observed by Raman in Fig. 2.
The apparent formation of additional Si–Si bonds in the system when the initial excess Si+ concentration (≈10 at.%) is similar, can result either from a decrease in the solubility of Si in SiO2 in the presence of Er, thus creating more available Si in the matrix, or from the reaction of Er with SiO2 (or oxygen) leading to the formation of Er–O bonds as well as the increase in the fraction of excess Si that is involved in Si-nc nucleation. The latter is more consistent with thermodynamic studiesReference Ren21 stating that the formation of erbium oxide (Er2O3) is more favourable than silicon oxide (SiO2) in the Si–Er–O system. This is also supported by the reactivity experiments between Er and SiO2 performed at 1150 °C for 9 h under Ar atmosphere, which resulted in the formation of Er2O3 and Er2SiO5 as products.Reference Ren21 As a consequence of the strong chemical affinity between Er and O, segregation effects between Si-nc and Er nanoparticles (Er-np) may occur. This was verified by the in-depth phase analysis of zone 2 (co-implanted section with both Si+ and Er3+) after annealing at 1100 °C for 1 h (N2), clearly indicating the nanoclustering of Er [Fig. 3(a)].
(a) The EDS line-scan of Er-np in zone-2 samples annealed at 1100 °C for 1 h under N2 atmosphere and (b) TEM BFI showing the presence of Si-nc (with fast Fourier transform [FFT] shown at the bottom right corner) in the vicinity of amorphous Er-np.
EDS line-scans (STEM mode) show that Er is mainly concentrated in these high-contrast nanoparticles, which are found to be amorphous in nature on the basis of selected area electron diffraction analysis (not shown). It was reported that Er-clustering was observed even after RTA.Reference Kanjilal, Rebohle, Voelskow, Skorupa and Helm1 High resolution TEM imaging allows to identify nanocrystalline precipitates having inter-planar spacings of 3.84 Å and around 3.13 Å (consistent with {110} and {111} d-spacings of crystalline Si) in the vicinity of Er-rich nanoclusters [Fig. 3(b)]. Hence, in agreement with the Raman results, such nanocrystals were identified as pure Si-nc, surrounded by amorphous Er nanoaggregates. The formation of pure Si-nc in the presence of Er3+ in the matrix is consistent with previous studies.Reference Crowe, Kashtiban, Sherliker, Bangert, Halsall, Knights and Gwilliam12,Reference John, Coffer, Chen and Pinizzotto19,Reference Gourbilleau, Levalois, Dufour, Vicens and Rizk22
The evolution of the Raman spectra recorded from zone 2 (Er3+ and Si+) is shown in Fig. 4 for annealing temperatures increasing from 900 to 1200 °C. A phenomenological approach was used to determine the relative variations of chemical bonds associated with the intensity of phonon peaks involving Si, Er, and O. Three distinct phonon contributions corresponding to the vibration modes of amorphous-Si (a-Si)(475 cm−1), Si-nc (520 cm−1), and Er2O3 (A gvibration mode-640 cm−1) were used for the spectral deconvolution. Measured Raman phonon energies were consistent with the modes determined in the literature for a-Si [around 480 cm−1(Refs. Reference Pellegrino, Garrido, Arbiol, Garcia, Lebour and Morante4 and Reference Zhang, Sun and Zhang23)], Si-nc [≈519 cm−1(Refs. Reference Faraci, Gibilisco, Russo, Pennisi and La Rosa14 and Reference Barba, Demarche, Martin, Terwagne and Ross15)], and Er2O3 [≈622 cm−1(Ref. Reference Yan, Wu, Zhang, Liang, Yang, Pei and Chen24)]. Based on the existing Raman signature of Er2O3, for Er nanoclusters we infer a predominantly 3+ Er valency. On the other hand, the Raman analysis of the 900 °C annealed sample (1 h in N2) exhibits highest quantities of a-Si and Er2O3, whereas the amount of Si that precipitates to form Si-nc has its lowest value at 900 °C [Fig. 4(a)]. When the annealing temperature increases to 1100 °C, the decrease in the concentrations of a-Si and Er2O3 is accompanied by an increase in the relative quantity of Si found in Si-nc (reaching its relative maximum). Further increase in temperature to 1200 °C results in a more pronounced decrease in the relative quantities of a-Si and Er2O3 (their lowest concentration). Moreover, the fraction of Si–Si bonds seems to decrease at 1200 °C compared to 1100 °C, which indicates a decrease in the formation of pure Si-nc above 1100 °C.
Raman analysis of zone-2 samples at different annealing temperatures (a) 900 °C, (b) 1100 °C and (c) 1200 °C. (d) The graph representing the relative variations of phases present at different annealing temperatures.
Based on this in-depth Raman analysis on Er3+/Si+ co-implanted SiO2, below 900 °C the system mainly consists of a-Si, Si-nc (lowest concentration of Si–Si bonds) and Er2O3. Hence, the formation of Er–O bonds is prevalent compared to the formations of Si–O and Er–Si bonds below 900 °C. Additionally, it can be inferred that the increase in annealing temperature from 900 °C to 1100 °C promotes the crystallization of Si, and this is consistent with previous analysis showing that below 1000 °C, Si is mostly present in amorphous form.Reference Franzò, Boninelli, Pacifici, Priolo, Iacona and Bongiorno5 The reduction of Er2O3 concentration during the crystallization of a-Si might be due to the formation of ErSi1.7 phase (lattice mismatch of only ∼1.1% with crystalline Si) which can induce crystallization. This will be further investigated in a forthcoming study. In addition, for annealing temperatures above 1100 °C, as the relative quantities of all three above-mentioned phases decrease, we suggest that a new ternary phase forms involving erbium, silicon and oxygen, which is consistent with literature stating the formation of ErSi3O6 complex compound via atom probe measurements.Reference Talbot, Lardé, Pareige, Khomenkova, Hijazi and Gourbilleau6
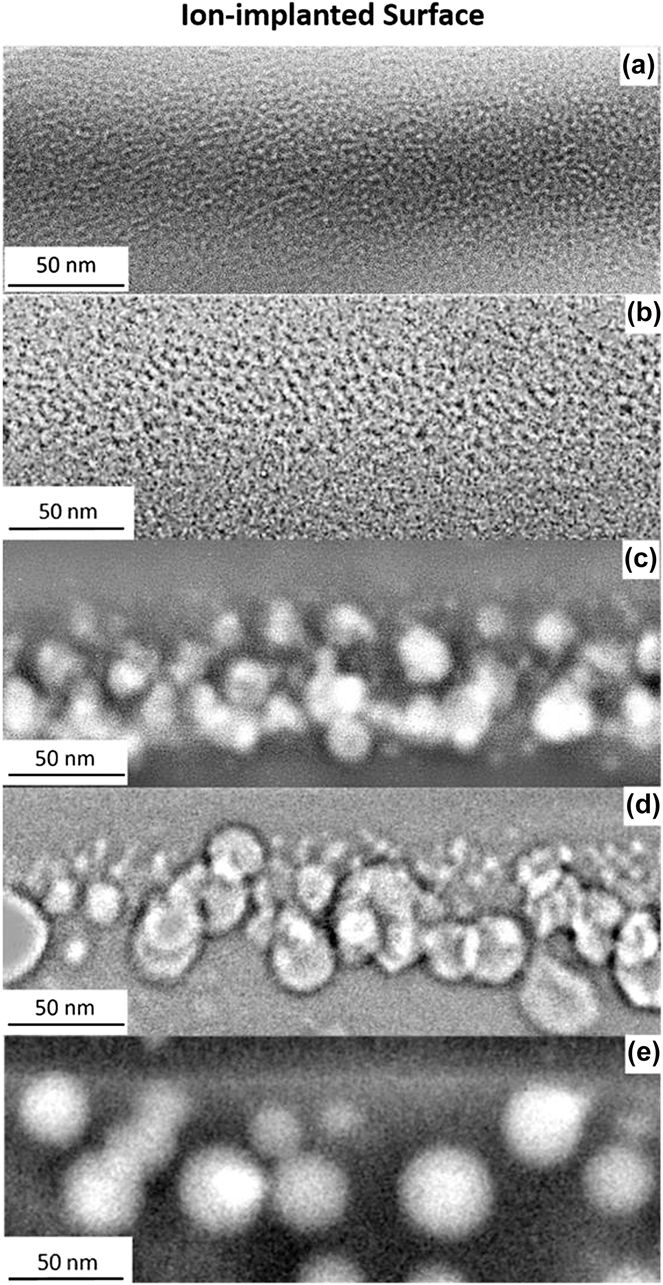
The nanostructural evolution of ion-implanted regions for different zones or annealing temperatures is shown in Fig. 5 via cross-sectional TEM (bright-field) and STEM images under identical magnification. The average particle size analysis is conducted by measuring around 125 to 150 particles for each substrate annealed at different temperatures so that the reported images can be used for direct qualitative comparison of relative sizes and morphologies. Before annealing treatment, no nanoparticle formation occurs, hence the TEM image contrast is only due to implantation damage [Fig. 5(a)]. Figure 5(b) shows the Si+ implanted region occurring at a depth range of ≈15–69 nm [measured directly via image analysis of TEM bright-field image (BFI) shown in Fig. 5(b)] after 1100 °C annealing for 1 h. As shown previously in Fig. 3(b), the observable size of Si-nc (<10 nm) is smaller than Er-np, probably due to the crystallinity of Si-nc compared to amorphous Er-np. The same is observed when the Si+ implanted sample [Fig. 5(b)] is compared with the co-implanted region [Fig. 5(c)] after the same annealing treatment at 1100 °C for 1 h under N2 atmosphere. Both the relatively large size of nanoparticles and the high atomic number of Er (observed as high-contrast particles) enabled the measurements of Er-np size with high accuracy. Hence, the effect of annealing temperature and more importantly the co-implantation of additional Si+ ions on the Er-np nucleation and growth can be analyzed. The average particle sizes in zone 2 samples annealed at 1100 and 1200 °C are 13.3 and 14.6 nm, respectively (±0.5 nm). The increase in temperature from 1100 to 1200 °C results in an increase in the average size of particles and, also affects the particle size distribution significantly [Figs. 5(c) and 5(d)].
TEM and S/TEM images of ion-implanted regions of different zones; (a) zone-1 (Er3+) as-implanted, (b) zone-3 (Si+) at 1100 °C, (c) zone-2 (Si+ and Er3+) at 1100 °C, (d) zone-2 (Si+ and Er3+) at 1200 °C, and (e) zone-1 (Er3+) at 1200 °C.
A more detailed analysis of the Er-np size distribution analysis for zone 1 (Er3+) and zone 2 (Si+ and Er3+) samples is reported in Fig. 6. Apart from the increase in average particle size stated earlier for zone 2 samples, the depth-distribution of Er-np is less extended when annealing at 1100 °C compared to 1200 °C. With the increase in temperature, the number of small-sized Er-np (<10 nm) increases drastically at the depth range of 0–40 nm from ion-implanted surface [Figs. 6(b) and 6(d)]. The amount of small particles increases and the maximum size of already formed Er-np indicates the continuation of nucleation and growth processes. Consistently, for all particle size ranges we investigated, there is a more even spatial distribution of Er-np at 1200 °C compared to 1100 °C: more particles are found in the vicinity of the surface and at higher depths from the implanted surface. In other words, the relative quantity of small-sized Er-rich particles (<10 nm) is higher in zone 2 sample annealed at 1200 °C (>40%) than zone 2 sample annealed at 1100 °C (≈20%) as shown in Fig. 6(a).
(a) Er nanoparticle size variations and the in-depth size distribution analysis for (b) zone-2 at 1100 °C, (c) zone-1 at 1200 °C, and (d) zone-2 at 1200 °C.
This shows that the nucleation of new particles occurs upon annealing above 1100 °C and that the majority of them are found to be between 20 to 60 nm depths where most Si+ ions are also concentrated [depth range: 15–69 nm as shown in Fig. 5(b)]. It can be inferred from the superimposition of these two depth profiles that the newly formed nanoparticles contain more Si compared to those formed below 1100 °C, in agreement with the results presented in Fig. 4(d), where the drop in the relative quantities of Er2O3 and Si found in a-Si and Si-nc was related to the formation of a possible mixed aggregate containing Er, O, and Si. The formation of such Er–O–Si complex compounds has already been reported.Reference Talbot, Lardé, Pareige, Khomenkova, Hijazi and Gourbilleau6,Reference Ren21,Reference Isshiki, De Dood, Polman and Kimura25
To understand the effect of excess Si+ on the formation of Er-np, which results in an increase in Er luminescence at 1.535 µm as shown in Fig. 1, ion-implanted regions of zone 2 (Si+ and Er3+), and zone 1 (Er3+) samples are compared. A more than 2-fold increase in average Er-rich particle size (29.6 ± 0.5 nm in zone 1 compared to 14.6 ± 0.5 nm in zone 2 after 1200 °C, 1 h, N2) was found upon the same thermal exposure [Figs. 5(d) and 5(e)] when the system has no excess Si+ in the SiO2 matrix. The high growth rate of Er-rich nanoparticles upon thermal exposure was also observed in earlier studies on Er3+ implanted SiO2 with no excess Si+.Reference Polman26,Reference Kollewe, Bachmann and Sigle27 It is also shown in Figs. 6(a) and 6(c) that about 40% of the particles in the only Er3+ implanted sample is above 30 nm in size. Similarly, even though the majority of the particles are below 10 nm in zone 2 sample [Fig. 6(a)], no particles sized below 10 nm were observed in zone 1 sample [Figs. 6(a) and 6(c)] after annealing at 1200 °C. Therefore, in the presence of excess Si+, the number of nucleation sites seems to increase for Er clustering, resulting in the formation of a higher number of refined Er-np. In addition, the growth of Er-np is also inhibited by the presence of excess Si+. This feature, where the agglomeration of Er atoms is less effective in the presence of Si, was also observed in samples annealed at 900 °C (not shown). It can be inferred that the lower mobility of Er atoms in the presence of Si is an indication of improved thermal stability up to 1200 °C. This contradicts the findings of Pellegrino et al., which state that the clustering of Er was independent on Si-nc density.Reference Pellegrino, Garrido, Arbiol, Garcia, Lebour and Morante4 For the fabricating parameters used here, the decrease of both the Er-np size and depth-distribution reported by TEM indicates that the presence of excess Si+ with silicon oxide can strongly reduce the Er thermal diffusivity. Hence, the presence of Si-nc would improve the thermal stability of Er-doped fused silica materials.
IV. CONCLUSION
The use of Raman spectroscopy and TEM as complementary characterization techniques for three separate zones of implantation (1: Er3+, 2: Er3+ and Si+, 3: Si+) resulted in an advanced understanding of the nanostructural evolution upon thermal exposure and the effects of silicon and erbium on each other in the ternary Er–Si–O system. The changes in the relative concentrations and size distributions of the main phases formed (a-Si, Si-nc, and amorphous Er-np) after annealing treatments (900–1200 °C) showed a change of growth regime above 1100 °C which strongly suggests the formation of mixed Er/O/Si aggregates. The presence of Si+ increases the thermal stability by inhibiting the growth of amorphous Er-np.
ACKNOWLEDGMENTS
This work was partly supported by the NSERC Strategic Grant STPGP 447377-13 in partnership with MPB Technologies Inc. F.R. acknowledges NSERC for a EWR Steacie Memorial Fellowship. F.R. and A.R. are supported by individual Discovery Grants (NSERC). F.R. acknowledges the Alexander von Humboldt Foundation for a FW Bessel Award.