1. Introduction
Turbulent flows laden with suspended inertial particles of varying densities are ubiquitous in both natural and industrial systems. Examples include river sedimentation, cloud water droplets, nearly neutrally buoyant microplastics in oceans, and protoplanetary disc dust (Balachandar & Eaton Reference Balachandar and Eaton2010; Grabowski & Wang Reference Grabowski and Wang2013; Birnstiel Reference Birnstiel2024). These inertial particles consistently form clusters even in isotropic turbulent flows, preferentially migrating towards and accumulating in specific regions of the associated flow field. Heavy particles (density greater than that of the fluid) preferentially concentrate in high-strain regions while avoiding zones of intense vorticity. Conversely, light particles (e.g. bubbles) preferentially accumulate in high-vorticity regions (Guha Reference Guha2008; Gibert, Xu & Bodenschatz Reference Gibert, Xu and Bodenschatz2012; Bec, Gustavsson & Mehlig Reference Bec, Gustavsson and Mehlig2024). This clustering enhances inter-particle collision rates, a critical mechanism driving natural phenomena such as raindrop formation (Wilkinson, Mehlig & Bezuglyy Reference Wilkinson, Mehlig and Bezuglyy2006; Lee, Baik & Han Reference Lee, Baik and Han2015; Poydenot & Andreotti Reference Poydenot and Andreotti2024) and planetesimal growth (Johansen et al. Reference Johansen, Low, Lacerda and Bizzarro2015; Birnstiel Reference Birnstiel2024).
Since the 1960s, extensive research has examined particle clustering through experimental measurements and direct numerical simulations of turbulent flows, such as the turbulent mixing layer, turbulent channel flow, and homogeneous turbulence (Brown & Roshko Reference Brown and Roshko1974; Maxey Reference Maxey1987; Eaton & Fessler Reference Eaton and Fessler1994; Fessler, Kulick & Eaton Reference Fessler, Kulick and Eaton1994; Monchaux, Bourgoin & Cartellier Reference Monchaux, Bourgoin and Cartellier2012; Bec et al. Reference Bec, Gustavsson and Mehlig2024). Most prominently, the interaction between the turbulence and particles leads to the formation of particle clustering. However, this interaction exhibits characteristics of multiscale and strong stochasticity due to the multiscale structures in the turbulence and its inherent stochastic nature, which significantly challenge the direct resolution of particle clustering dynamics in turbulence (Balachandar & Eaton Reference Balachandar and Eaton2010; Nath, Roy & Kasbaoui Reference Nath, Roy and Kasbaoui2025). These complexities motivate researchers to investigate clustering mechanisms through paradigmatic flow configurations that preserve essential turbulent features, such as vortex structures and shear layers (Kiger & Lasheras Reference Kiger and Lasheras1995; Kasbaoui, Koch & Desjardins Reference Kasbaoui, Koch and Desjardins2019; Varaksin & Ryzhkov Reference Varaksin and Ryzhkov2022). For example, Kasbaoui et al. (Reference Kasbaoui, Koch and Desjardins2019) proposed the ‘route-to-clustering’ mechanism in homogeneously sheared particle-laden flow. In addition, vortices, generated by vortex stretching, are building blocks of turbulent flow (Moffatt, Kida & Ohkitani Reference Moffatt, Kida and Ohkitani1994). These prevalent turbulent flow structures are sampled by the particles, and this critically modulates particle dispersion and drives clustering phenomena (Wen et al. Reference Wen, Kamalu, Chung, Crowe and Troutt1992; Eaton & Fessler Reference Eaton and Fessler1994; Monchaux et al. Reference Monchaux, Bourgoin and Cartellier2012; Prevel et al. Reference Prevel, Vinkovic, Doppler, Pera and Buffat2013; Kapoor, Jaganathan & Govindarajan Reference Kapoor, Jaganathan and Govindarajan2024). Examining vortex effects on particle dynamics is crucial for elucidating particle clustering in turbulent flows. Vortices can trap particles for prolonged durations, with release occurring only upon vortex breakdown (Elhmaïdi et al. Reference Elhmaïdi, Provenzale and Babiano1993; Brocchini et al. Reference Brocchini, Marini, Falchi, Postacchini and Zitti2023). Particulate matter often exhibits non-negligible inertia, and finite particle inertia complicates suspended-phase dynamics and promotes clustering phenomena (Bec Reference Bec2003, Reference Bec2005). Complex vortex systems or rotating backgrounds can trap particles within these cores (IJzermans & Hagmeijer Reference IJzermans and Hagmeijer2006; Ravichandran, Perlekar & Govindarajan Reference Ravichandran, Perlekar and Govindarajan2014; Kapoor et al. Reference Kapoor, Jaganathan and Govindarajan2024).
Particle dynamics under diverse vortical influences have been extensively studied over recent decades. It has been established that vortical attractors can trap particles, promoting clustering. For instance, Nizkaya, Angilella & Buès (Reference Nizkaya, Angilella and Buès2010) examined heavy inertial particles in a two-dimensional inviscid flow field generated by two point vortices. Particles may remain confined within vortices when their Stokes number – a dimensionless measure of particle inertia – lies within specific ranges. This retention occurs due to equilibrium points in the co-rotating reference frame, which act as attracting fixed points (point attractors) that preferentially trap particles. Angilella (Reference Angilella2010) and Angilella, Vilela & Motter (Reference Angilella, Vilela and Motter2014) systematically investigated gravity, viscosity and wall effects on particle dynamics in co-rotating vortex pairs, revealing temporary particle trapping during viscous vortex roll-up. Similarly, point attractors have been validated across diverse vortex systems: isolated spherical vortices and random spherical vortex distributions (Eames & Gilbertson Reference Eames and Gilbertson2004), rotating cylinder-induced bounded vortex flows (Ku et al. Reference Ku, Lin, van Sint Annaland and Hagmeijer2016, Reference Ku, Li, Lin and Jin2019), and non-axisymmetric vortices, including Kirchhoff and Kida vortices (Nath & Roy Reference Nath and Roy2024).
In contrast to scenarios involving point attractors, Tio et al. (Reference Tio, Gañán-Calvo and Lasheras1993a ,Reference Tio, Liñán, Lasheras and Gañán-Calvo b ) demonstrated that heavy particles can remain indefinitely suspended against gravity. These suspended particles asymptotically accumulate along periodic, quasi-periodic or chaotic open trajectories situated above or below the vortices. Marcu, Meiburg & Newton (Reference Marcu, Meiburg and Newton1995) investigated the dispersion of inertial particles near a Burgers vortex, noting that the type of attractor present is influenced by particle inertia. Particles with sufficiently small Stokes numbers are captured by the point attractor at the vortex centre, while those with larger Stokes numbers display stable limit cycle dynamics. Burns, Davis & Moore (Reference Burns, Davis and Moore1999) found that when the particle Stokes number is not excessively large, a periodic attractor governs particle motion in the von Kármán vortex street. Furthermore, IJzermans, Hagmeijer & van Langen (Reference IJzermans, Hagmeijer and van Langen2007) examined the motion of small heavy particles near a helical vortex filament in incompressible flow, revealing that these particles may be attracted to a helically shaped trajectory, which results from the balance between Stokes drag and centrifugal force. Sapsis & Haller (Reference Sapsis and Haller2010) indicated that particles tend to cluster on attracting inertial Lagrangian coherent structures, which are smooth deformations of invariant tori. Clustering surfaces may exist within three-dimensional vortex structures, such as Hill’s spherical vortex. Finally, Park & Park (Reference Park and Park2021) investigated particle dispersion through vortical interactions in a particle-laden upward jet, concluding that the counter-rotating vortex pairs significantly alter the particle dispersion pattern, depending on the velocity ratio (jet/crossflow) and the particle Stokes number.
The trapping of particles promoted by the vortical attractor is highly sensitive to particle inertia. As particle inertia increases, the vortical attractor that subsequently plays a prominent role in long-time particle trapping is altered. Nath & Roy (Reference Nath and Roy2024) demonstrated the point attractor in the non-axisymmetric vortices exhibiting spatial migration, collision and annihilation as inertia increases. There is a critical particle Stokes number, denoted as
 $St_{{cr}}$
, for the occurrence of particle trapping, considering the effect of the vortical attractor (Marcu et al. Reference Marcu, Meiburg and Newton1995; Nizkaya et al. Reference Nizkaya, Angilella and Buès2010; Kapoor et al. Reference Kapoor, Jaganathan and Govindarajan2024). Beyond this critical Stokes number, particle inertia can induce chaotic dynamics of particles in the vortex flows (Angilella Reference Angilella2010; Angilella et al. Reference Angilella, Vilela and Motter2014; Kapoor et al. Reference Kapoor, Jaganathan and Govindarajan2024; Nath et al. Reference Nath, Roy, Ravichandran and Govindarajan2024). The chaotic dynamics of particles feature ’leakage’, i.e. no particles are trapped indefinitely (Grebogi, Ott & Yorke Reference Grebogi, Ott and Yorke1983). But there can be long-lasting transients, which are also crucial for understanding particle motion in vortex flows. As indicated by Kapoor et al. (Reference Kapoor, Jaganathan and Govindarajan2024), particles can remain in the co-rotating vortex pair for tens of rotation time scales, even beyond
 $St_{{cr}}$
. The distribution of particle residence times – the duration for which a particle remains in the vortex system before leaving – can vary significantly, even for particles starting from neighbouring locations, which is indicative of transient chaos. Additionally, the density of the particle can also influence its motion in vortex flows. Inertial particles, whether heavy or light, are typically either centrifuged away from or drawn into vortex cores (Maxey Reference Maxey1987). The critical Stokes number for particle trapping is highly dependent on the particle density ratio between the particle and the fluid (Raju & Meiburg Reference Raju and Meiburg1997; Kapoor et al. Reference Kapoor, Jaganathan and Govindarajan2024). The primary objective of this study is to further investigate the motion of inertial particles within vortex flow, with a particular focus on the effect of the potential vortical attractor on the motion of particles with varying Stokes numbers and densities.
Generally, neighbouring coherent vortices that interact with one another and induce shear are the most likely configurations to be found in real turbulent flows (Legras, Dritschel & Caillol Reference Legras, Dritschel and Caillol2001). Vortex pairs represent simple and universal flow configurations that arise in a wide variety of turbulent flows, such as mixing layers, free-surface flows and two-dimensional turbulence (Brandt & Nomura Reference Brandt and Nomura2010; Leweke, Le Dizès & Williamson Reference Leweke, Le Dizès and Williamson2016). Based on the circulation ratio of the vortex pair, it is typically classified into the co-rotating vortex pair and counter-rotating vortex pair (CVP). Several studies have systematically investigated particle motion within co-rotating vortex pairs. For heavy particles with infinite density, only stable fixed point attractors exist in the co-rotating vortex pair, resulting in particle trapping when
 $St\lt St_{{cr}}$
(Angilella Reference Angilella2010; Nizkaya et al. Reference Nizkaya, Angilella and Buès2010; Ravichandran et al. Reference Ravichandran, Perlekar and Govindarajan2014). However, heavy particles with finite density can exhibit extreme clustering into distinct, smaller objects, including attracting fixed points and limit cycles, which are significantly influenced by the particle Stokes number (Kapoor et al. Reference Kapoor, Jaganathan and Govindarajan2024). Furthermore, beyond the critical Stokes number
 $St_{{cr}}$
, no particle remains trapped indefinitely; instead, long-lasting transient behaviours may occur. As for the particle motion in the CVP, an earlier investigation is documented in the work by Nizkaya et al. (Reference Nizkaya, Angilella and Buès2010). They specifically focused on the motion of particles that are significantly denser than the surrounding fluid. In this context, they observed the presence of various attracting points and rings within the reference frame that rotates with the CVP. However, the conditions under which these attracting points exist in the CVP are limited. As the density ratio between the particles and the fluid decreases – such as in the case of quartz particles suspended in water – the attracting points disappear, while the attracting ring persists (Zhao et al. Reference Zhao, Guo, Zuo and Qian2024). Regarding the motion of inertial particles influenced by the prevailing attracting ring in the CVP, Zhao et al. (Reference Zhao, Guo, Zuo and Qian2024) have only briefly discussed the phenomenon of particle trapping under the assumption of a fixed particle density, without assessing the impact of varying particle density. Furthermore, there is no discussion on the dynamics of particles with a Stokes number below or above the critical value
 $St_{{cr}}$
.
In this study, the particle motion within a CVP is further examined as a representative problem to gain a deeper understanding of the aforementioned issue. We focus on the condition in which the circulation ratio of the vortex pair satisfies
 $\gamma = \varGamma _2/\varGamma _1 \in (-1,0)$
, corresponding to an unequal-strength CVP, where
 $\varGamma _2$
and
 $\varGamma _1$
are the circulations of the vortex within the vortex pair. Building upon our previous study (Zhao et al. Reference Zhao, Guo, Zuo and Qian2024) and inspired by Kapoor et al. (Reference Kapoor, Jaganathan and Govindarajan2024), we systematically investigate the impact of particle density on the motion of inertial particles in the CVP in this study. We also develop a comprehensive diagram that illustrates the conditions for the trapping of inertial particles. The small, dilute, heavy inertial particles, specifically those with density factor
 $R\in (0,1)$
and Stokes number
 $ St\in (0,0.3)$
, are considered. Additionally, we discuss the dynamics of inertial particles, including the mechanisms of trapping and leakage within the CVP when the particle Stokes number is either below or above the critical value
 $St_{{cr}}$
.
The remainder of this paper is organised as follows. Section 2 describes an overview of the physical model of inertial particles in the CVP, along with the associated governing equations. In § 3, we present analytical considerations regarding weakly inertial particles in CVP flows. The attracting ring of particles with a different density is identified, which leads to the formation of particle trapping in the CVP flow. In § 4, we conduct numerical simulations of moderately inertial particles. The inertia of the particles plays a significant role in determining particle trapping and leakage in the CVP. There exists a critical Stokes number, denoted as
 $St_{{cr}}$
, for a given particle density and circulation ratio of the CVP. When
 $St\lt St_{{cr}}$
, the particle trapping occurs in the CVP. Conversely, when
 $St\gt St_{{cr}}$
, the dynamics of the particles exhibits finite-time ‘leakage’. Finally, a summary is provided in § 5.
System of unequal-strength CVP flows. (
 $a$
) Schematic of the flows in the inertial frame. The CVP exhibits differential circulation intensities with
 $\varGamma _1\gt 0$
(anticlockwise rotation) and
 $\varGamma _2\lt 0$
(clockwise rotation), forming an
 $\varOmega$
-rotating dipole about the stationary centroid
 $I$
. (
 $b$
) Schematic of the flows in the
 $\varOmega$
-rotating frame. Separatrices (bold black) through hyperbolic fixed points (yellow) partition four dynamical domains. Simply-connected domains I–III correspond to the V2 core, the V1 core, and the recirculation zone, respectively. (
 $c$
) Velocity field distribution with
 $\gamma = -0.2$
in a coordinate system with an
 $x$
-axis translational displacement relative to that in (
 $b$
). In this reference frame, the centres of vortices V1 and V2 are positioned at
 $(0.5,0)$
and
 $(-0.5,0)$
, respectively.

2. Governing equations for the flow and particles
We investigate particle-laden flow dynamics in an Eulerian–Lagrangian framework, where the volume fraction of the particles is
 $\varPhi _p \leqslant 1.0 \times 10^{-6}$
, and the Reynolds number of the carrier flow is
 ${Re} \gg 1$
. Therefore, we can neglect the feedback effects of the particles on the carrier flow (corresponding to the one-way coupling regime) (Elghobashi Reference Elghobashi1994), and the viscous effects in the continuum phase.
This study focuses on particle transport dynamics in CVP flows with unequal vortex strengths, generated by two counter-rotating vortices, V1 (anticlockwise) and V2 (clockwise). The circulations of the two vortices are defined as
 $\varGamma _1\ (\gt 0)$
and
 $\varGamma _2\ (\lt 0)$
, respectively, with ratio
 $\gamma = \varGamma _2/ \varGamma _1 \in (-1,0)$
. As governed by the Biot–Savart law, the vortices execute mutual rotation about a stationary point
 $I$
with angular velocity
 $\varOmega = (\varGamma _1+\varGamma _2)/2\pi b^2$
, where
 $b$
represents the constant separation distance between the centres of the two vortices (Leweke et al. Reference Leweke, Le Dizès and Williamson2016; Zhao et al. Reference Zhao, Guo, Zuo and Qian2024), as shown schematically in figure 1(
 $a$
).
In the co-rotating reference frame with the angular velocity
 $\varOmega$
about the centre
 $I$
, the positions of the two vortices become stationary at
 $\boldsymbol{X}_{c1} = (b\gamma /(1+\gamma ),0)$
and
 $\boldsymbol{X}_{c2} = (b/(1+\gamma ),0)$
, respectively, as shown in figure 1(
 $b$
). By choosing characteristic length
 $b$
, time
 $T=1/ \varOmega$
and velocity
 $U=b/T$
, we non-dimensionalise the relevant physical parameters. Then the dimensionless velocity field of the CVP flows can be derived as
 $\boldsymbol{u}(\boldsymbol{X},\gamma ) = (\partial \varPsi / \partial y, -\partial \varPsi / \partial x)$
, where the stream function in the co-rotating frame is
 \begin{equation} \varPsi (\boldsymbol{X}) = \phi (\boldsymbol{X}-\boldsymbol{X}_{c1})+\gamma\, \phi (\boldsymbol{X}-\boldsymbol{X}_{c2})+2\left | \boldsymbol{X}\right |^2, \end{equation}
where
 $ \phi (\boldsymbol{X}) = -\ln | \boldsymbol{X} |/(1+\gamma )$
, and
 $\boldsymbol{X}$
is the position vector in the co-rotating reference frame (Nizkaya et al. Reference Nizkaya, Angilella and Buès2010; Zhao et al. Reference Zhao, Guo, Zuo and Qian2024).
The representative streamlines of the steady counter-rotating vortex flows are also shown in figure 1(
 $b$
), and the velocity magnitude distribution of the flow with
 $\gamma = -0.2$
is presented as a specific case in figure 1(
 $c$
). Through analysis of the fluid dynamics, the flow field can be partitioned into four distinct fluid domains bounded by separatrix streamlines (thick black curves) (Leweke et al. Reference Leweke, Le Dizès and Williamson2016). The simply connected domains I (light blue), II (red) and III correspond to the V2 core, the V1 core, and the recirculation zone, respectively. These domains exhibit vortex-locked recirculation characterised by closed streamlines orbiting individual vortex cores, and greatly govern particle entrapment mechanisms. Domain IV constitutes the far-field regime, where streamlines encircle the entire vortex array through synodic orbital paths.
We analyse the dynamics of inertial particles in CVP-dominated flows under gravity-free conditions, focusing on rigid spherical particles of radius
 $a$
with density exceeding that of the fluid. The analysis assumes low Reynolds number regimes where both the particle slip Reynolds number
 ${Re}_p = a\,|\boldsymbol{v}-\boldsymbol{U}(\boldsymbol{X}_p)|/\nu$
(characterising relative motion between particles and fluid) and the shear Reynolds number
 ${Re}_s = a^2|\boldsymbol{\nabla }\boldsymbol{U}|/\nu$
(quantifying velocity gradient effects) remain negligible – a valid approximation for sufficiently small particles (Kapoor et al. Reference Kapoor, Jaganathan and Govindarajan2024). Here,
 $\boldsymbol{v}$
is the velocity of the particles,
 $\boldsymbol{U}(\boldsymbol{X}_p)$
is the velocity of the fluid at the location of the particles
 $\boldsymbol{X}_p$
in the laboratory reference frame, and
 $\nu$
represents the kinematic viscosity of the fluid. The assumption of dilute dispersion indicates that
 $\varPhi _p \lt 1.0\times 10^{-6}$
(Elghobashi Reference Elghobashi1994). Under the established framework, the kinematic behaviour of inertial particles is mathematically prescribed by the dimensionless equation system
 \begin{equation} \frac {\mathrm{d}\boldsymbol{X}_{p}}{\mathrm{d}\tau } = \boldsymbol{v}, \end{equation}
 \begin{equation} \frac {\mathrm{d} \boldsymbol{v}}{\mathrm{d} \tau }=R \frac {\mathrm{D} \boldsymbol{U}\left (\boldsymbol{X}_{p}\right )}{\mathrm{D} \tau }+\frac {\boldsymbol{U}\left (\boldsymbol{X}_{p}\right )-\boldsymbol{v}}{St}, \end{equation}
where
 $\tau$
is the non-dimensional time, and
 $\mathrm{D} \boldsymbol{U} (\boldsymbol{X}_{p} )/\mathrm{D} \tau$
is the fluid acceleration (Mathai, Lohse & Sun Reference Mathai, Lohse and Sun2020). The two non-dimensional numbers that feature the characteristics of the particle in the equation are the effective density factor
 $R$
, and the Stokes number
 $St$
, defined as
 \begin{equation} R\equiv 3/(2\beta +1), \quad St\equiv \tau _p/T, \end{equation}
where
 $R$
is introduced to account for the added mass with a coefficient for spherical particles equal to 0.5 (Auton, Hunt & Prud’Homme Reference Auton, Hunt and Prud’Homme1988), and
 $\beta$
is the ratio between the particle density
 $\rho _p$
and the fluid density
 $\rho _f$
. The Stokes number
 $St$
indicates the particle inertia and is expressed as the ratio between the characteristic time of the particle
 $\tau _p = a^2/3\nu R$
and the characteristic time of the fluid
 $T$
(Stokes Reference Stokes2009). The density factor
 $R$
exhibits different physical regimes: approaching zero for particles with infinite density (heavy solid inclusions), unity for neutrally buoyant particles that match the fluid density, and reaching
 $R=3$
in the bubble limit. Meanwhile, the Stokes number
 $St=0$
limit recovers ideal tracer behaviour with perfect streamline following. Our analysis focuses on the parameter space
 $0\lt R\lt 1$
and
 $0\lt St\lt 0.3$
, corresponding to a system with heavy inertial particles.
Equations (2.2) and (2.3) constitute a simplified non-dimensional formulation of the classical Maxey–Riley equations (Maxey & Riley Reference Maxey and Riley1983), retaining only dominant forcing mechanisms in our parameter space. The right-hand side of (2.3) resolves the primary contributions of the viscous Stokes drag term and the fluid stress gradient term (including the effect of added mass). Faxén correction terms – which introduce spatial derivatives of the flow field to account for finite particle size effects – are excluded by our assumption of small particles. This simplification is further justified by operating in the dual limit of low particle Reynolds number
 ${ Re}_p$
and weak shear Reynolds number
 ${Re}_s$
regimes that collectively suppress lift forces (Saffman and Magnus effects) and negate inter-particle collisions in dilute suspensions. The historical Basset force is also omitted considering that the effect of the historical Basset force always appears at a higher order
 $O(St^{3/2})$
than the other forces obtained by an asymptotic scheme analysis valid for the particle with small Stokes number in vortical flows (Lasheras & Tio Reference Lasheras and Tio1994).
Within our rotating coordinate system co-moving with the CVP flow structure, the particle dynamics acquires extra contributions from the centrifugal (
 $(1-1/3R)\boldsymbol{X}'_p$
) and Coriolis (
 $(1-1/3R)(-2\boldsymbol{e}_z \times \boldsymbol{v}')$
) force terms, where
 $\boldsymbol{e}_z$
is the unit vector along the
 $z$
-axis, and
 $\boldsymbol{v}'$
and
 $\boldsymbol{X}'_p$
denote the velocity and location of the particle in the rotating reference frame, respectively. Incorporating these into our governing equations then transforms the particle dynamics into the following autonomous system of four first-order scalar equations (Burns et al. Reference Burns, Davis and Moore1999; Nizkaya et al. Reference Nizkaya, Angilella and Buès2010):
 \begin{equation} \left \{ \begin{aligned} & \dfrac {\mathrm{d} x'_p}{\mathrm{d} \tau } = v'_x, \\[2mm] & \frac {\mathrm{d} y'_p}{\mathrm{d} \tau } =v'_y, \\[2mm] & \frac {\mathrm{d}v'_{x}}{\mathrm{d}\tau }=R \frac {\mathrm{D} u\big(x'_p, y'_p\big)_{x}}{\mathrm{D} \tau }+\frac {u\big(x'_p, y'_p\big)_{x}-v'_{x}}{St}+\left (1-\frac {1}{3} R\right )\big (x'_p+2 v'_{y}\big ),\\[2mm] & \frac {\mathrm{d} v'_{y}}{\mathrm{d} \tau }=R \frac {\mathrm{D} u\big(x'_p, y'_p\big)_{y}}{\mathrm{D} \tau }+\frac {u\big(x'_p, y'_p\big)_{y}-v'_{y}}{St}+\left (1-\frac {1}{3} R\right )\big (y'_p-2 v'_{x}\big ). \end{aligned} \right . \end{equation}
3. Trapping dynamics of weakly inertial particles
Our analysis begins with the fundamental trapping mechanics governing weakly inertial particles (
 $St\rightarrow 0$
) in CVP flows. For this regime, the autonomous phase-space formulation (2.5) becomes amenable to asymptotic treatment via singular perturbation theory (Johnson Reference Johnson2005).
The variables
 $x'_p$
and
 $y'_p$
change slowly at speeds of
 $O(1)$
, while the fast variables
 $v'_x$
and
 $v'_y$
vary rapidly at speeds of
 $O(1/St)$
. This dichotomy leads to a typical singular perturbation problem. We can define a new time scale
 $\tau ^*=\tau /St$
in terms of the small perturbation parameter, transforming the original problem into a regular perturbation problem. Given that the initial conditions for the particles are specified by (3.1), we can solve it using the regular perturbation method:
 \begin{equation} \boldsymbol{X}_p^{\prime 0}=\Big(x_p^{\prime 0},y_p^{\prime 0}\Big) \quad \text{and} \quad \boldsymbol{v}^{\prime 0}=\Big (u \Big(\boldsymbol{X}_p^{\prime 0}\Big)_x^0,u \Big(\boldsymbol{X}_p^{\prime 0}\Big)_y^0\Big ), \end{equation}
where the particle velocity is equal to the fluid velocity at the particle location initially. As demonstrated in our previous kinematic framework (Zhao et al. Reference Zhao, Guo, Zuo and Qian2024), the resultant particle velocity field can be expressed as
 \begin{equation} v'_x= u \big(x'_p, y'_p \big)_{x}+St\left \{\left (1-\frac {1}{3} R\right )\Big (x'_p+2 u\big(x'_p, y'_p\big)_{y}\Big )+(R-1) \frac {\mathrm{D} u \big(x'_p, y'_p \big)_{x}}{\mathrm{D} \tau }\right \} \!, \end{equation}
 \begin{equation} v'_y= u \big(x'_p, y'_p \big)_{y}+St\left \{\left (1-\frac {1}{3} R\right )\Big (y'_p-2 u\big(x'_p, y'_p\big)_{x}\Big )+(R-1) \frac {\mathrm{D} u \big(x'_p, y'_p \big)_{y}}{\mathrm{D} \tau }\right \}\!. \end{equation}
The vector form of the particle velocity field is written as
 \begin{equation} \boldsymbol{v}'=\boldsymbol{u}\big (\boldsymbol{X}'_{p}\big )+St\left \{\left (1-\frac {1}{3} R\right )\big (\boldsymbol{X}'_{p}-2 \boldsymbol{e}_{z} \times \boldsymbol{u}\big (\boldsymbol{X}'_{p}\big )\big )-(1-R) \frac {\mathrm{D} \boldsymbol{u}\big (\boldsymbol{X}'_{p}\big )}{\mathrm{D} \tau }\right \} \!; \end{equation}
the second term on the right-hand side of the equation is the perturbed particle velocity, indicating the influence of the inertia of the particle.
The divergence of the particle velocity at any spatial point
 $\boldsymbol{X}$
is given by
 \begin{equation} \boldsymbol{\nabla }\boldsymbol{\cdot }\boldsymbol{v}'= -St\left ((1-R)(\boldsymbol{s}^2-\boldsymbol{\omega }^2)+2\left(1-\frac {1}{3}R\right)\right )=St\!Q_{\textit{rot}}, \end{equation}
where
 $\boldsymbol{s}$
and
 $\boldsymbol{\omega }$
are the strain-rate tensor and the rotation-rate tensor of the flow field
 $\boldsymbol{u}$
, respectively, and
 $Q_{\textit{rot}}$
denotes the Okubo–Weiss parameter in the rotating frame of reference (Ravichandran et al. Reference Ravichandran, Perlekar and Govindarajan2014). Equation (3.5) establishes that the particle velocity divergence originates from the perturbed particle velocity. When
 $St=0$
, the divergence vanishes identically, enforcing particles to strictly follow Lagrangian streamlines, thereby preserving the initial particle spatial distribution. However, finite inertia (
 $St\gt 0$
) introduces density-dependent segregation. The specific value of the divergence of the particle velocity is determined by the flow field
 $\boldsymbol{u}$
and the density factor
 $R$
. A positive divergence leads to particle evacuation through local stretching, whereas a negative divergence indicates potential local clustering of the particles.
Figure 2 analyses the spatial distribution of
 $-Q_{\textit{rot}}$
for particles with density factors
 $R=0.2$
(heavy) and
 $R=0.8$
(near-neutrally buoyant) in CVP flows under circulation ratios
 $\gamma =-0.2$
and
 $\gamma =-0.4$
. The peak negative
 $Q_{\textit{rot}}$
intensities (marked red) consistently localise within the V1(II) and V2(I) vortex cores. The trapping propensity of heavy particles is governed by the divergence condition in (3.5). Moreover, the distribution of
 $-Q_{\textit{rot}}$
is modulated by both the carrier flow field and the effective density factor
 $R$
. As the circulation ratio
 $\gamma$
decreases and the density factor
 $R$
increases, the domain with negative values of
 $Q_{\textit{rot}}$
shrinks. This parametric modulation affects the trapping of the particles in the CVP flows.
Distribution of the negative Okubo–Weiss parameter
 $-Q_{\textit{rot}}$
overlaid with the particle-attracting ring
 $S_0$
(marked blue) for weakly inertial particles with varying
 $\gamma$
and
 $R$
combinations: (
 $a$
) case P1 with
 $\gamma =-0.2$
and
 $R=0.2$
; (
 $b$
) case P3 with
 $\gamma =-0.2$
and
 $R=0.8$
; (
 $c$
) case P2 with
 $\gamma =-0.4$
and
 $R=0.2$
; (
 $d$
) case P4 with
 $\gamma =-0.4$
and
 $R=0.8$
. Domains I–III denote the V2 core, V1 core, and the recirculation zone, respectively.

To quantify preferential trapping of heavy particles in CVP flows, we define an index
 $I(S) = \mathrm{d}(V_p(S))/\mathrm{d}\tau$
to account for the rate of change in the phase space volume
 $V_p$
of the particles bounded by the closed streamline
 $S$
(Sapsis & Haller Reference Sapsis and Haller2010). According to Gauss’s divergence theorem,
 $I(S)=\int _{\textit{int}(S)} \boldsymbol{\nabla }\boldsymbol{\cdot }\boldsymbol{v}'\mathrm{d}V$
quantifies the total divergence flux of the particle velocity across the closed streamline
 $S$
, where
 ${int}(S)$
denotes the integral region enclosed by the streamline
 $S$
. When
 $I(S)\gt 0$
, it signifies a net inward transport of particles into the region, corresponding to local accumulation. Conversely,
 $I(S)\lt 0$
indicates net outward particle flux from the enclosed domain, resulting in progressive depletion of particle density within the region. By using Liouville’s theorem (see e.g. Sinai Reference Sinai1976) and the particle velocity (2.5),
 $I(S)$
can be expressed as
 \begin{equation} \begin{aligned} I(S)&=\frac {\mathrm{d}( V_p(S))}{\mathrm{d} \tau }=\int _{\textit{int}(S)} \boldsymbol{\nabla }\boldsymbol{\cdot }\boldsymbol{v}'\, \mathrm{d} V \\ &=\int _{\textit{int}(S)} \boldsymbol{\nabla }\boldsymbol{\cdot }\left (\boldsymbol{u}\big (\boldsymbol{X}'_{p}\big )+S t^{}\left (1-\frac {1}{3} R\right )\big (\boldsymbol{X}'_p-2 \boldsymbol{e}_{z} \times \boldsymbol{u}\big (\boldsymbol{X}'_{{p}}\big )\big )-S t\,(1-R) \frac {\mathrm{D} \boldsymbol{u}\big (\boldsymbol{X}'_{{p}}\big )}{\mathrm{D} \tau }\right ) \mathrm{d} V \\ &=S t^{}\int _{S}\left (\left (1-\frac {1}{3} R\right )\big (\boldsymbol{X}'_{{p}}-2 \boldsymbol{e}_{z} \times \boldsymbol{u}\big (\boldsymbol{X}'_{{p}}\big )\big )-(1-R) \frac {\mathrm{D} \boldsymbol{u}\big (\boldsymbol{X}'_{{p}}\big )}{\mathrm{D} \tau }\right ) \boldsymbol{\cdot }\boldsymbol{n}\, \mathrm{d} S , \end{aligned} \end{equation}
where
 $\boldsymbol{n}$
denotes the outward normal of the closed streamline
 $S$
.
Our previous investigation into the motion of particle trapping within CVP flows focused specifically on the case
 $R=0.47$
, corresponding to quartz–water systems (see Zhao et al. Reference Zhao, Guo, Zuo and Qian2024). Within the core domain of V2, we identify a closed critical streamline
 $S_0$
, or the particle-attracting ring, characterised by
 $I(S_0)=0$
,
 $I(S_0^+)\gt 0$
and
 $I(S_0^-)\lt 0$
, where
 $S_0^+$
and
 $S_0^-$
denote streamlines outside and inside the boundary
 $S_0$
, respectively. Figure 2 marks
 $S_0$
in different cases. Note that
 $S_0$
curves are located in the vicinity of the region with negative
 $Q_{\textit{rot}}$
values. The emergence of
 $S_0$
demonstrates that heavy particles exhibiting weak inertial effects undergo stable trapping within this flow regime, ultimately forming an annular concentration structure. The schematic diagram in figure 3 illustrates the dynamics of the emergence of
 $S_0$
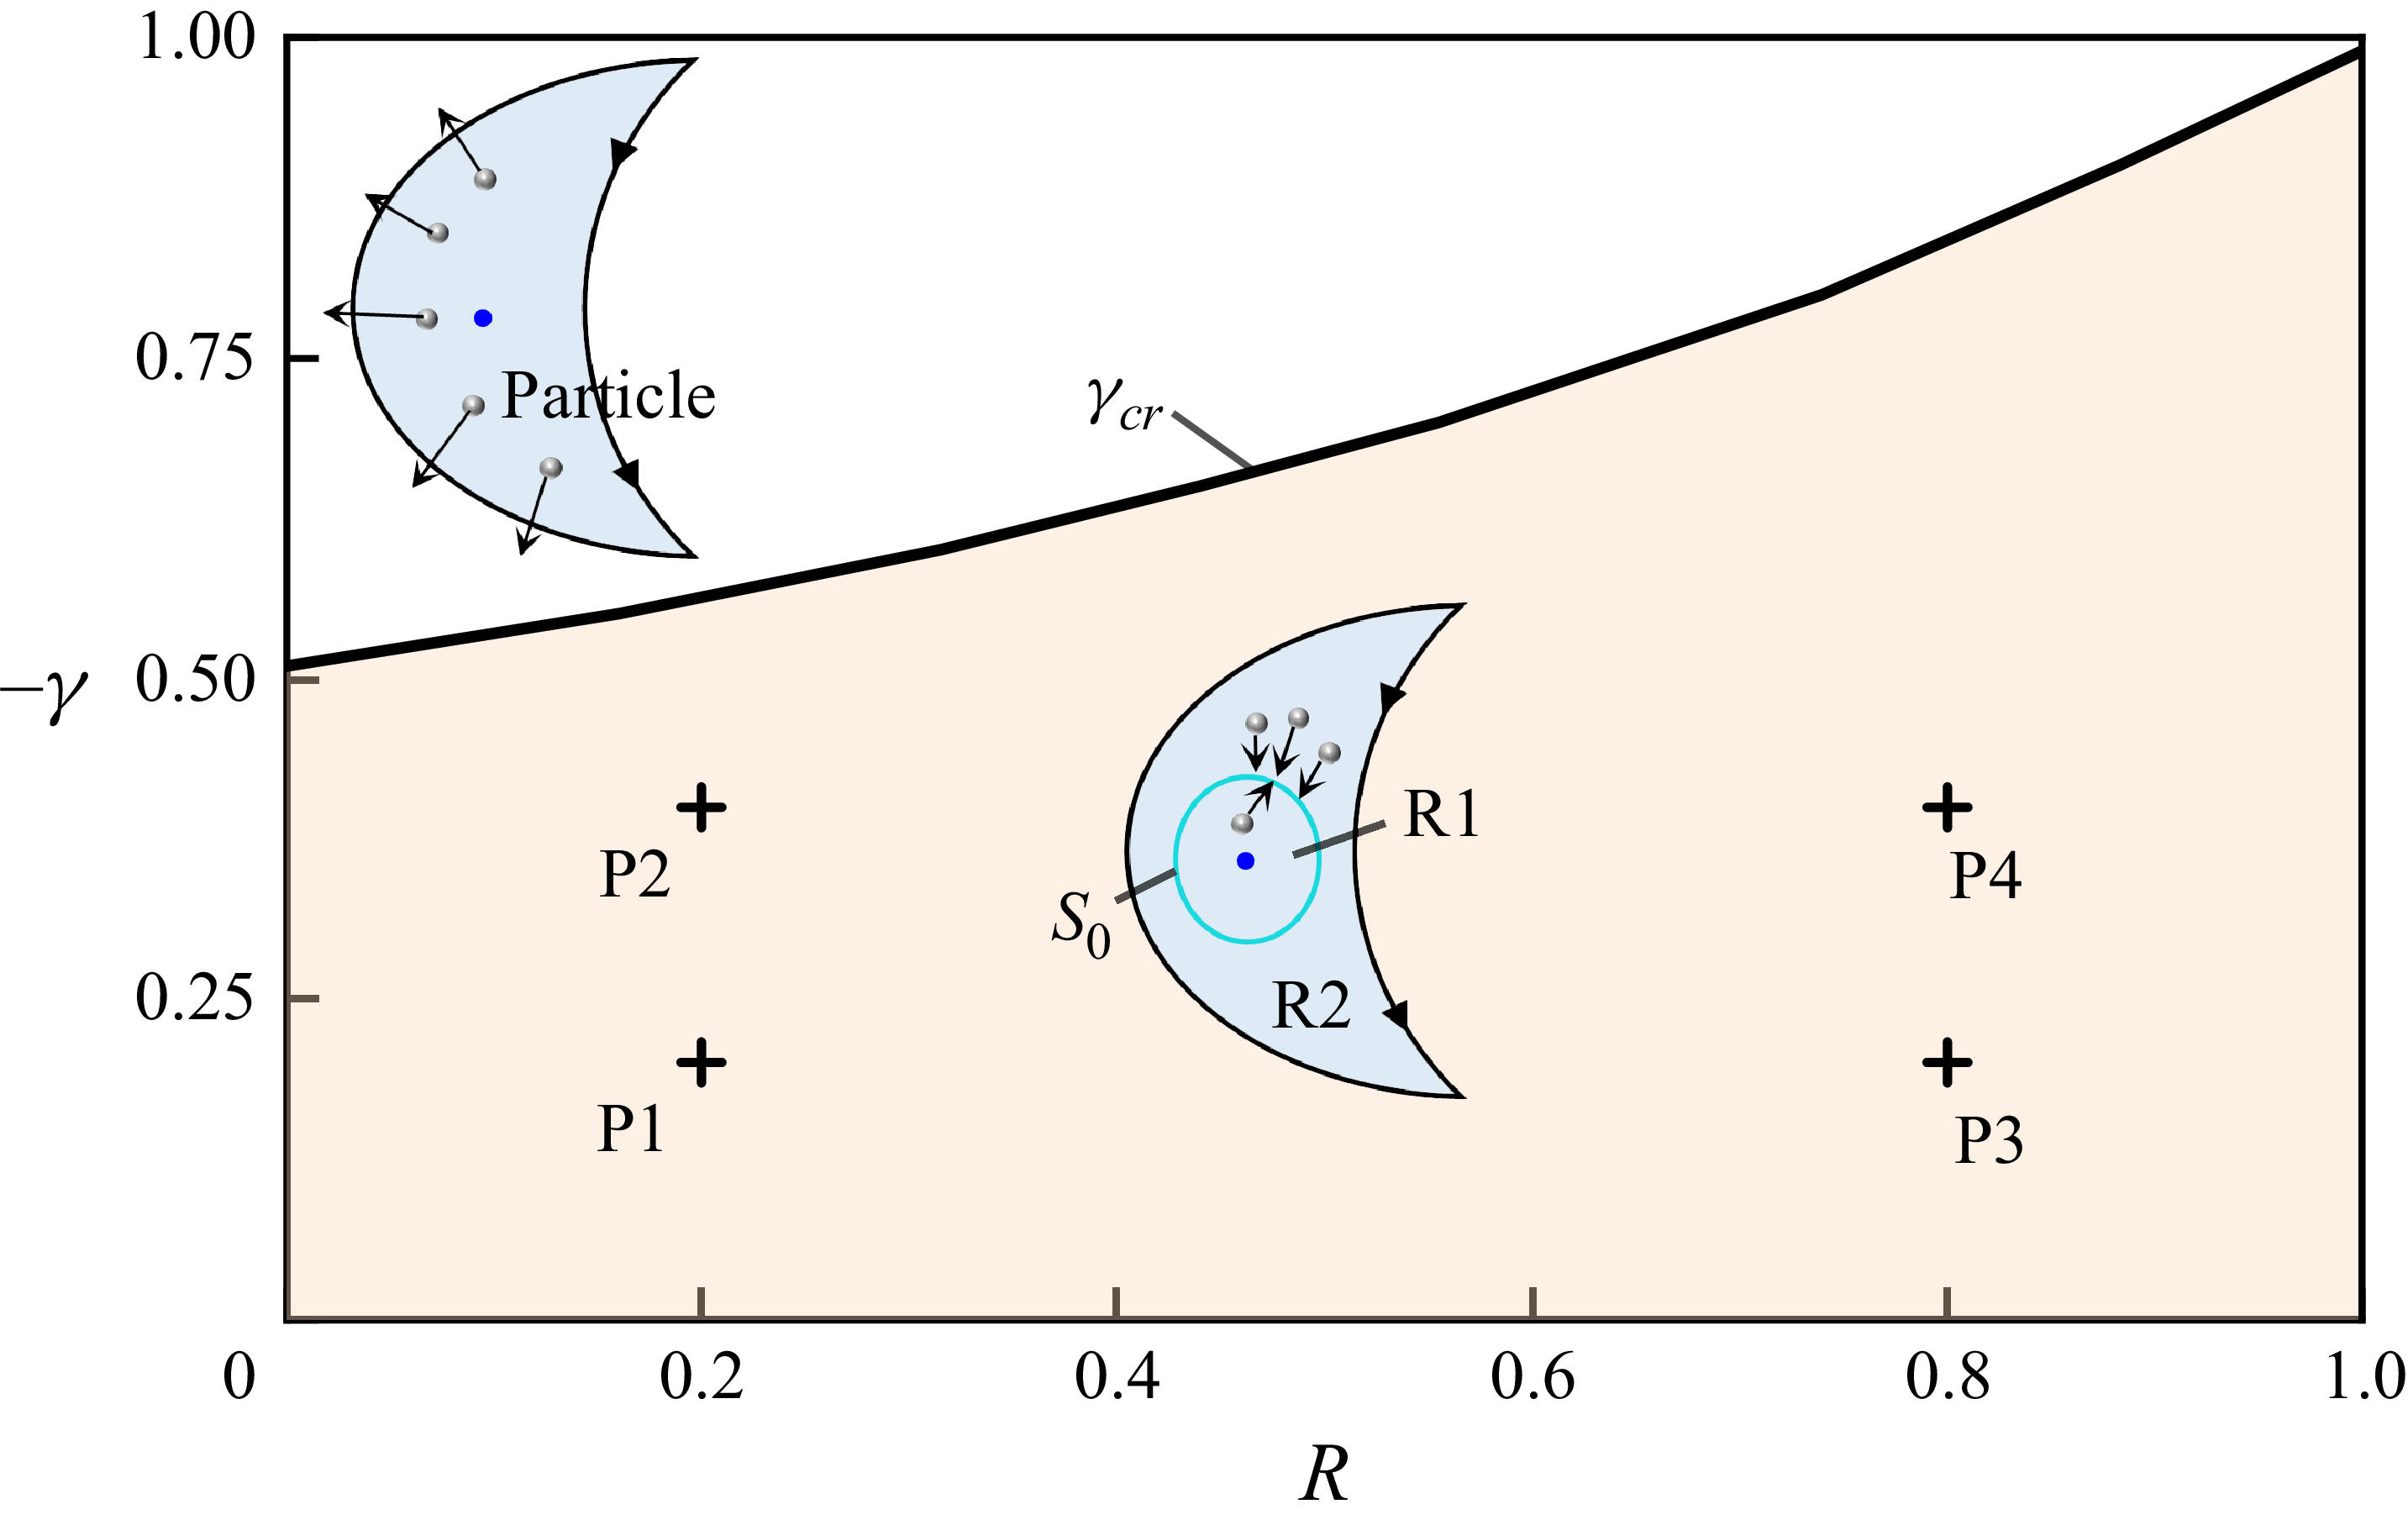
. The V2 core region is partitioned into two distinct domains, R1 and R2, characterised by opposing particle dynamics. In region R1, where
 $I(S)\lt 0$
, the particles exhibit outward trajectories towards
 $S_0$
. Conversely, region R2 demonstrates inward particle migration towards
 $S_0$
under the condition
 $I(S)\gt 0$
. This bimodal dynamical configuration results in particle confinement near the
 $S_0$
attractor.
As demonstrated in (3.6), the density factor
 $R$
exerts a significant influence on
 $I(S)$
. Through systematic analysis of CVP flow dynamics, our computational results reveal distinct particle transport mechanisms in vortex core regions. In the V1 core, the values of
 $I(S)$
derived via (3.6) maintain persistent negativity across varying
 $\gamma$
and
 $R$
values, suggesting continuous particle expulsion that prevents cluster formation. Conversely, the V2 core demonstrates
 $R$
-dependent
 $S_0$
appearances. Figure 3 delineates the phase diagram of critical circulation ratios, where the solid curve quantifies
 $\gamma _{{cr}}$
required to initiate
 $S_0$
across varying
 $R$
. It can be seen that the value of
 $\gamma _{{cr}}$
decreases with increasing
 $R$
. When
 $R\rightarrow 1$
,
 $S_0$
occurs in almost all CVP flows with unequal vortical strength (
 $-1\lt \gamma \lt 0$
). As
 $|\gamma |$
decreases or
 $R$
increases, the region with negative values of
 $Q_{\textit{rot}}$
shrinks, and the
 $S_0$
curve moves closer to the centre of the V1 core correspondingly (see figure 2).
Existence distribution of the particle-attracting ring
 $S_0$
in the V2 core region across various
 $\gamma$
and
 $R$
values, with
 $St \rightarrow 0$
. The yellow region indicates the occurrence of
 $S_0$
. The solid curve denotes the critical circulation ratio
 $\gamma _{{cr}}$
governing the emergence of
 $S_0$
as a function of
 $R$
. The inset schematic diagrams illustrate the particle motion in the V2 core region, with the vortex centre indicated by the blue point. In cases when
 $S_0$
exists, the V2 core region is partitioned into two distinct domains, R1 and R2. In region R1, where
 $I(S)\lt 0$
, the particles migrate outwards towards
 $S_0$
. In region R2, where
 $I(S)\gt 0$
, the particles migrate inwards towards
 $S_0$
. Labels P1–P4 in the diagram correspond to their respective cases illustrated in figure 2.

4. Trapping and leakage of moderately inertial particles
For particles with finite
 $St$
, the inertial particle velocity (3.4) becomes inadequate due to the non-negligible contribution of the omitted higher-order terms
 $O(St^2)$
(Zhao et al. Reference Zhao, Guo, Zuo and Qian2024). Increases in
 $St$
significantly affect the particle motion in the CVP flows. This section presents a systematic investigation of particle entrapment mechanisms in CVP flows with non-negligible particle inertial effects.
We perform numerical simulations to investigate the motion of moderately inertial particles in CVP flows spanning a range of Stokes numbers
 $St$
, circulation ratios
 $\gamma$
, and density factors
 $R$
. In the numerical simulations, the carrier-phase velocity field is prescribed by the exact CVP solution
 $\boldsymbol{u}(\boldsymbol{X},\gamma )$
. The particle motion (2.5) – formulated as a system of nonlinear ordinary differential equations in the rotating reference frame – is numerically solved using a fourth-order Runge–Kutta algorithm with fixed time step
 ${\varDelta }\tau =10^{-3}$
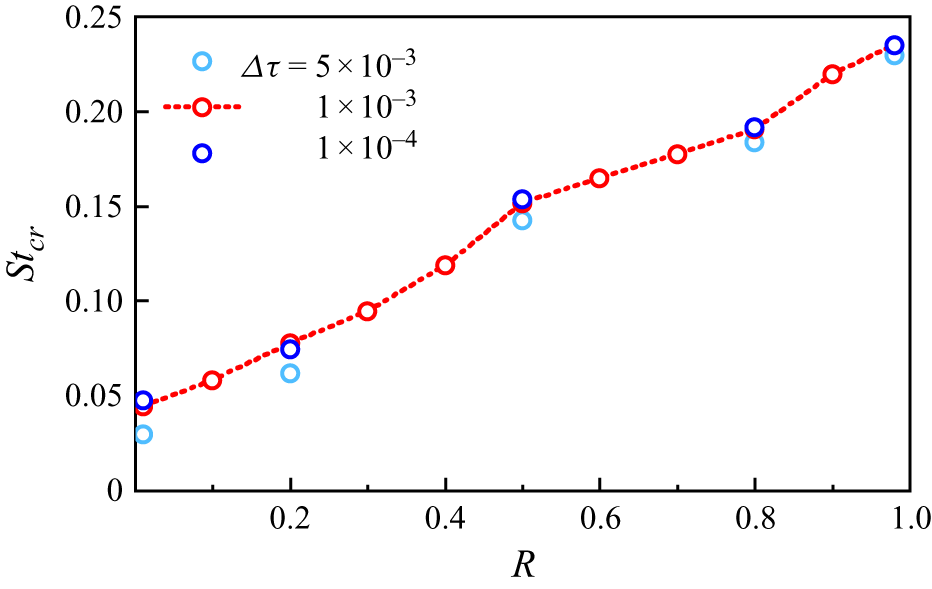
. The independence of the time step has been validated. A specific example of time step dependence analysis for particles with different
 $R$
is presented in Appendix A. Initial conditions are established by uniformly distributing
 $1\times 10^5$
particles across the spatial domain
 $x\in [-1.5,2.5]\times y\in [-2,2]$
, where the initial particle velocities are kinematically consistent with the local fluid velocity field.
Figure 4 presents comparative particle dynamics with different Stokes numbers
 $St=0.04$
and
 $0.08$
in the CVP flow field under
 $\gamma =-0.2$
and
 $R=0.2$
. Although both cases exhibit particle evacuations from the vortex core regions, distinct regimes of particle migration patterns are identified. In the low-
 $St$
regime (
 $St=0.04$
), some of the particles are getting trapped in the V2 core region (I), leading to the formation of a stable closed particle clustering ring (PCR); see figure 4(a). When
 $St$
increases to
 $0.08$
, only a transient PCR is formed, with subsequent structural disintegration over time, as presented in figure 4(
 $b$
).
Numerical simulation results showing spatiotemporal development of
 $10^5$
particles in CVP flows with
 $\gamma =-0.2$
and
 $R=0.2$
under different Stokes numbers: (
 $a$
)
 $St=0.04$
, a stable PCR forms in the V2 core region (I); (
 $b$
)
 $St=0.08$
, no stable PCR is formed. The particles are initially uniformly distributed across the square domain
 $x\in [-1.5,2.5]\times y\in [-2,2]$
. The blue curve
 $S_0$
denotes the particle-attracting ring for weakly inertial particles. Grey points represent particles.

Critical Stokes number
 $St_{{cr}}$
required for PCR formation in the V2 vortex core region. When
 $St\lt St_{{cr}}$
, a PCR occurs in the V2 core region. (a) The value of the critical Stokes number
 $St_{{cr}}$
at different particle density factors
 $R$
and circulation ratios
 $\gamma$
of the CVP flow. The red line denotes the critical circulation ratio
 $\gamma _{{cr}}$
versus
 $R$
. When
 $\gamma \gt \gamma _{{cr}}$
, the PCR cannot form even at
 $St \rightarrow 0$
. (b) Open circles represent numerical results of the critical Stokes number
 $St_{{cr}}$
versus different
 $R$
at a specific
 $\gamma$
, while the dashed line of best fit (
 $R^2\gt 0.98$
) demonstrates a linear relationship between
 $St_{{cr}}$
and
 $R$
.

The above analysis reveals that a critical Stokes number threshold exists for PCR formation at given combinations of
 $\gamma$
and
 $R$
. To determine this threshold, we conduct additional simulations spanning parameter ranges
 $R\in (0,1)$
,
 $\gamma \in (-1,0)$
and
 $St \in (0,0.3)$
, with fixed increments
 $\mathrm{\Delta } R=0.1$
,
 $\mathrm{\Delta } \gamma =0.1$
and
 $\mathrm{\mathrm{\Delta }} St=0.005$
, respectively. Figure 5 depicts the critical Stokes number
 $St_{{cr}}$
as a function of the density factor
 $R$
and circulation ratio
 $\gamma$
. A distinct PCR forms within the V2 core region when
 $St\lt St_{{cr}}$
. In figure 5(
 $a$
), the red line indicates the critical circulation ratio
 $\gamma _{{cr}}$
, which demarcates the parameter region for PCR emergence as established in § 3. When
 $\gamma \gt \gamma _{{cr}}$
, PCR formation is inhibited even in the limit as
 $St \rightarrow 0$
. At a fixed density factor
 $R$
, we observe that the critical Stokes number reaches a maximum value when the circulation ratio is
 $\gamma \approx -0.2$
. Notably, the circulation ratio of CVPs generated by vortex–wall interactions typically approximates
 $-0.2$
(Harris & Williamson Reference Harris and Williamson2012; Zhao et al. Reference Zhao, Guo, Zuo and Qian2024). Furthermore, for a fixed
 $\gamma$
, the dashed regression line (
 $R^2\gt 0.98$
) in figure 5(
 $b$
) reveals a proportional relationship between
 $St_{{cr}}$
and
 $R$
, whose slope increases with
 $|\gamma |$
. As
 $R\rightarrow 1$
,
 $St_{{cr}}$
approaches its maximum, indicating that particles with moderate density excess preferentially form PCRs in CVP flows.
Here, we propose a fitted equation for the critical Stokes number
 $St_{{cr}}$
governing PCR formation across varying circulation ratios
 $\gamma$
and density factors
 $R$
:
 \begin{equation} St_{{cr}}=\big(2.4\times 10^{-2}+0.55R\,|\gamma |^{0.445}\big)(1+\gamma )^{1.2}, \end{equation}
with
 $R^2=0.98$
and root mean square error
 $1.62\times 10^{-4}$
. The model is valid within the parameter ranges
 $\gamma \in (\gamma _{{cr},0})$
and
 $R \in (0,1)$
, where the critical circulation ratio is defined as
 $\gamma _{{cr}} = -0.3R^2 - 0.17R - 0.51$
. For a specified
 $R$
,
 $St_{{cr}}$
exhibits non-monotonic variation with
 $\gamma$
. This behaviour is accurately captured by a beta distribution function (Zhao et al. Reference Zhao, Guo, Zuo and Qian2024).
The subsections below provide a detailed analysis of inertial particle dynamics in CVP flows. Focusing on a fixed circulation ratio
 $\gamma = -0.2$
in the main text, we supplement this with a brief examination of
 $\gamma$
-dependent effects in Appendix B. Our findings reveal that while these systems exhibit qualitatively similar behaviour, significant quantitative discrepancies emerge across key metrics. Consequently, the presented numerical results primarily elucidate fundamental physical mechanisms governing particle motion in CVP flows, rather than constituting a predictive framework for specific engineering applications.
4.1. Trapping of particles under subcritical
 $St$
(
$St\lt St_{{cr}}$
)


As established in previous analyses, each density factor
 $R$
corresponds to a critical Stokes number
 $St_{{cr}}$
, below which some of the particles become entrained within the CVP flow, forming the PCR. This subsection presents a systematic investigation of PCR characteristics under subcritical Stokes conditions
 $St\lt St_{cr}$
, with a particular focus on the dynamics of the particle trajectory within the PCR structure and the topology of the attraction basin.
4.1.1. Dynamics of the particle in the PCR
Figure 6 presents a comparison of the formation of PCRs in the CVP flows under contrasting density factor conditions (
 $R=0.2$
versus
 $R=0.6$
). The predicted particle-attracting ring
 $S_0$
and V2 core region collectively establish a reference framework for the formation of the PCR. For both
 $R$
values, when
 $St$
is sufficiently small (e.g.
 $St=0.005$
), the PCR location becomes aligned with
 $S_0$
, demonstrating the attractive effects of the ring on particle dynamics. Increased Stokes numbers induce spatial decoupling between the PCR and
 $S_0$
, while the PCR persistently remains confined within the V2 core region. At
 $R=0.6$
, inertial effects dominate PCR positioning as evidenced in figure 6(
 $b$
). For larger Stokes numbers with
 $R=0.6$
, the PCR exhibits progressive inward contraction towards the centre of V2. At
 $St=0.16$
and
 $R=0.6$
, the predicted PCR contraction process undergoes destabilisation, leading to the emergence of a twisted PCR morphology.
The PCRs in the CVP flow for particles with different Stokes numbers
 $St\lt St_{{cr}}$
at (
 $a$
)
 $\gamma =-0.2$
and
 $R=0.2$
, and (
 $b$
)
 $\gamma =-0.2$
and
 $R=0.6$
. Blue curves
 $S_0$
denote the particle-attracting rings for the weakly inertial particles (
 $St \rightarrow 0$
). Grey points represent particles.

Kinematic behaviour of an individual particle in the PCR within the V2 core region (I) of the CVP flow with circulation ratio
 $\gamma =-0.2$
. The parameter
 $\zeta$
denotes the normalised time for a single cycle of particle motion. (
 $a$
) Closed trajectories of particles with various parameters
 $R$
and
 $St$
. From left to right, the parameters of the particles are
 $R=0.2,\ St=0.005$
,
 $R=0.6,\ St=0.005$
and
 $R=0.6,\ St=0.16$
, respectively. (
 $b$
) Variations of the particle velocity within a single cycle of periodic particle motion. (
 $c$
) Evolutions of the normal force components acting on the particles in a single cycle of periodic particle motion.

Essentially, the PCR can be conceptualised as a macroscopic aggregate manifestation of multiple particles orbiting V2. Figure 7 systematically demonstrates the kinematic behaviour of an individual particle with different
 $R$
and
 $St$
combinations trapped within the V2 core region, where the normalised time per cycle of particle motion is denoted by
 $\zeta$
. Since the particles are in the PCR, the initial position of the particles has little influence on their trajectory. The periodic orbiting trajectories of particles are shown in figure 7(
 $a$
), with numbers indicating different
 $\zeta$
. Figure 7(
 $b$
) illustrates the variations in particle velocity over single cycles of periodic motion. When
 $St=0.005$
,
 $R=0.2$
and
 $0.6$
, the particle follows a near-circular trajectory around the V2 centre, exhibiting periodic velocity modulation. Specifically, the velocity minima occur in the head and tail regions of the V2, and the velocity maxima emerge within the mid-region of the vortex structure. Under conditions
 $R=0.6$
and
 $St=0.16$
, the particle adopts a helical trajectory around the V2 structure, executing motion through two distinct yet interconnected orbital paths. The orbital velocity demonstrates spatial dependence. As the particle traverses the inner orbit proximal to the vortex core, it exhibits increased velocities, attributable to the elevated local flow velocity field near the vortex centre. Conversely, as the particle moves to the outer orbital path, it displays reduced velocities, particularly pronounced during its transit through the head and tail regions of the V2.
As governed by (2.5), the dynamics of the particles within the co-moving coordinate system of the CVP flows is primarily influenced by the drag force, the fluid stress force and the pseudo-forces (centrifugal and Coriolis forces). We should note that all these forces have included the added mass effect by introducing the effective density factor
 $R=3/(2\beta +1)$
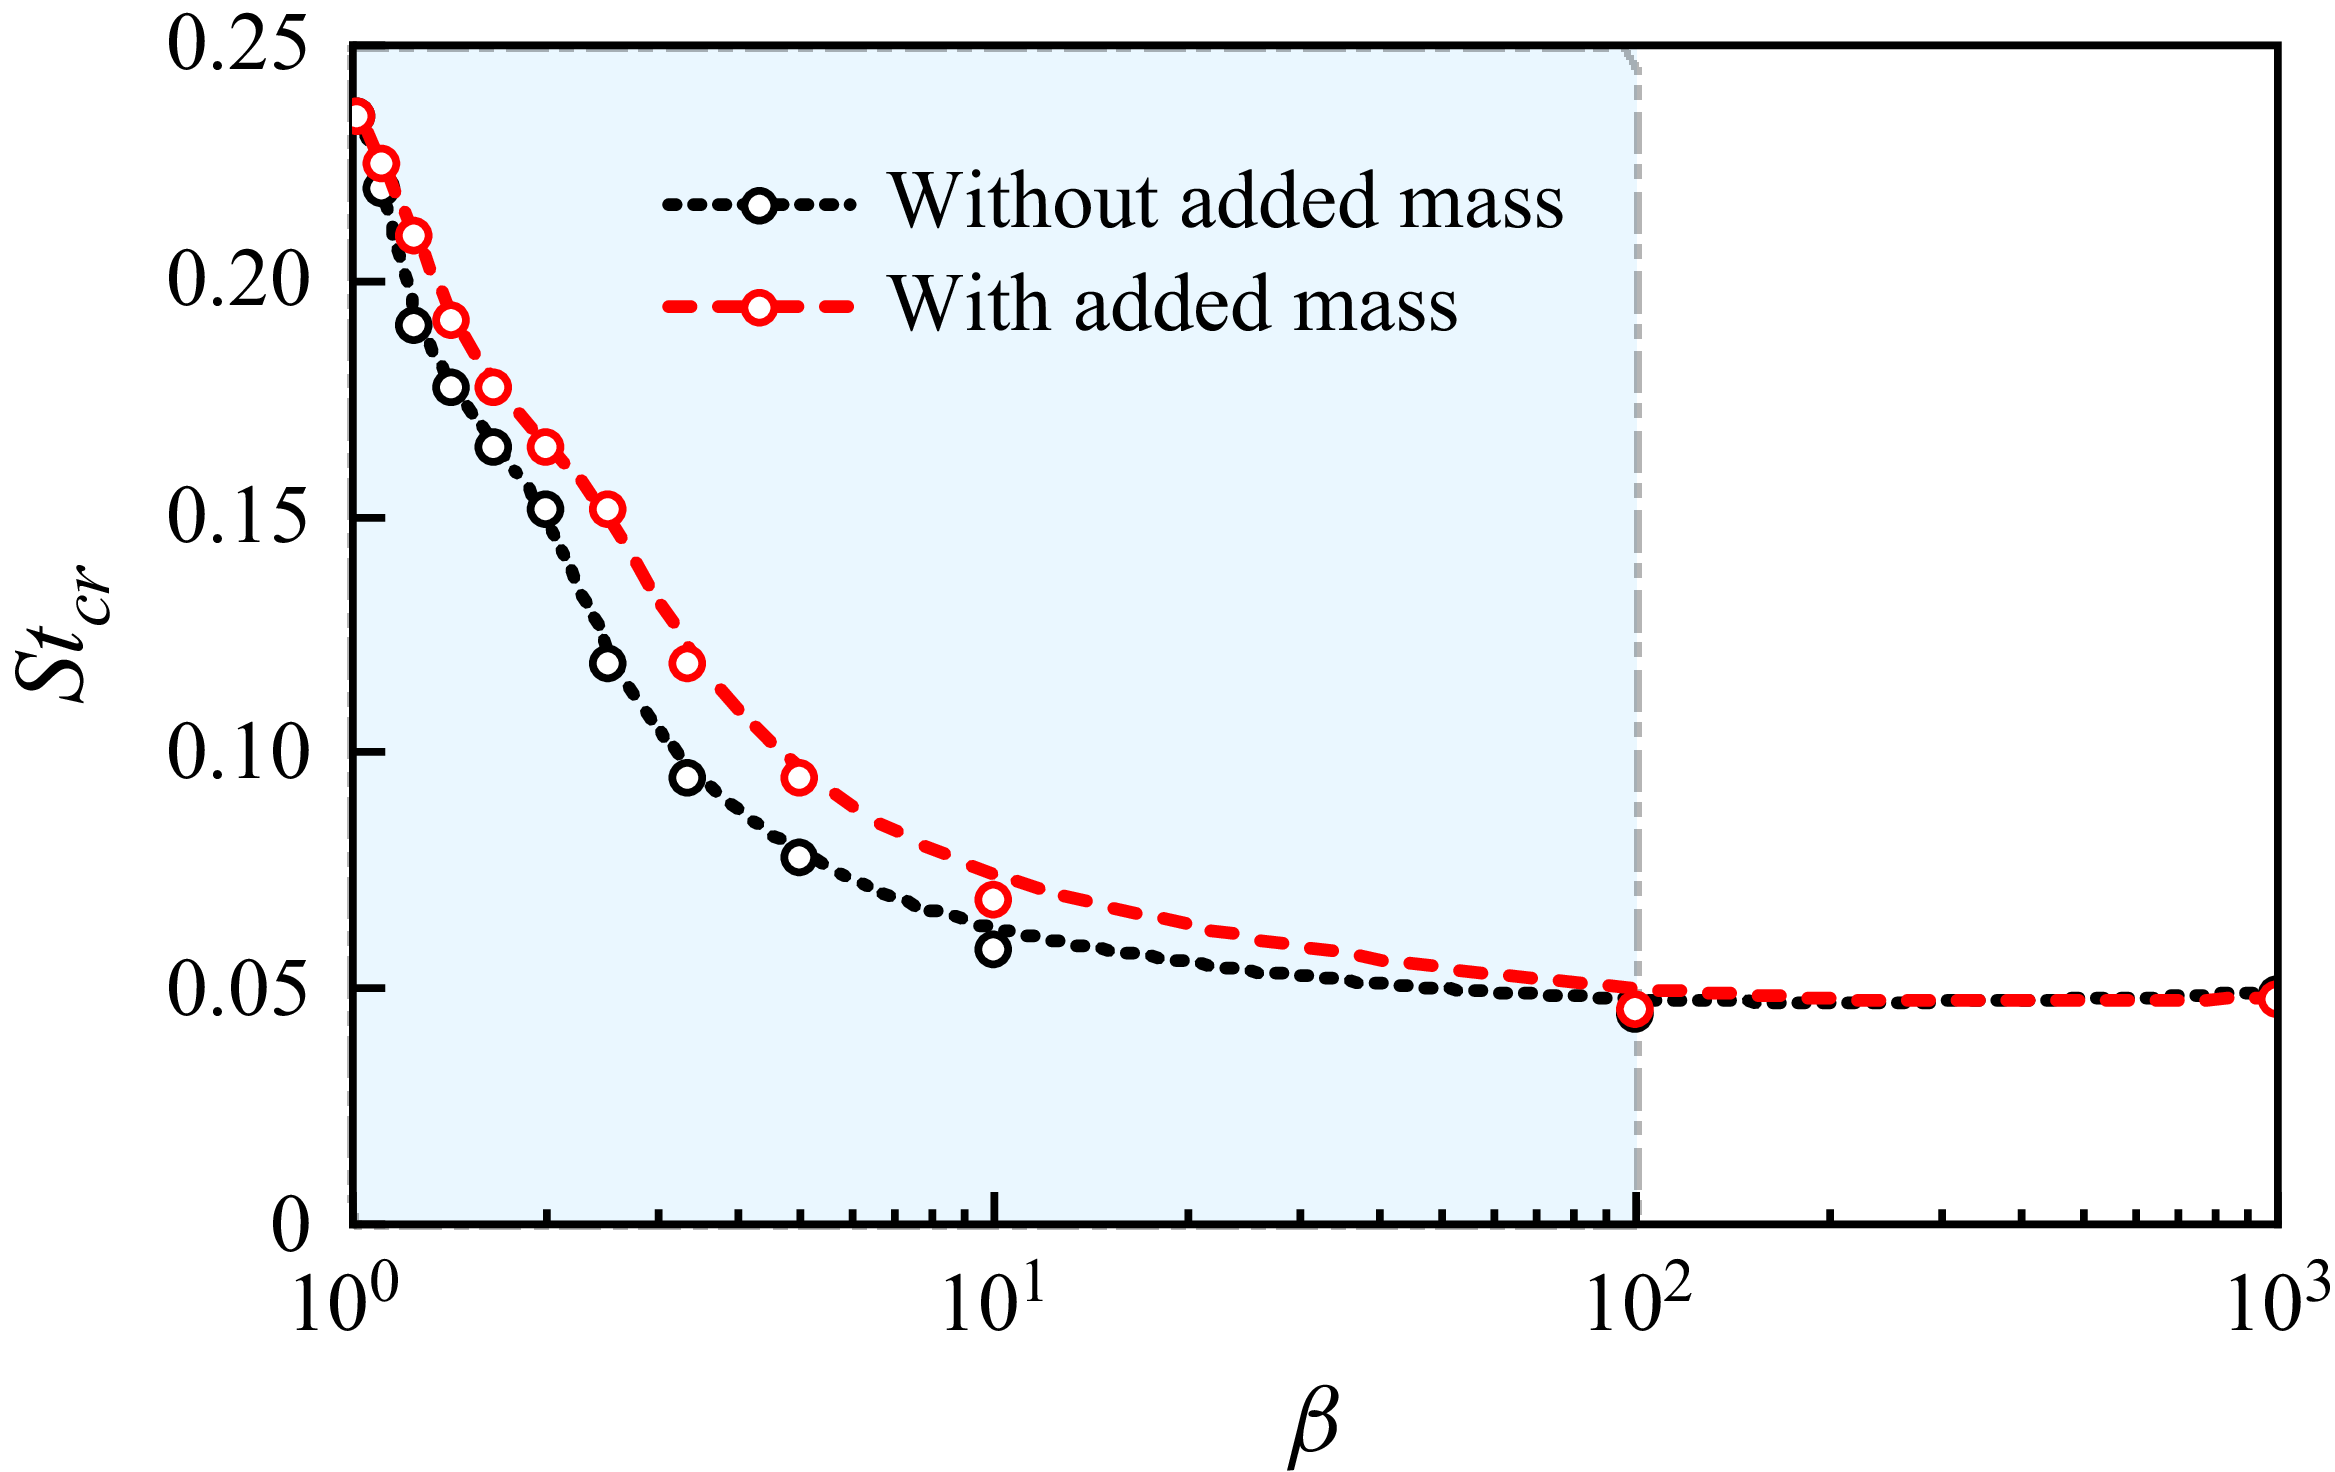
, and this added mass effect is evaluated in Appendix C. Our analysis reveals that as a particle orbits the vortex, the force balance established in the normal direction (perpendicular to the instantaneous velocity vector of the particle) plays a critical role in governing the trajectory of the particle relative to the vortex core. Figure 7(
 $c$
) illustrates the temporal evolution of normal force components acting on a particle over one orbital period of its trajectory around the vortex core. The terms
 $\textit{CF}_{\textit{N}}$
,
 $\textit{PF}_{\textit{N}}$
,
 $\textit{FSF}_{\textit{N}}$
and
 $\textit{DF}_{\textit{N}}$
denote the normal components of the composite force, pseudo-forces, fluid stress force and drag force, defined as
 \begin{equation} \textit{CF}_{\textit{N}} = \textit{DF}_{\textit{N}}+\textit{FSF}_{\textit{N}}+\textit{PF}_{\textit{N}}, \end{equation}
 \begin{align} \textit{PF}_{\textit{N}} = \frac {\boldsymbol{v}'\times \boldsymbol{e}_z}{\|\boldsymbol{v}'\|}\boldsymbol{\cdot }\left (\left(1-\frac {1}{3}R\right)(\boldsymbol{X}'_p-2\boldsymbol{e}_z\times \boldsymbol{v}')\right )\!, \\[-27pt] \nonumber \end{align}
 \begin{align} \textit{FSF}_{\textit{N}} = \frac {\boldsymbol{v}'\times \boldsymbol{e}_z}{\|\boldsymbol{v}'\|}\boldsymbol{\cdot }\left (R\frac {\mathrm{D} \boldsymbol{u}\big (\boldsymbol{X}'_{p}\big )}{\mathrm{D} \tau }\right )\!, \\[-27pt] \nonumber \end{align}
 \begin{align} \textit{DF}_{\textit{N}} = \frac {\boldsymbol{v}'\times \boldsymbol{e}_z}{\|\boldsymbol{v}'\|}\boldsymbol{\cdot }\left (\frac {\boldsymbol{u}\big (\boldsymbol{X}'_{p}\big )-\boldsymbol{v}'}{St}\right )\!. \\[6pt] \nonumber \end{align}
It is shown that
 $\textit{CF}_{\textit{N}}$
almost persists as a positive quantity throughout the orbital trajectory of the particle around the vortex core, except when
 $\zeta \in (0.75,1)$
in the case
 $R=0.6$
and
 $St=0.16$
. This sustained positive value of
 $\textit{CF}_{\textit{N}}$
dynamically sustains the cyclonic motion by providing the necessary centripetal acceleration that maintains the curved path of the particles along the vortex perimeter. The magnitude of
 $\textit{CF}_{\textit{N}}$
increases with particle velocity, since the particle velocity governs the centripetal force necessary for their orbital motion around the vortex, as shown in figure 7(
 $a$
).
Within the force system acting on the particles, the normal components of the pseudo-force
 $\textit{PF}_{\textit{N}}$
and the fluid stress force
 $\textit{FSF}_{\textit{N}}$
are responsible for generating the positive
 $\textit{CF}_{\textit{N}}$
, as depicted in figure 7(
 $c$
). When
 $R=0.2$
,
 $\textit{PF}_{\textit{N}}$
contributes substantially to the positive
 $\textit{CF}_{\textit{N}}$
. However, increasing
 $R$
leads to a progressive reduction in pseudo-forces acting on particles while amplifying fluid stress forces, as demonstrated in (2.5). For
 $R=0.6$
,
 $\textit{FSF}_{\textit{N}}$
emerges as the dominant contributor. This mechanistic shift provides critical insight into the PCR–
 $St$
relationship evolution shown in figure 6. The magnitude of the fluid stress force exhibits a direct dependence on the intensity of the fluid acceleration, which peaks near the vortex centres. This spatial variation explains the corresponding enhancement of fluid stress forces on particles approaching vortex cores. With increasing
 $St$
, two competing effects emerge. The required centripetal force for vortex circumnavigation escalates, forcing particle orbits to contract towards the vortex centre. Meanwhile, particle velocities surge significantly during vortex approach. For
 $St=0.16$
, this velocity enhancement near the vortex core triggers particle ejection into distal orbits. Conversely, in peripheral orbits, velocity attenuation occurs (figure 7
 $b$
), ultimately initiating recirculation back to proximal orbits. This bistable orbital regime demonstrates the delicate balance between centripetal force requirements and velocity-modulated position feedback.
4.1.2. The basin of attraction for the PCR
The numerical simulation results in figure 6 reveal that only a subset of particles become trapped in the PCR configuration, while others exhibit unbounded spiral trajectories towards infinity. Figure 8 characterises the initial condition space through basin of attraction (BOA) analysis, with the dark blue regions corresponding to initial positions that ultimately converge to the PCR state under the CVP flow dynamics. To generate figure 8, we distribute
 $2\times 10^5$
particles across the flow field encompassing three key regions, i.e. the V2 core region (I), V1 core region (II), and recirculation zone (III). The far-field region (see figure 1) is excluded from consideration as particles in this area inevitably spiral towards infinity. Through numerical tracking of individual particle trajectories, we identify those exhibiting long-term confinement within the CVP flow, and map the initial positions of particles that ultimately become trapped in the flow field.
Figure 8 demonstrates that the PCRs are fully contained within their respective BOAs, as is visually evident from the spatial confinement. The well-defined geometric regularity of basin boundaries demonstrates the predictable dynamic behaviour of inertial particles within the CVP flow system. Notably, these attraction basins specifically occupy the V1 and V2 core regions, with their spatial domains precisely demarcated by flow separatrices (indicated by bold black streamlines in figure 8). This observation suggests that particle entrapment and subsequent PCR formation are exclusively governed by the V1 and V2 core regions. The BOAs of the PCR in these regions seamlessly merge at the V2 tail section. Notably, centrifugal forces induce gradual particle migration from the V1 core region towards the V2 vortex periphery, enabling cross-region transitions through the V2 tail interface. These displaced particles ultimately become PCR constituents through sustained entrapment mechanisms. The centrifugal effect generates intricate interlacing patterns between the PCR’s attraction basin (coloured domain) and the infinity basin (uncoloured domain), particularly pronounced under low
 $St$
conditions. This configuration creates sensitive dependence on initial conditions for particles originating near the V1 vortex core. Minute positional variations in launch parameters may lead to divergent outcomes, i.e. either permanent PCR capture or indefinite spiral trajectories towards infinity.
The BOA for inertial particles of (
 $a$
)
 $R=0.2$
and (
 $b$
)
 $R=0.6$
in the CVP flow with
 $\gamma =-0.2$
. The dark blue region represents the BOA of the PCR, where particles are eventually trapped to form the PCR in the CVP flow. The region outside these coloured regions indicates the BOA of infinity: i.e. particles initialised in these regions eventually spiral away to infinity. Domains I–III correspond to the V2 core, the V1 core, and the recirculation zone, respectively. These zones are separated by the streamlines (bold black).

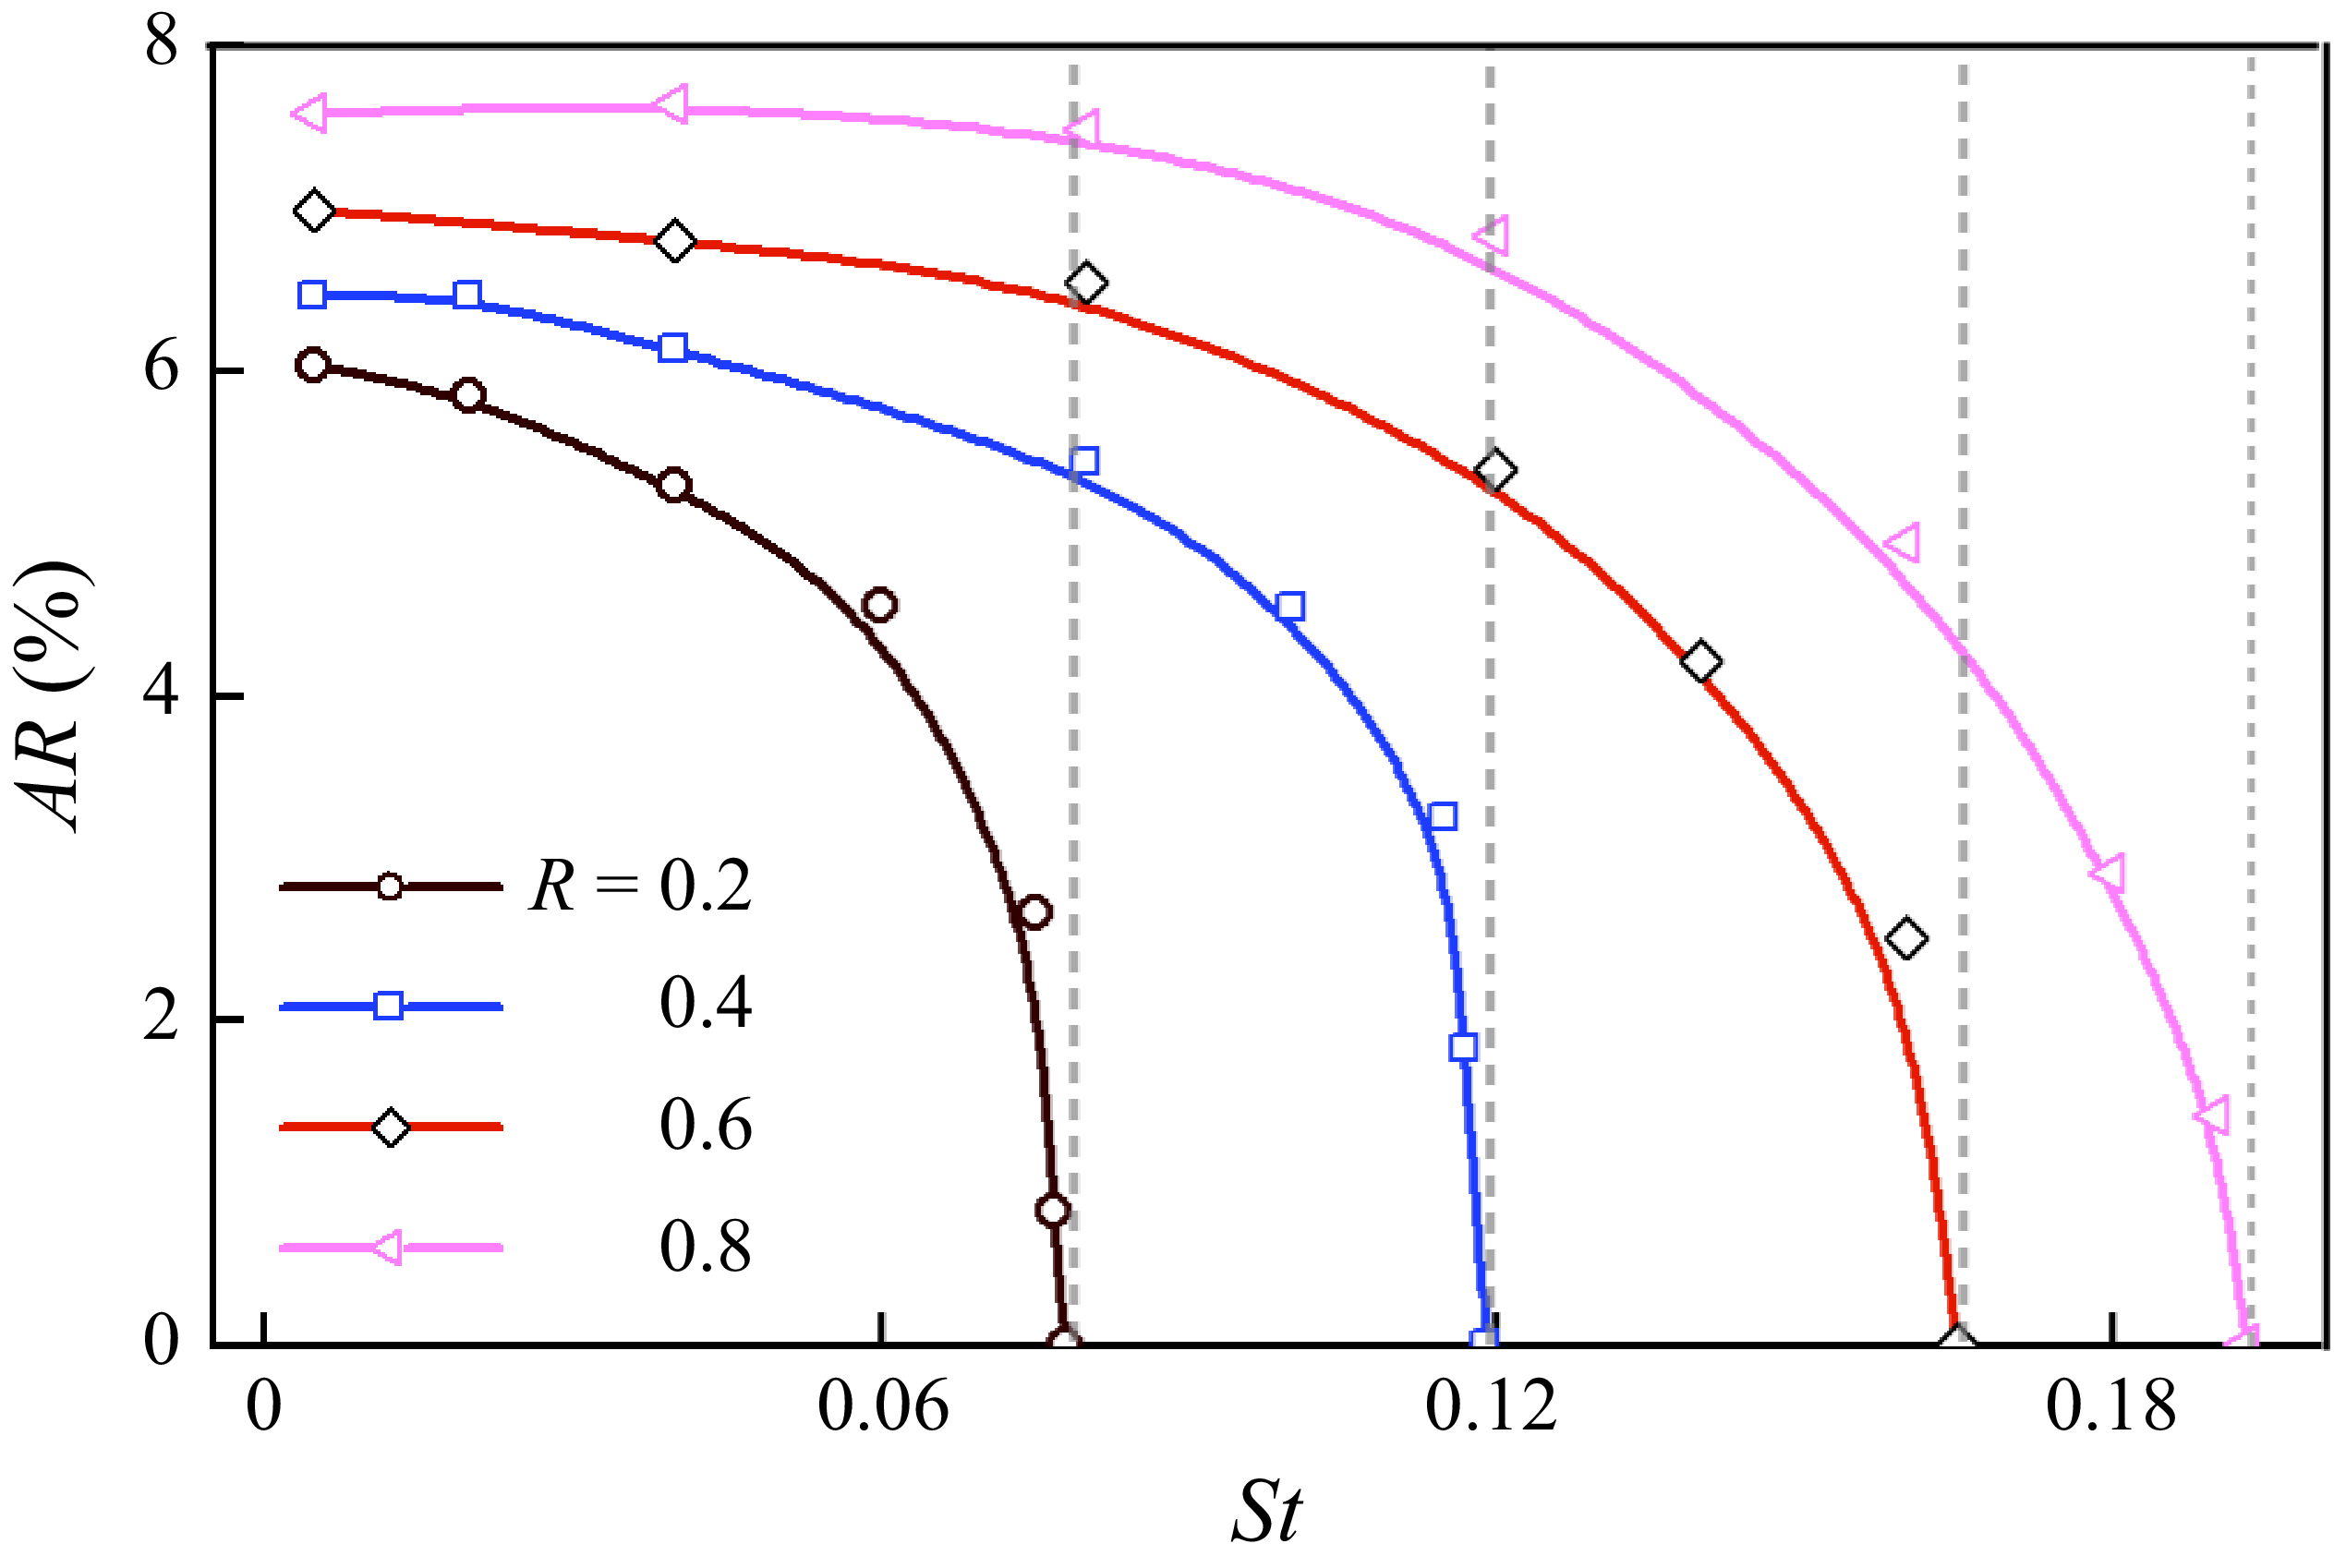
The attracting rate
 $AR$
of particles that are trapped to form the PCR with various density factors
 $R$
and Stokes numbers
 $St$
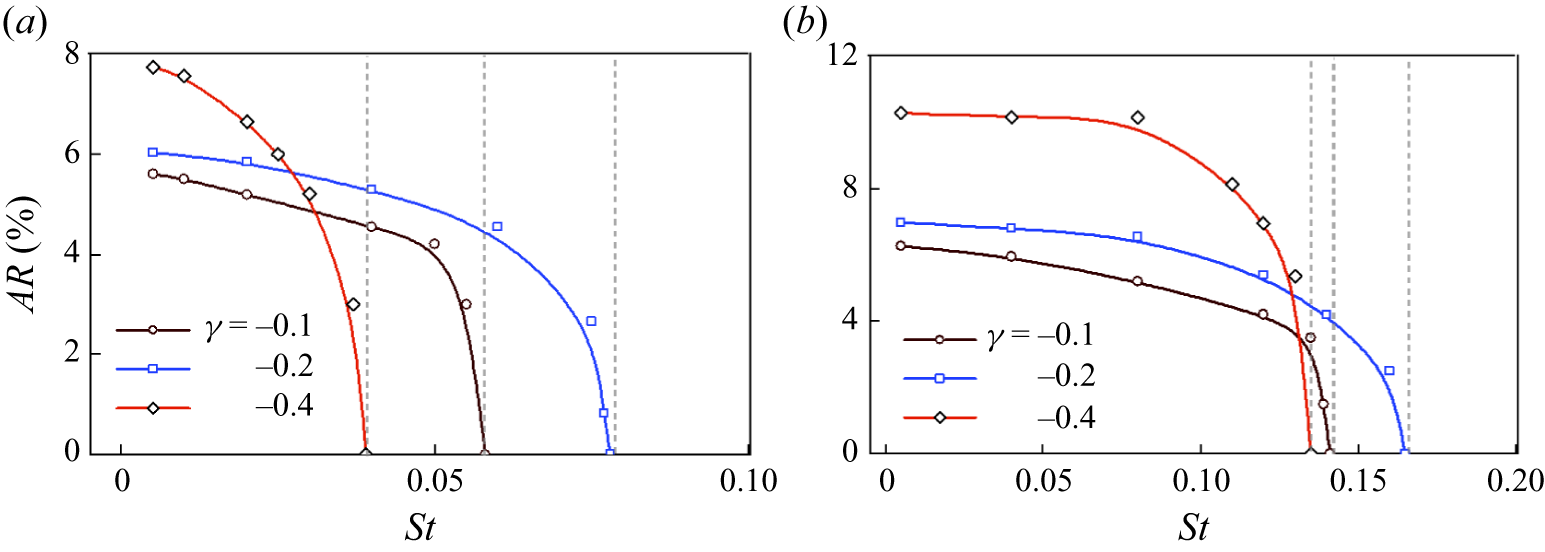
. The particles are uniformly distributed over the V2, V1 and recirculation regions. Because we started with uniformly distributed particles, this attracting rate is proportional to the area of the BOA. The dashed grey lines indicate
 $St=St_{{cr}}$
for the occurrence of the PCR. When
 $St\gt St_{{cr}}$
, no particles will be trapped to form the PCR, indicating a zero value for the attracting rate.

As demonstrated in figure 8, the density factor
 $R$
exhibits negligible influence on the spatial distribution of the attraction basin of the PCR, though discernible basin contraction occurs with increasing
 $St$
. In the V2 core region, near-complete particle entrapment and PCR formation emerge under minimal inertia conditions (
 $St=0.005$
). Notably, this trapping capacity degrades progressively with elevated
 $St$
values, ultimately expelling particles from the V2 head region towards infinity. The V1 core region reveals distinctive spiral-structured attraction basins, a morphological feature attributable to centrifugal-modulated radial velocity dynamics of inertial particles orbiting the V1 vortex. This radial velocity demonstrates direct proportionality to
 $St$
. At low inertia regimes (
 $St=0.005$
), diminished radial velocities produce tightly coiled spiral patterns. This winding configuration undergoes substantial relaxation as particle inertia increases, manifested through both expanded spiral pitch and reduced winding density – a direct consequence of enhanced radial transport efficiency at higher
 $St$
values.
Our numerical analysis also reveals complete basin dissolution beyond the critical Stokes threshold
 $St_{{cr}}$
, marking the extinction threshold of the PCR. To quantitatively characterise this mechanism, we systematically evaluate the particle attracting rate
 $\textit{AR}$
within the CVP flow field, as shown in figure 9. The particle attracting rate
 $\textit{AR}$
directly governs PCR formation and is given as
 \begin{equation} \textit{AR}=\frac {N_{\textit{PCR}}}{N_0}\times 100\,\%, \end{equation}
where
 $N_{\textit{PCR}}$
is the number of particles trapped in the CVP to form the PCR, and
 $N_0$
is the total number of particles. Initially,
 $2\times 10^5$
particles are uniformly distributed across the V2 core region (I), V1 core region (II) and recirculation zone (III) in the CVP flow.
Given that the particles are initially uniformly distributed throughout the flow field, their attracting rate to the PCR exhibits direct proportionality to the area of its BOA. The spiral divergence tendency of particles demonstrates a monotonic enhancement with increasing
 $ St$
(indicating stronger particle inertia) under a fixed
 $R$
. The attracting rate of the PCR decays to zero when approaching the critical Stokes number
 $St_{{cr}}$
(denoted by dashed grey lines in figure 9). Beyond
 $St_{{cr}}$
, the system transitions to a leaky regime where no particle is trapped, resulting in the complete suppression of PCR formation and a corresponding attracting rate of zero. The decrease in the attracting rate accelerates progressively with increasing
 $ St$
. Proximal to
 $St_{{cr}}$
, the attracting rate curve demonstrates a steep decline. For particles with different
 $R$
, the attracting rate of the particle declines as
 $R$
decreases (indicating heavier particles). Moreover, lighter particles (characterised by smaller
 $R$
values) exhibit a gradual decline in the attracting rate as
 $St$
increases. These findings demonstrate that the attracting rate of light particles exhibits reduced sensitivity to
 $St$
variation, resulting in a higher critical
 $St$
threshold required for the formation of the PCR.
In this study, we omit the effect of the Basset force for simplicity. Actually, although the Basset force appears at a higher order
 $O(St)$
– in other words, the value of the Basset force is smaller than the other forces (Lasheras & Tio Reference Lasheras and Tio1994) – the Basset force also has a noticeable effect on finitely dense particle clustering, especially when the density ratio is
 $\beta \sim O(1)$
(Kapoor et al. Reference Kapoor, Jaganathan and Govindarajan2024). The specific effect of the Basset force varies with the different surrounding flow patterns (Daitche & Tél Reference Daitche and Tél2011; Chong et al. Reference Chong, Kelly, Smith and Eldredge2013; Daitche Reference Daitche2015; Kapoor et al. Reference Kapoor, Jaganathan and Govindarajan2024). In the flow past a solid cylinder and the convective cell flow, the inclusion of the Basset force reduces caustics as well as destroying attractors (Chong et al. Reference Chong, Kelly, Smith and Eldredge2013; Daitche Reference Daitche2015), while the Basset force can contribute to the particle trapping in the counter-rotating vortex. Considering the similarity of the flow pattern and the particle parameters, we chose the results obtained by Kapoor et al. (Reference Kapoor, Jaganathan and Govindarajan2024) as a reference to initially evaluate the possible effect of the Basset force on the particle trapping in the CVP. As indicated by Kapoor et al. (Reference Kapoor, Jaganathan and Govindarajan2024), a featuring behaviour of inertial particles with the Basset force at an effective density factor
 $R$
is in broad qualitative agreement with the behaviour without the Basset force. In this study, we have concluded that particles with a larger
 $R$
excess preferentially form PCRs in CVP flows, where the critical Stokes number
 $St_{{cr}}$
and the area of the BOA are larger correspondingly. Based on these, we can speculate that the Basset force can increase the BOA, and also widen the range of
 $St$
for which trapping can be realised. We should note that the aforementioned effect of the Basset force is merely an inference based on conclusions from similar studies; the specific quantitative effect requires further research.
4.2. Leakage of particles with finite
$St\gt St_{{cr}}$

As established above, each
 $R$
is uniquely associated with an
 $St_{{cr}}$
value. When
 $St\gt St_{{cr}}$
, the PCR undergoes temporal disintegration, subsequently leading to complete evacuation of particles from the CVP flow. Next, we explore the behaviour of the system in this regime.
Figures 10(
 $a$
) and 10(
 $b$
) demonstrate two groups of particle trajectories under identical initial conditions. For the representative case
 $R=0.2$
and
 $St_{{cr}}=0.07893$
, one group corresponds to
 $St$
slightly below
 $St_{{cr}}$
, while the other exceeds it. As illustrated in figure 10(
 $a$
), particles with
 $St \lt St_{{cr}}$
become permanently trapped within the V2 core region (I). Their trajectories asymptotically converge towards a stable limit cycle, which functions as a topological attractor for finite-
 $St$
particles. This dynamical behaviour bears similarity to the particle-attracting ring discussed in § 3. When
 $St = St_{{cr}}$
, the limit cycle in the phase space coincides precisely with the saddle point (indicated by the green marker in figure 10). This configuration triggers a crisis phenomenon (Grebogi et al. Reference Grebogi, Ott and Yorke1983), characterised by the disappearance of the limit cycle and the subsequent emergence of a chaotic saddle. The dynamical behaviour of particles near this chaotic saddle demonstrates distinct leaky characteristics. As shown in figure 10(
 $b$
), particles with
 $St\gt St_{{cr}}$
exhibit finite-time escape dynamics from the limit cycle through the chaotic saddle structure. Figure 10(
 $c$
) shows the chaotic saddle structure under different values of
 $R$
, revealing that the saddle point progressively migrates towards the centre of the V2 vortex with increasing
 $R$
.
Leakage of particles past the trapping criteria. The trajectories of a set of particles in the narrow range
 $St \in (0.07891,0.07895)$
about
 $St_{{cr}}=0.07893$
for the representative case of
 $R=0.2$
, with identical initial conditions, are shown in
 $(a)$
and
 $(b)$
. Trajectories of the particle with
 $St\lt St_{{cr}}$
are coloured red, where particles are seen to remain trapped in the V2 core region (I), whereas those for
 $St\gt St_{{cr}}$
are coloured blue, where particles escape. The green dot is the saddle fixed point at
 $St_{{cr}}$
for the representative case
 $R=0.2$
in
 $(a)$
and
 $(b)$
. The location of the saddle fixed point does not vary visibly for the narrow range of
 $St$
shown. (
 $c$
) Variation of the saddle fixed point at
 $St_{{cr}}$
in the V2 core region with increasing
 $R$
.

Residence times
 $T_p$
of inertial particles for (
 $a$
)
 $R=0.2$
with
 $St_{{cr}}=0.07893$
, and (
 $b$
)
 $R=0.6$
with
 $St_{{cr}}=0.1675$
in the CVP flow. The colour at a given position indicates the residence time of a particle starting at that location. When
 $St\lt St_{{cr}}$
, some of the particles will be permanently trapped in the V2 core region; hence their residence is equal to the simulation time
 $\tau _{{max}}$
, i.e.
 $St=0.06$
in (
 $a$
), and
 $St=0.16$
in (
 $b$
).

As shown in figure 10(
 $b$
), when the particle Stokes number is
 $St\gt St_{{cr}}$
, particles become temporarily trapped in the V2 core region. During this finite-duration confinement, the particles exhibit periodic motion around the V2 centre while asymptotically approaching the corresponding chaotic saddle point. We systematically investigate the temporal dynamics of these trapped particles, particularly focusing on the duration of their retention within the V2 core region. Particle trajectories originating from specified initial positions undergo continuous monitoring until their departure from the V2 core region. The temporal duration between initiation and boundary egress is systematically recorded as the characteristic residence time
 $T_p$
. Figure 11 illustrates
 $T_p$
of particles with
 $R = 0.2$
and
 $R = 0.6$
across all initial locations, evaluated for three different Stokes numbers. The colour at each spatial coordinate corresponds to the residence duration of particles originating from that specific location. For the parameter combinations
 $St=0.06,\ R=0.2$
and
 $St=0.16,\ R=0.6$
(as illustrated in figure 11), where
 $St \lt St_{{cr}}$
for their respective
 $R$
values, we observe a distinct particle cluster whose residence time matches the full simulation duration
 $\tau _{{max}}$
. This persistent cluster aligns with the BOA associated with permanently trapped particles, as demonstrated in figure 8.
Beyond the critical Stokes number, although the BOA has zero area – implying that all particles eventually escape the V2 core region – particles can remain trapped in this region for durations exceeding tens of CVP rotation periods. As shown in figure 11(
 $a$
) for
 $R=0.2$
and
 $St=0.08,0.09$
, the residence time distribution is relatively uniform. Particles initially positioned near the V2 centre exhibit extended residence times, whereas increased Stokes numbers result in significant reductions of these durations. Conversely, at
 $R=0.6$
(figure 11
 $b$
), residence times lengthen even at larger Stokes numbers, while their spatial distribution becomes irregular. Residence times exhibit significant variation even among particles from adjacent origins. Sharp ridges visible in the figure correspond to prolonged particle residence, while intervening valleys show comparatively shorter durations. These ridge–valley structures form spiral pathways connecting V1 and V2 core regions. Similarly, residence times decline markedly with rising Stokes numbers, whereas distribution irregularity correspondingly intensifies.
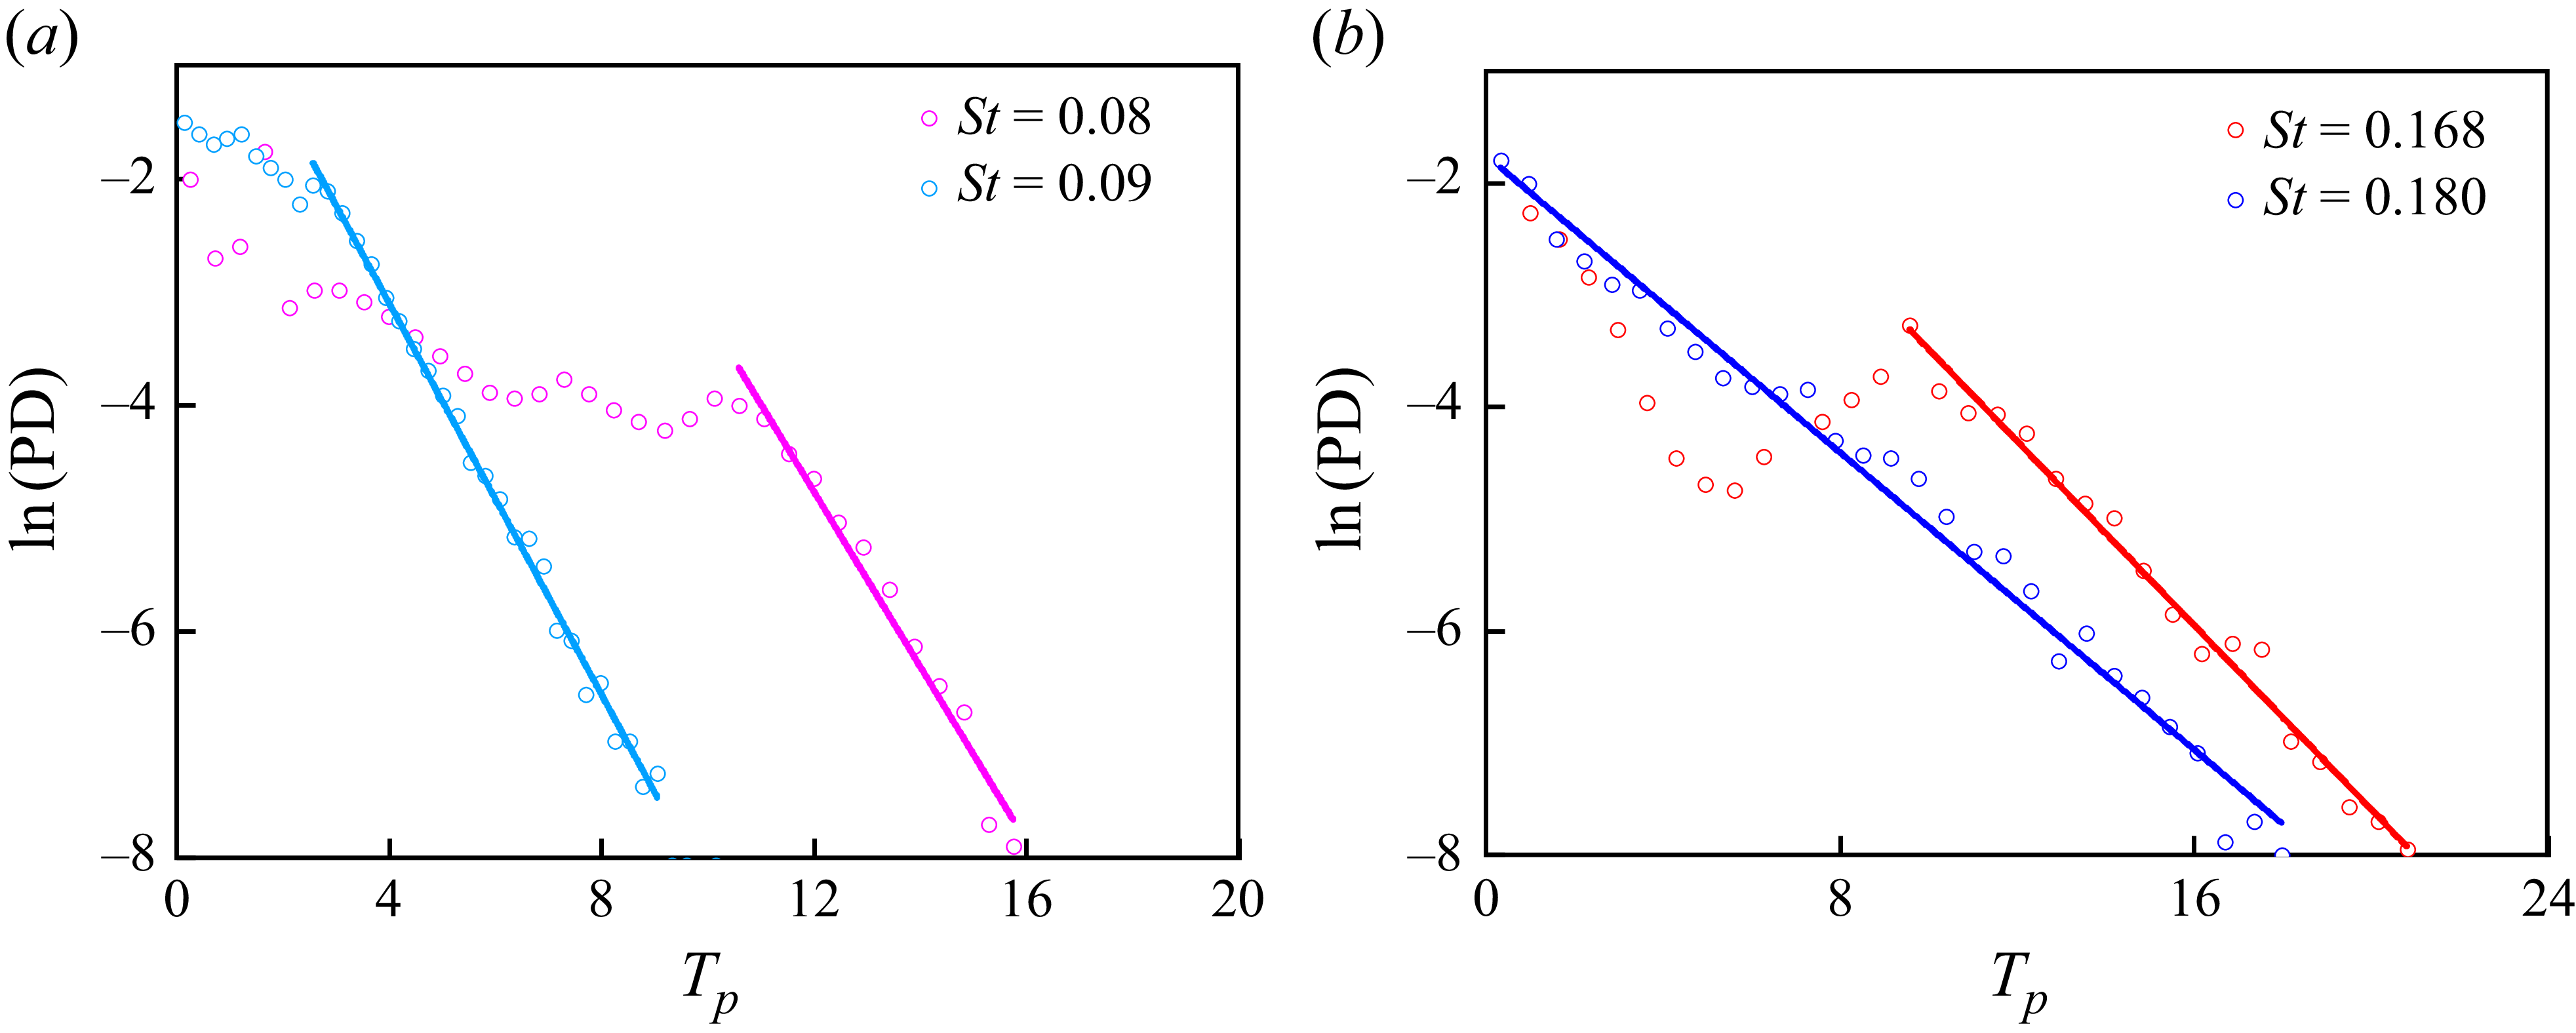
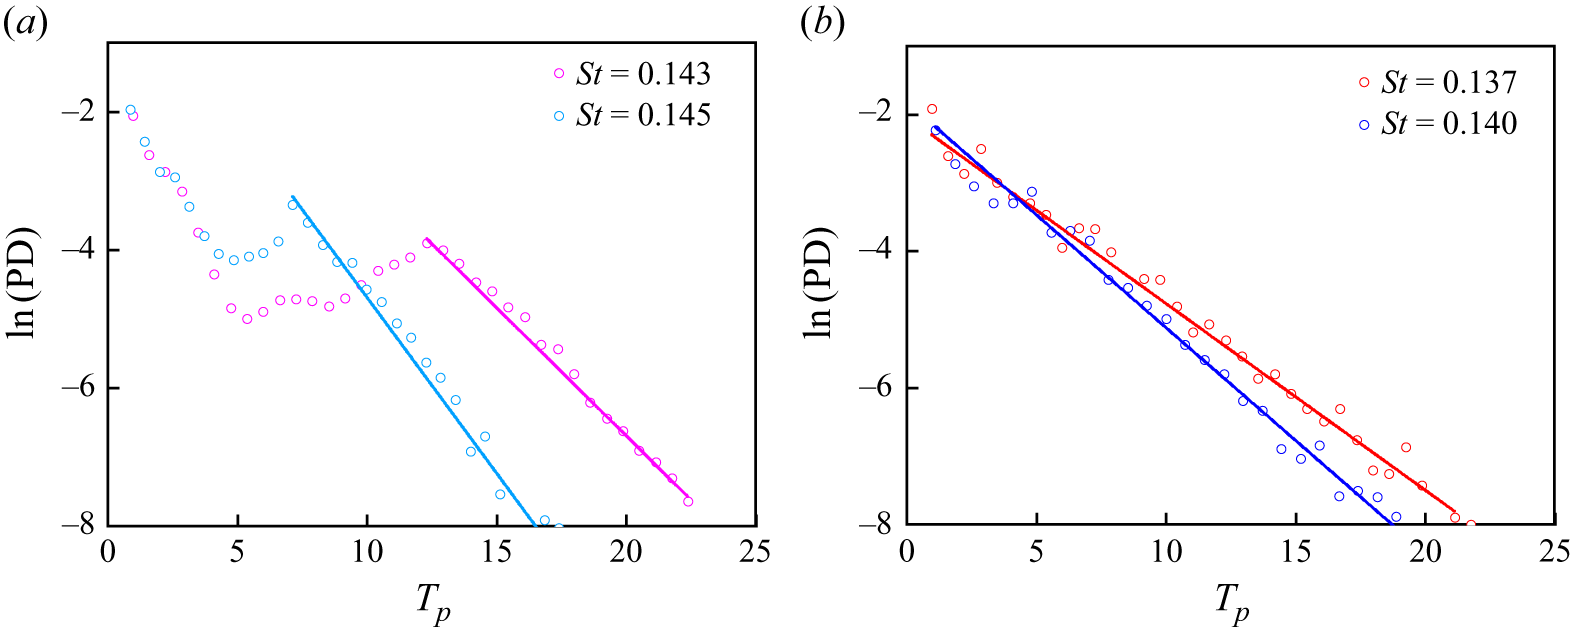
Distribution of residence times
 $T_p$
of inertial particles at Stokes numbers beyond the critical value for (
 $a$
)
 $R=0.2$
and (
 $b$
)
 $R=0.6$
in the CVP flow. The solid lines denote the best linear fit of the probability density (PD) of residence times. The slope increases as
 $R$
decreases. Particles that last relatively longer times in the V2 core region all display an exponential distribution in residence times.

Given the spatial dependence of particle residence times, calculating their probability densities is essential. Figure 12 displays the residence time distribution of inertial particles with Stokes numbers exceeding critical values at
 $R=0.2$
and
 $R=0.6$
. Despite prolonged residence times, all particles display exponential-like features, indicating transient chaos, i.e. the existence of a chaotic saddle (Tél Reference Tél2015; Kapoor et al. Reference Kapoor, Jaganathan and Govindarajan2024). Increasing particle Stokes numbers intensify the exponential characteristics of residence time distributions. At
 $R=0.6$
, particles with
 $St=0.180$
exhibit purely exponential distributions, revealing highly irregular spatial patterns where sharp ridges (prolonged residence) alternate with valleys of brief durations (figure 11). This phenomenon has also been documented by Kapoor et al. (Reference Kapoor, Jaganathan and Govindarajan2024). Furthermore, we observe that at Stokes numbers slightly beyond the critical value, the probability of a specific residence time varies non-monotonically with the residence time. This effect is more pronounced at
 $R=0.6$
. As
 $St$
further increases, the probability density becomes monotonically dependent on the relaxation time. Overall, the probability densities decrease with increasing residence time, while the slope of the decline decreases with larger
 $R$
, indicating that lighter particles are more likely to remain in the CVP for a long residence time.
5. Conclusions
In the present study, the small, dilute, heavy inertial particles, specifically those with density factor
 $R\in (0,1)$
and Stokes number
 $St \in (0,0.3)$
, are considered with the assumption of a low particle Reynolds number. We have examined the motion of these particles in counter-rotating vortex pair (CVP) flows using both analytical and numerical methods. A comprehensive diagram that illustrates the conditions for the trapping of the particle with varying Stokes number and density factor is developed. Meanwhile, we further discuss the dynamics of the particle in detail, including the mechanisms of trapping and leakage within the CVP.
The CVP is generated by two counter-rotating vortices that rotate around one another, creating a steady flow in the co-rotating reference frame. We have analytically validated that the presence of a particle-attracting ring governs the dynamics of inertial particles within this flow field, under the assumption that the particle Stokes number
 $St$
is very small. This particle-attracting ring corresponds to a unique closed streamline
 $S_0$
in the weaker vortex (V2) within the CVP, providing a plausible mechanism for particle trapping. When observed from the co-rotating reference frame, particles are attracted to the particle-attracting ring, forming a particle clustering ring (PCR) in the flow field, while the remaining particles are centrifuged to infinity. Such a particle-attracting ring exists only when the circulation ratio of the CVP satisfies
 $\gamma _{{cr}}\lt \gamma \lt 0$
for a given density factor
 $R$
of the particle, where the value of
 $\gamma _{{cr}}$
is negatively correlated with
 $R$
.
Particle trapping in the CVP is sensitive to particle inertia. In the case of moderately inertial particles, the dynamics of the particle is analysed numerically. There exists a critical Stokes number
 $St_{{cr}}$
, which is essential for the occurrence of particle trapping in the CVP. We have provided a fitting equation to approximately predict the value of
 $St_{{cr}}$
, which is dependent on both the parameter
 $\gamma$
and the particle density factor
 $R$
. Specifically,
 $St_{{cr}}$
exhibits a linear and positive correlation with the particle density factor
 $R$
, suggesting that particles with a moderate density excess preferentially form PCRs in CVP flows. Conversely, for a specified
 $R$
,
 $ St_{{cr}}$
demonstrates non-monotonic variation with
 $ \gamma$
, reaching a maximum value when
 $\gamma \approx -0.2$
. Notably, the circulation ratio of CVPs generated by vortex–wall interactions typically approximates
 $-0.2$
.
Only when the Stokes number of a moderately inertial particle is smaller than
 $St_{{cr}}$
can the particle-attracting ring trap the particles initially located in the basin of attraction (BOA). The BOA specifically occupies portions of the V1 and V2 core regions, with their spatial domains precisely delineated by flow separatrices. The distribution of the BOA is significantly influenced by particle inertia; as particle inertia increases, the area of the BOA decreases, particularly as
 $St$
approaches
 $St_{{cr}}$
. This indicates that as the Stokes number increases, fewer particles are trapped to form the PCR. In fact, the occurrence of the PCR can be essentially conceptualised as a macroscopic aggregate manifestation of multiple particles orbiting a vortex. The pseudo-forces (including centrifugal and Coriolis forces) and the fluid stress force acting on particles in the co-rotating reference frame play crucial roles in providing the necessary centripetal acceleration that maintains the curved path of the particles along the vortex perimeter. For particles with a larger density factor, the fluid stress force becomes increasingly significant compared to the other forces.
At particle Stokes numbers greater than
 $St_{{cr}}$
, beyond which trapping ceases to exist, the dynamics of particles becomes chaotic and exhibits a finite-time ‘leakage’. The particle-attracting ring in phase space coincides precisely with the saddle point at
 $St = St_{{cr}}$
, marking a crisis for the disappearance of the particle-attracting ring. Particles with
 $ St \gt St_{{cr}}$
demonstrate asymptotic escape dynamics from the V2 core region through the saddle point. Although all these particles eventually escape, they can remain trapped in the V2 core region for durations (referred to as residence time) exceeding tens of CVP rotation periods. The distribution of residence times for inertial particles with
 $St\gt St_{{cr}}$
displays localised exponential-like features, indicating transient chaos. Further increases in particle Stokes numbers amplify the exponential characteristics of residence time distributions, whereas the distribution irregularity correspondingly intensifies.
This study provides new insights into the dynamics of inertial particles within a vortex pair flow, which is crucial for understanding the mechanisms underlying particle clustering in turbulent flows. We investigated the dynamics of heavy particles with varying densities and Stokes numbers in the CVP, a scenario not previously examined by Kapoor et al. (Reference Kapoor, Jaganathan and Govindarajan2024). Based on these results, we can gain a comprehensive understanding of the dynamics of heavy particles in the vortex pair. When the particle Stokes number satisfies
 $St \lt St_{{cr}}$
, heavy particles will be trapped in co-rotating and counter-rotating vortex pairs; however, the clustering patterns and the influence of particle density on particle behaviour differ significantly. In the co-rotating vortex pair, heavy particles exhibit clustering into fixed points and rings, which is significantly influenced by the particle Stokes number. Particles with near-neutral densities (
 $R \approx 0.5$
) tend to remain longer within the vortex pair. In contrast, in the CVP, only the PCR is observed, and particles with moderate density (
 $R \rightarrow 1$
) preferentially form PCRs. Furthermore, we explore the mechanism behind the formation of the clustering ring. The presence of a particle-attracting ring that governs the periodic motion of particles may contribute to explaining the formation of the clustering ring in the co-rotating vortex pair. When
 $St \gt St_{{cr}}$
, the dynamics of the particles exhibits finite-time ‘leakage’ in both co-rotating and counter-rotating vortex pairs, and the distribution of residence time exhibits a similar localised exponential-like feature.
In addition, we have exclusively assumed that the particles are sufficiently dilute, allowing for the consideration of one-way coupling between the particle and fluid phases in the current study. However, once particle clustering is achieved – specifically, the formation of PCR in this study – the particle load in these areas becomes sufficiently high that the feedback force exerted by the particles on the fluid can be significant. Allowing for two-way coupling has been shown to induce additional instabilities (Pandey, Perlekar & Mitra Reference Pandey, Perlekar and Mitra2019; Shuai et al. Reference Shuai, Jeswin Dhas, Roy and Kasbaoui2022) and can even influence the evolution of the vortex itself (Shuai & Kasbaoui Reference Shuai and Kasbaoui2022) as well as vortex interactions (Shuai, Roy & Kasbaoui Reference Shuai, Roy and Kasbaoui2024). The alteration of the vortex flow due to particle feedback may further impact particle trapping. Therefore, it would be beneficial to extend this study to investigate the effects of particles on the vortex flow considered here.
Acknowledgements
This study was supported by the National Natural Science Foundation of China (grant nos 52279090 and U24A20140) and the Natural Science Foundation of Hubei Province (grant no. 2025AFB171). The numerical calculations in this paper were performed on the supercomputing system at the Supercomputing Centre of Wuhan University.
Declaration of interests
The authors report no conflict of interest.
Appendix A. Independence validation of the simulation time step
For particles with different effective density factors, three time steps
 $\varDelta \tau = 5\times 10^{-3},{} 1\times 10^{-3}, 1\times 10^{-4}$
are adopted to validate the independence of the time step for numerical simulation of the particle motion in the CVP. Time step independence is evaluated by comparing the critical Stokes number
 $St_{{cr}}$
for particle trapping in the CVP with circulation ratio
 $\gamma =-0.2$
. The results of the time step independence analysis for particles with different
 $R$
are shown in figure 13, where the red scatter points represent the results calculated with time step
 $\varDelta \tau = 1\times 10^{-3}$
. We can find that further decreasing the time step does not affect the value of the
 $St_{{cr}}$
for particles with various
 $R$
. Therefore, the time step
 $\varDelta \tau = 1\times 10^{-3}$
is used for simulations, which is comparable to the order of magnitude of time steps in previous studies (Kapoor et al. Reference Kapoor, Jaganathan and Govindarajan2024; Nath & Roy Reference Nath and Roy2024).
Critical Stokes number
 $St_{{cr}}$
for trapping of particles with different
 $R$
in the CVP (
 $\gamma =-0.2$
) obtained by simulations using different time steps
 $\varDelta \tau$
. When
 $\varDelta \tau$
reaches
 $1\times 10^{-3}$
, further decreasing the time step does not affect the value of
 $St_{{cr}}$
.

Appendix B. Dynamics of particles in the CVP flows with different
$\gamma$

In order to demonstrate the qualitative generalisation of our findings and briefly examine the
 $\gamma$
-dependent effects on the dynamics of particles, we show the representative case of moderately inertial particles in the CVP flows with circulation ratio
 $\gamma =-0.1$
and
 $-0.4$
.
Figure 14 illustrates PCRs in the CVP flow of different circulation ratios for particles with Stokes numbers
 $St\lt St_{{cr}}$
. It can be observed that the PCR location is aligned with the predicted particle-attracting ring
 $S_0$
when
 $St$
is sufficiently small (e.g.
 $St=0.005$
). For a specific
 $R$
, as the circulation ratio decreases, the position of the PCR moves further away from the vortex centre, which is consistent with the results presented in figure 2. The trend of the PCR to change with increasing particle Stokes number is almost consistent. Higher Stokes numbers induce spatial decoupling between the PCR and
 $S_0$
, while the PCR remains confined within the V2 core region (I). In particular, when the particle density factor is larger (
 $R=0.6$
), the PCR exhibits a progressive inward contraction and ultimately undergoes destabilisation, leading to the formation of a twisted morphology, as shown in figures 14(
 $b$
) and 14(
 $c$
). This phenomenon has been validated to be related to the characteristics of the forces acting on particles with different
 $R$
in § 4.
The PCRs in the CVP flow with different circulation ratios
 $\gamma$
at (
 $a$
)
 $\gamma =-0.1,\ R=0.2$
, (
 $b$
)
 $\gamma =-0.1,\ R=0.6$
, and (
 $c$
)
 $\gamma =-0.4,\ R=0.6$
. Blue curves
 $S_0$
denote the particle-attracting ring for the weakly inertial particles. Grey points represent particles. Note that the PCR in the CVP with
 $\gamma =-0.2$
is presented in figure 6.

The BOA for inertial particles (
 $St=0.005$
) in the CVP flows with varying
 $\gamma$
is presented in figure 15. The dark blue regions represent the BOA of the PCR, where particles become trapped, ultimately forming the PCR within the CVP flow. Notably, despite the variations in
 $\gamma$
, these attraction basins are consistently located in the V1 (II) and V2 (I) core regions, with their spatial domains clearly delineated by flow separatrices, as indicated by the bold black streamlines in figure 15. Particularly within the V2 core region, a majority of the particles become trapped. As the circulation ratio decreases, the strength of the V2 vortex intensifies, leading to a corresponding increase in the area of its core region, and consequently an expansion of the BOA. For any given
 $\gamma$
, the area of the BOA tends to decrease as particle inertia increases. As illustrated in figure 16, the particle attracting rate (which is proportional to the area of the BOA) diminishes with increasing particle inertia, especially when the particle Stokes number approaches the critical value
 $St_{{cr}}$
. When the particle Stokes number is small, the attracting rate increases as
 $\gamma$
decreases, due to the larger BOA area associated with CVP flows at lower
 $\gamma$
. The sensitivity of the BOA to changes in particle inertia varies across different
 $\gamma$
values. It is observed that this sensitivity is weakest at
 $\gamma =-0.2$
, indicating that the corresponding critical Stokes number is relatively large.
BOAs for inertial particles of (
 $a$
)
 $R=0.2$
and (
 $b$
)
 $R=0.6$
in the CVP flow with different circulation ratios. The dark blue regions represent the BOA of the PCR, where particles are eventually trapped to form the PCR in the CVP flow. The region outside these coloured regions indicates the BOA of infinity. Note that the BOA for inertial particles in the CVP with
 $\gamma =-0.2$
is presented in figure 8.

The attracting rate
 $AR$
of particles that are trapped to form the PCR in the CVP flow with different
 $\gamma$
at (
 $a$
)
 $R=0.2$
and (
 $b$
)
 $R=0.6$
. At the initial time, the particles are uniformly distributed; hence
 $AR$
is proportional to the area of the BOA. The dashed grey lines indicate
 $St=St_{{cr}}$
. When
 $St\gt St_{{cr}}$
, the area of the BOA is zero, and no particle is trapped in the CVP flow.

The residence times for inertial particles with Stokes numbers slightly greater than the critical value
 $St_{{cr}}$
in the CVP flow, across different circulation ratios, are illustrated in figure 17. We can observe that the residence time of the particles even exceeds tens of CVP rotation periods, and their spatial distribution becomes increasingly irregular for particles with a higher density factor
 $R$
in the CVP flow, regardless of the value of
 $\gamma$
. Additionally, the distribution of residence times for inertial particles with
 $R = 0.6$
in the CVP flow at varying
 $\gamma$
values is shown in figure 18. Despite changes in
 $\gamma$
, all particles exhibit exponential-like characteristics, indicating the presence of transient chaos, as mentioned previously. Increase in particle Stokes numbers and decrease in circulation ratios both enhance the exponential features of the residence time distributions.
Residence time
 $T_p$
of inertial particles with Stokes number
 $St$
slightly larger than the critical value
 $St_{{cr}}$
in the CVP flow with different circulation ratios: (
 $a$
)
 $\gamma =-0.1$
and (
 $b$
)
 $\gamma =-0.4$
. Note that
 $T_p$
for inertial particles in the CVP with
 $\gamma =-0.2$
is presented in figure 11. The colour at a given position indicates the residence time of a particle starting at that location. When
 $St\gt St_{{cr}}$
, no particle will be permanently trapped in the V2 core region (I).

Distribution of residence times
 $T_p$
of inertial particles with
 $R=0.6$
at Stokes numbers beyond the critical value
 $St_{{cr}}$
in the CVP flow with circulation ratios (
 $a$
)
 $\gamma =-0.1$
and (
 $b$
)
 $\gamma =-0.4$
. Note that the distribution of
 $T_p$
for inertial particles in the CVP with
 $\gamma =-0.2$
is presented in figure 12. The solid lines denote the best linear fit of the probability density (PD).

Comparison of the critical Stokes number
 $St_{{cr}}$
for particle trapping in the CVP (
 $\gamma = -0.2$
) with and without the inclusion of added mass effects. On the
 $x$
-axis, the particle density ratio
 $\beta$
is presented in logarithmic scale. In the light blue region (
 $\beta \in (1,100)$
), the added mass can significantly influence the particle trapping, and
 $St_{{cr}}$
has increased by at least 2 %.

Appendix C. Effect of added mass on particle trapping
To evaluate the added mass effect on particle trapping in the CVP, we have conducted a comparison analysis of the critical Stokes number
 $St_{{cr}}$
for the particle trapping with and without the inclusion of the added mass. The results are illustrated in figure 19, where the value of the particle density ratio
 $\beta$
on the
 $x$
-axis is presented in logarithmic scale. We find that when the particle density ratio is
 $\beta \in (1,100)$
, the added mass significantly influences particle trapping in the CVP, where
 $St_{{cr}}$
increases by at least 2 %. Considering the added mass, particles are more likely to be preferentially trapped in the CVP, resulting in an increased
 $St_{{cr}}$
. Specifically, when
 $\beta \approx 2.5$
,
 $St_{{cr}}$
increases by approximately 20 % compared to the case without added mass. Furthermore, the influence of added mass is not linearly correlated with the particle density ratio
 $\beta$
, which can be explained by the explicit form of the added mass force (
 $ {1}/{2\beta } ( {\mathrm{D}\boldsymbol{U(\boldsymbol{X}_p)}}/{\mathrm{D}\tau }- {\mathrm{d}\boldsymbol{v}}/{\mathrm{d}\tau } ) $
). As the density ratio decreases, the added mass force does not increase monotonically because the difference between the fluid and particle accelerations also depends on the particle density ratio. When
 $\beta \rightarrow 1$
, the particle behaves as a fluid tracer, and the difference between the fluid and particle accelerations is very small, resulting in the small added mass force.