INTRODUCTION
Fertilizer recommendations have to take rising economic and, particularly, ecological concerns into account. Therefore, the exact estimation of optimum nitrogen fertilization rates (Nopt) for arable crops become increasingly important. Most commonly, Nopt is estimated from results of field experiments where crop yield is calculated ex post as a function of the nitrogen fertilization rate. In many cases, the estimated parameters are used for calculating ex ante nitrogen fertilization recommendations. It is, however, well known that the selection of the statistical model describing the yield response to nitrogen fertilization can considerably affect estimated Nopt (Bock & Sikora Reference Bock and Sikora1990; Cerrato & Blackmer Reference Cerrato and Blackmer1990; Bullock & Bullock Reference Bullock and Bullock1994; Colwell Reference Colwell1994; Bélanger et al. Reference Bélanger, Walsh, Richards, Milburn and Ziadi2000). Furthermore, the ex post determination of optimum fertilization rates does not consider the inevitable uncertainty resulting from year-to-year and site-to-site variations in weather and soil conditions. Since farmers do not know weather conditions in advance when making their fertilizing decision it can be assumed that, in practice, they would use an identical N amount each year to adapt to annual nitrogen response variations.
The aim of the present study was to quantify the impact of yield models' functional forms, ex post v. ex ante recommendations and uncertainty in model parameter estimation on fertilization recommendations. Therefore, three kinds of uncertainty in the estimation of Nopt and corresponding grain yields, net revenues as well as N balances, were analysed in an oilseed rape (OSR)–wheat–barley rotation. Firstly, the uncertainty of model choice was analysed by estimating Nopt using three different statistical models. Secondly, year-to-year variation in nitrogen response was investigated by calculating a Nopt where the total net revenue over the years was maximum in each crop. This is called the ex ante approach; however, our dataset was too small to validate the ex ante Nopt on independent data. Finally, a Monte-Carlo simulation was performed to quantify the effect of uncertainty on the estimation of model parameters.
MATERIALS AND METHODS
Field experiment
The experimental data presented here originate from a field trial established in autumn 1990 on a pseudogleyic Luvisol of sandy loam texture at the Hohenschulen Experimental Farm of the University of Kiel (10·0°E, 54·3°N, 30 m asl), located c. 15 km west of Kiel, Schleswig-Holstein, NW Germany. Total rainfall averages 750 mm annually at the experimental site, with c. 400 mm received during April–September, the main growing season, and c. 350 mm during October–March. Further details of the experiment were previously reported by Sieling et al. (Reference Sieling, Günther-Borstel and Hanus1997).
In the present study, a dataset from 1996 to 2002 was used. In 2000 and 2001, nitrogen concentration data of OSR were missing. The experiment comprised the rotation OSR (cv. Falcon), winter wheat (cv. Orestis) and winter barley (cv. Alpaca). All plots were ploughed. Fungicides and other crop management factors (e.g. herbicides, seed date) were handled in accordance with the farmers' normal practice. Mineral N fertilization (0–280 kg N/ha) was applied three times (at the beginning of spring growth, at stem elongation and at ear emergence for wheat and barley and at the beginning of spring growth, at stem elongation and at bud formation for OSR) as calcium ammonium nitrate (0·27 kg N/kg fertilizer). The first and the second application rate varied from 0 to 120 kg N/ha, the third from 0 to 80 kg N/ha each in increments of 40 kg N/ha. In total, there were 32 different N treatments. Pig slurry was applied to half of the OSR plots in spring (80 kg total N/ha), while the other half received only mineral N fertilizer. It was assumed that 0·75 of the total N was NH4-N and so 60 kg N/ha was available for the crop. Only total N amounts were included in the calculations; application times and rates of distribution were disregarded. The plot size was 7×3 m. At crop maturity, an area of 6·75 m2 was harvested by combine and yield was standardized to a dry matter content of 0·86 for wheat and barley and 0·91 for OSR. The N uptake by the grain was obtained by multiplying the grain dry matter by the grain N concentration, determined with near infrared spectroscopy (NIRS 5000, Foss). N-balances (kg N/ha) were calculated as applied fertilizer N (kg N/ha) minus N-offtake by the grain (kg N/ha).
Statistical analyses
Nopt was estimated by three different methods (ex post, ex ante and Monte-Carlo simulation). The different underlying yield response functions to nitrogen fertilization (linear response and plateau (LRP), quadratic response and plateau (QRP), quadratic (Q)) are described by three statistical models, which were fitted to the dataset of each crop (OSR, wheat, barley) using proc REG and proc NLIN of the SAS Software package (SAS Institute Inc. 1989). Additionally, the influence of quality payments for wheat protein concentration was analysed.
The LRP model is specified by three parameters:
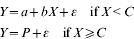
where Y is the grain yield (t/ha), X the application rate of N (kg N/ha), a the intercept b the linear coefficient and ε the error term. C is the nitrogen application rate at the intersection of the linear model and the plateau, P describes the plateau yield.
The QRP model is specified by four parameters:
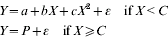
where Y is the grain yield (t/ha), X the application rate of N (kg N/ha), a the intercept, b the linear, c the quadratic coefficient and ε the error term. C is the nitrogen application rate at the intersection of the quadratic model and the plateau, P describes the plateau yield. In order to ensure a smooth derivative function, the additional side condition dY/dX=0 at X=C is introduced.
The Q model is specified by three parameters:

where Y is the grain yield (t/ha), X the nitrogen application rate (kg N/ha), a the intercept, b the linear, c the quadratic coefficient and ε the error term.
Adjusted coefficients of determination (adj. R 2) considering the different number of function parameters were determined using regression analyses for the Q model. For the LRP and the QRP models, adj. R 2 was calculated by the analysis of variance routine on the SAS output:

where n is the number of observations and k the number of variables.
The years 2000 and 2001 were omitted from calculations for the whole rotation because of the missing nitrogen concentration data for OSR.
Nopt was defined as the rate at which maximum economic returns were produced (Colwell Reference Colwell1994), calculated by marginal value product=marginal factor cost=nitrogen price for the QRP and the Q model.
The parameter estimates obtained were used for different approaches to estimate Nopt, grain yield at Nopt and the corresponding economic net revenues and N balances. At first an ex post analysis was made, i.e. Nopt was estimated for the three crops within the rotation and the different models in each year. Secondly, an ex ante Nopt for all analysed years and each crop was estimated by maximizing the objective function:
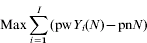
where Y i(N) is the response function in year i, I is the total number of years, pw is the price of the crop and pn the price of nitrogen fertilizer (Bullock & Bullock Reference Bullock and Bullock1994). A numerical solution of this function was calculated using the Newton method provided by the solver procedure of Microsoft Excel®.
In order to consider the uncertainties in the model parameter estimations, Monte-Carlo simulations were carried out. After testing the residuals of the regression models for normality, a normal distribution of the model parameters was assumed, characterized by the mean and the standard deviation of the parameters. For each year, 10 000 random combinations of the model parameters were generated assuming a multivariate normal distribution with correlated variables by using the Cholesky decomposition of the correlation matrix (Greene Reference Greene2003). First, to consider uncertainties in an ex post analysis, Nopt was obtained separately for each random draw. Second, the ex ante Nopt was calculated by maximizing the mean economic net revenue of all 50 000 response functions generated for the years 1996, 1997, 1998, 1999 and 2002.
Market prices were assumed to be 0·6 €/kg N, 200 €/t OSR, 100 €/t wheat and 90 €/t barley.
In order to consider the effect of the N application rate on quality parameters, Nopt for wheat was also estimated regarding protein concentration and grain yield. For this purpose the Q model and an empirical function relating the grain protein content to the nitrogen application rate and the yield level was used:

where Prot is the protein concentration (mg/g), X the nitrogen application rate (kg N/ha), Y the grain yield (t/ha) a the intercept, b and c the linear coefficients and ε is the error term. The impact of protein concentration on net revenues were defined according to Baker et al. (Reference Baker, Young, Huggins and Pan2004) by Eqn (7):

where NR is the net revenue (€/ha), Y the grain yield (t/ha), N the nitrogen application rate (kg N/ha), P the protein concentration (mg/g), pw the market price for wheat at 115 mg/g protein concentration, pn the N fertilizer price (0·6 €/kg N) and 5 the premium or discount for protein concentration (€/t).
RESULTS
Statistical features
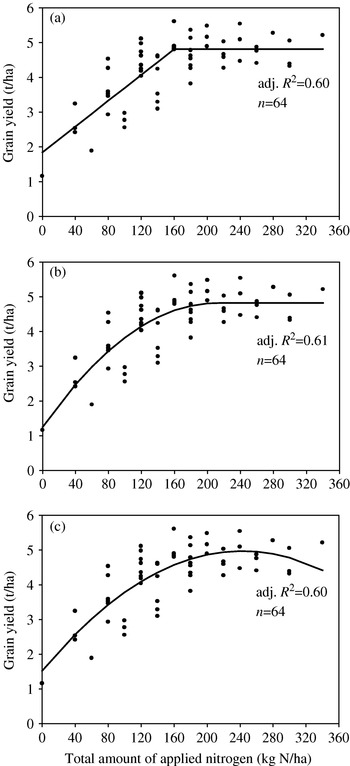
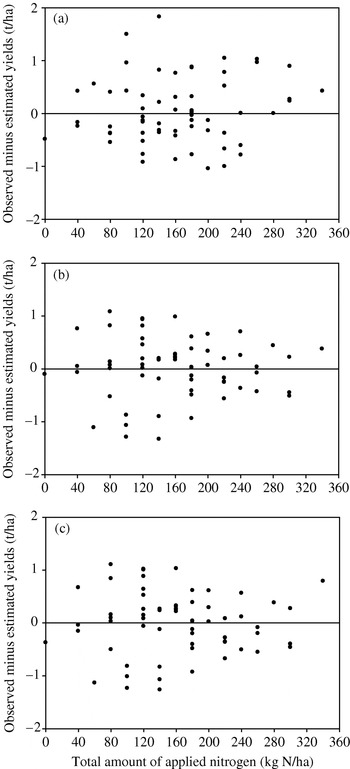
As an example for the common ex post analysis, the application of the statistical models for yields of OSR in 2002 is shown in Fig. 1 while Fig. 2 gives the corresponding regression residuals. The model outcomes resulted in different values for Nopt (160 kg N/ha (LRP), 192 kg N/ha (QRP) and 217 kg N/ha (Q)).
OSR yield response to N fertilization in 2002 described using (a) the LRP model, (b) the QRP model and (c) the Q model.

Residuals of the regression (observed yield minus estimated yield) when (a) the LRP model, (b) the QRP model and (c) the Q model were fitted to yield data of OSR v N fertilization in 2002.

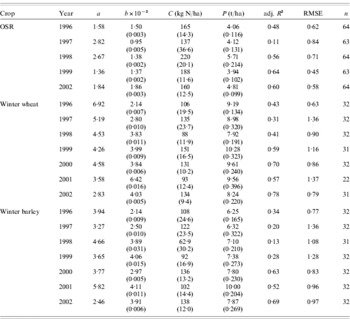
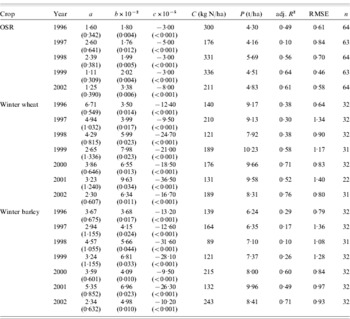
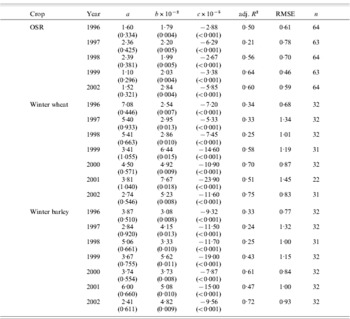
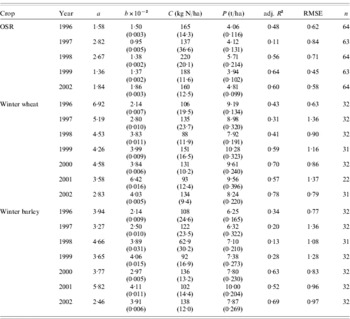
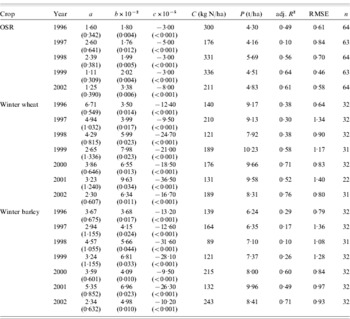
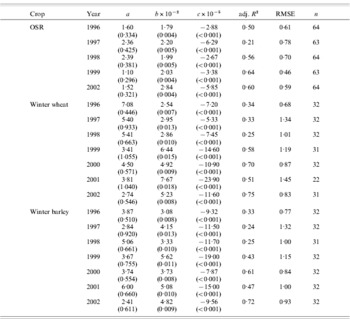
Parameters of all model fits are given in Tables 1–3. The differences in the adj. R 2 values for grain yield between the models for a given crop and year were rather small. Also, differences between the intercepts of the QRP and the Q model were marginal, but the LRP model estimated higher yields without fertilization. Differences in the intercept between the years, i.e. different weather and soil conditions, were considerable. The intercept estimated by the Q model varied from 2·74 to 7·08 in wheat, indicating a variable N availability from natural sources between the years. Analysis of variance showed that all model fits were significant (P<0·05), except the QRP model in barley in 1998 (P=0·0567) (data not shown). According to a Shapiro–Wilk test (P=0·05; Thode Reference Thode2002), the residuals of the Q model were normally distributed in 16 of 19, 15 of 19 and 14 of 19 crop and year combinations for the Q, LRP and QRP model respectively (data not shown).
Intercept (a), linear coefficient (b), adj. R 2, C, P, RMSE (root mean square error) and n of the LRP model (s.e.±)
Intercept (a), linear coefficient (b), quadratic coefficient (c) adj. R 2, C, P, RMSE and n of QRP model (s.e.±)
Intercept (a), linear coefficient (b), quadratic coefficient (c), adj. R 2, RMSE and n of the quadratic model (s.e.±)
Ex post Nopt
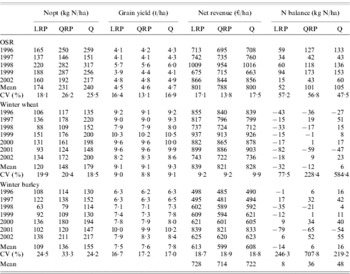
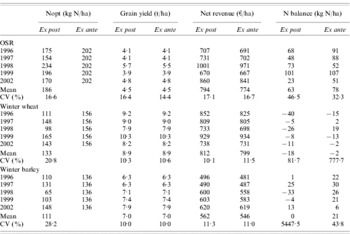
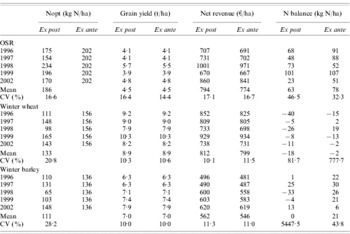
The Q model estimated the highest ex post Nopt values for all years and crops except for OSR in 1999, the LRP model the lowest Nopt (Table 4). Mean Nopt values increased by c. 30 kg N/ha from the LRP to the QRP model in wheat and barley and c. 60 kg N/ha in OSR. The QRP model differed from the Q model by c. 30 kg N/ha in wheat, c. 20 kg N/ha in barley and c. 10 kg N/ha in OSR (Table 4). The Q model estimated slightly higher grain yields at Nopt, compared to the QRP and LRP model which gave quite similar results for all crops. Between the years, estimated Nopt and corresponding grain yields differed considerably. In wheat, the estimated Nopt was in the range 135–220 kg N/ha for the Q model, 117–178 kg N/ha for the QRP model and 88–151 kg N/ha for the LRP model (Table 4). The highest net revenues were calculated by the LRP model, followed by the Q and QRP model. Mean N balance values in OSR were up to 105 kg N/ha when Nopt was estimated by the Q model, followed by the QRP model (101 kg N/ha) and the LRP model (52 kg N/ha). The lowest N balances which were even negative in winter wheat and winter barley were calculated by the LRP model in all three crops. Regarding the rotation these negative N balances were levelled out by the positive N balance of OSR. Within the crops N balances decreased in the order OSR, wheat, barley. In particular N balances of OSR indicate large nitrogen residuals after harvest.
Ex post Nopt (kg N/ha), grain yield (t/ha), net revenue (€/ha) and N balance (kg N/ha) at ex post Nopt of OSR, winter wheat and winter barley
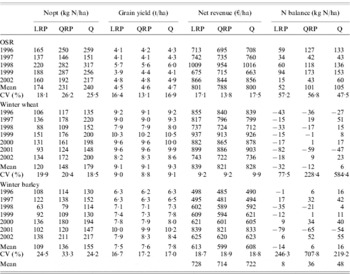
CV, Coefficient of variation
Ex ante Nopt
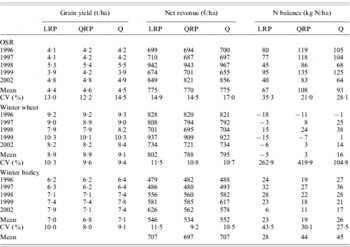
In order to give ex ante recommendations which take variability of growing conditions among years into account, an identical fertilization rate over the years was calculated for each crop at which the sum of the net revenues over the years was maximal. Ex ante Nopt values were 189 kg N/ha (LRP), 239 kg N/ha (QRP) and 222 kg N/ha (Q) in OSR, 151 kg N/ha (LRP), 162 kg N/ha (QRP) and 184 kg N/ha (Q) in wheat and 138 kg N/ha (LRP), 132 kg N/ha (QRP) and 145 kg N/ha (Q) in barley. On an average, ex ante Nopt was higher about 25 kg N/ha for the LRP model and 7 kg N/ha for the QRP model, but 8 kg N/ha lower for the Q model compared to the mean of the Nopt values obtained ex post. At least on an average over the three different models, the corresponding grain yields and also net revenue values, however, were lower and N balance values were higher compared with the scenario of a variable, ex post calculated Nopt for each year (Tables 4 and 5). Table 5 shows the influence of ex ante Nopt on N balances and net revenues in the rotation. Compared to the LRP and Q model mean net revenues in the rotation were 10 €/ha lower calculating with the QRP model (Table 7). In general, the differences between ex post and ex ante Nopt were higher for the LRP model compared to the Q model. Comparing the mean ex post and the ex ante Nopt estimated by the LRP model, it was clearly observable that the ex ante Nopt is the more favourable choice for fertilization recommendation because mean net revenue in the rotation increased for 14 €/ha (Table 7).
Grain yield (t/ha), net revenue (€/ha) and N balance (kg N/ha) in the rotation estimated with ex ante Nopt

Monte-Carlo analysis
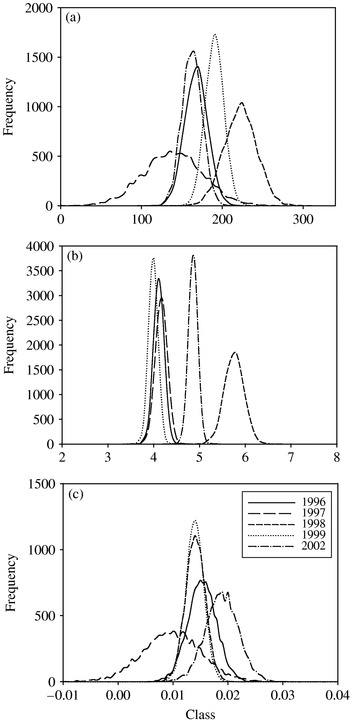
As an example result, the distribution of the model parameters for the LRP model in OSR is shown in Fig. 3. The C (Nopt) and b (linear coefficient) distribution curves of the year 1997 show the difficulties in determining Nopt ex post in this year. Ten thousand generated parameters were too few to obtain a smooth curve because the number of generated parameters in each class was much lower compared to other years with narrower distributions. The effect of the Monte-Carlo simulation on the ex post LRP model parameters was an increase in Nopt (Tables 4 and 6). This effect was clearly observable, especially in OSR. Mean Nopt over the single years increased by 12 kg N/ha. In wheat, mean Nopt increased by 10 kg N/ha and in barley it only increased by 6 kg N/ha, calculated by the mean of only the years 1996, 1997, 1998, 1999 and 2002. Because of missing data on N concentration of OSR in the years 2000 and 2001, these years were omitted in the calculations for the comparison of the mean model outcomes for the crops in the rotation for the ex ante approach. Also, ex ante analyses for the LRP model were conducted by running Monte-Carlo simulations. This again led to a considerable increase in Nopt of 13 kg N/ha in OSR, a small increase of 5 kg N/ha in wheat but a decrease of 2 kg N/ha in barley (Table 7). The effects of mean net revenue in the rotation were small but mean N balance rose (Table 7).
Distribution of the generated parameters of the LRP model in each year for OSR (a) C (Nopt), (b) P (plateau yield), (c) b (linear coefficient).

Effect of the Monte-Carlo simulation of the LRP model parameters on Nopt (kg N/ha), grain yield (t/ha), net revenue (€/ha) and N balance (kg N/ha) at ex post Nopt in comparison to the ex ante Nopt estimated by the LRP model
Mean ex post Nopt, ex ante Nopt with and without Monte-Carlo simulation (MC) and corresponding net revenues and N balances



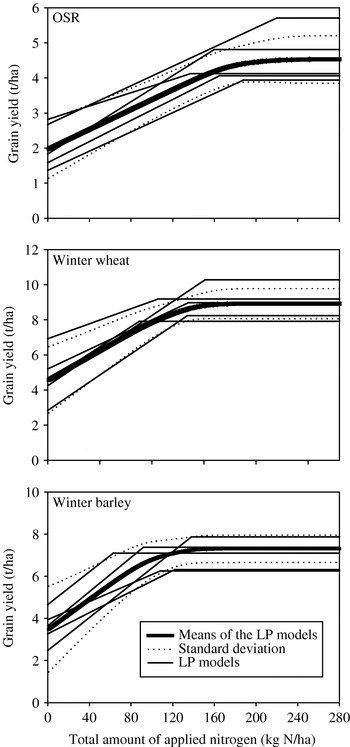
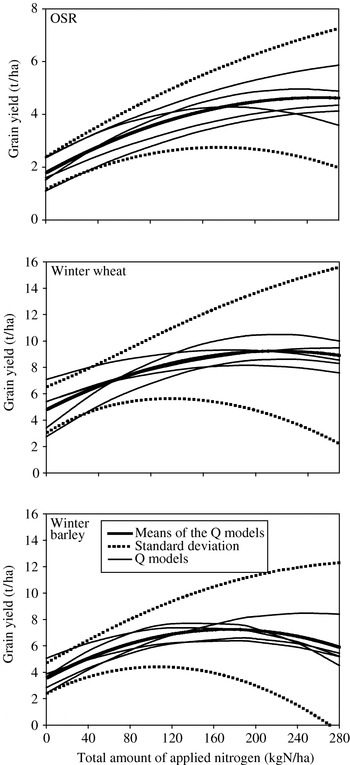
When the Monte-Carlo simulation for the Q model was carried out for the ex post approach only marginal changes in Nopt were observed for each crop, therefore annual data are not presented. The Monte-Carlo simulation for the ex ante Nopt estimated by the Q model over the years led to a slight increase of the Nopt values to 225 kg N/ha in OSR, 188 kg N/ha in wheat and 148 kg N/ha in barley compared to the ex ante Nopt without Monte-Carlo simulation (Table 7). It was therefore concluded that the Q model is quite stable with regard to parameter estimation uncertainty. The Monte-Carlo simulation for the ex ante Nopt entailed only marginal effects in wheat and barley when the LRP model was used, but in OSR Nopt increased by about 10% from 189 to 202 kg N/ha (Table 7). Regarding N balances and net revenues, the Monte-Carlo simulation led to negligible changes. Although Nopt in OSR increased due to Monte-Carlo simulation there were still stronger differences between the production functions, i.e. between the LRP and the Q model in Nopt and N balance (Table 7). Mean yields, standard deviations of the 50 000 generated LRP and Q models and the functions of the years 1996, 1997, 1998, 1999 and 2002 are given in Figs 4 and 5 for the three crops.
LRP model fitted to five individual years (1996, 1997, 1998, 1999 and 2002) for the crops OSR, winter wheat and winter barley, as well as the mean yield response curve for the three crops derived from 50 000 simulated LRP models and the standard deviation of the mean yield.
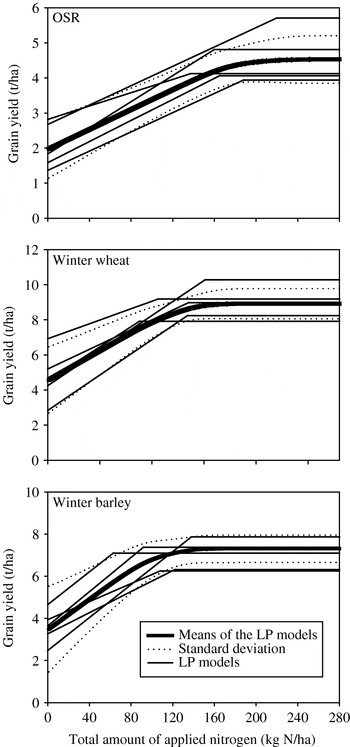
Quadratic model fitted to five individual years (1996, 1997, 1998, 1999 and 2002) for the crops OSR, winter wheat and winter barley, as well as the mean yield response curve for the three crops derived from 50 000 simulated Q models and the standard deviation of the mean yield.

Nopt regarding protein concentration
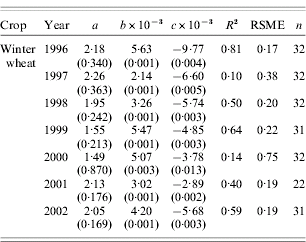
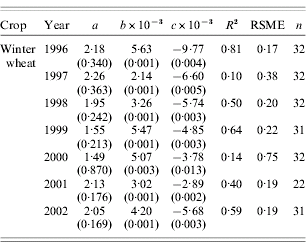
Protein contents of wheat could be described using Eqn (6) with a quite different accuracy for the different years (Table 8). Using this simple statistical model, however, the determination of Nopt considering quality payment in wheat was only possible applying the Q model. This is because the plateau yield of the other two models and the quality surplus to nitrogen price ratio led to infinitely high optimum N rates.
Intercept (a), linear coefficients (b,c), R 2, RSME and n of the protein function (s.e.±)
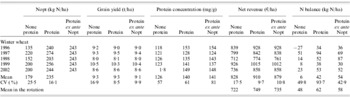
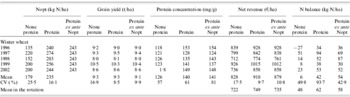
The calculated effects of the quality payment on the estimates for Nopt were considerable (Table 9). Mean Nopt for the wheat crop increased from 179 to 235 kg N/ha, mean net revenue from 828 to 910 €/ha and mean N balance from 6 to 42 kg N/ha. Estimating an identical Nopt considering protein concentration the N amount rose from 184 to 243 kg N/ha (Table 7). In the rotation mean N balance in the single years increased from 48 to 62 kg N/ha and mean net revenue from 722 to 749 €/ha (Table 9). These results indicate that taking grain protein concentrations into account has a tremendous influence on Nopt in wheat as well as corresponding N balance and net revenue of the whole rotation increasing the economic productivity of the wheat crop by 82 €/ha.
Nopt (kg N/ha), grain yield (t/ha), protein concentration (mg/g), net revenue (€/ha) and N balance (kg N/ha) of winter wheat at Nopt estimated by the Q model with and without having regard to protein concentration for each year
DISCUSSION
The aim of the present paper was to quantify uncertainties in estimating Nopt and agronomic, ecological and economic variables in an OSR–wheat–barley rotation.
Simple statistical nitrogen response models, as used in the present study, are quite commonly used for making ex ante N fertilizer recommendations. The validity of these simple response models, however, is generally limited because the complex relationship between the crop yield and the N rate in interaction with variable soil and weather conditions cannot be mimicked by those simple equations. Therefore, very often only empirical reasons are considered for the acceptance or rejection of any of these models. Colwell (Reference Colwell1994) listed statistical values like R 2 and analysis of variance for the accuracy of fertilization rates estimated by different models as criteria for model choice. The obtained differences in adj. R 2 values in the present study were small between models for all crops in a year (Tables 1–3) and agree with the results of Cerrato & Blackmer (Reference Cerrato and Blackmer1990), Bullock & Bullock (Reference Bullock and Bullock1994) and Bélanger et al. (Reference Bélanger, Walsh, Richards, Milburn and Ziadi2000). In addition, regression residuals have to be normally distributed for the proper application of the above mentioned empirical criteria. In the present study, this criterion was fulfilled in most of the cases. Also, the quality of dataset used for model comparison is important. The present data include many different N rates but these are remarkably scattered because of missing replications and a different splitting of total N amounts. This may have hampered to some extent a clear distinction between the descriptive quality of the models in the study. Statistical and empirical features, however, can only be one criterion for justifying one model over the others.
The differences in the ex post Nopt values and the intercepts (available soil mineral N) between the years and the corresponding yields, net revenues and N balances show clearly the annual variations in nitrogen response of all investigated crops. In consequence, N balances varied greatly between the years because many factors like climate and plant stress, which cannot be influenced by the farmer, affect N use efficiency and therefore N balances. This illustrates the principal difficulties in controlling N balances.
Ex post Nopt values differed noticeably between the models. This agrees well with results of Cerrato & Blackmer (Reference Cerrato and Blackmer1990) and Bélanger et al. (Reference Bélanger, Walsh, Richards, Milburn and Ziadi2000). The LRP model tends to overestimate yields at Nopt (Cerrato & Blackmer Reference Cerrato and Blackmer1990; Bélanger et al. Reference Bélanger, Walsh, Richards, Milburn and Ziadi2000). This may be one reason that the LRP model estimated highest net revenues and lowest N balance values (Table 4).
Uncertainty in annual nitrogen response was considered by determining an ex ante Nopt. It was found that this kind of uncertainty led to higher N rates compared to the mean of ex post Nopt values. The same effect for the used price cost ratios can be expected if a multi site identical Nopt would be calculated because of different production functions due to variable soil mineral nitrogen and yield potential (Babcock Reference Babcock1992). The ex ante Nopt values of the Q model were quite similar with the official fertilization recommendations.
Uncertainties in model parameter estimates were taken into account by using Monte-Carlo simulations. This leads to both higher ex post and higher ex ante Nopt values, especially when estimated by the LRP model. The differences between the two models in Nopt therefore became smaller whereas the overall Nopt increases. The stronger effect of the Monte-Carlo simulation on the LRP model compared to the Q model is caused by the curves' progression (Figs 4 and 5). The Q model punishes very high N fertilization rates because of reducing yields when exceeding maximum yield, whereas the maximum yield estimated by the LRP model remains constant. In general, the influence of the uncertainties due to year-to-year variation and parameter estimates uncertainty on the LRP model was much higher than on the Q model thereby decreasing the differences between both models. Several studies conclude that the LRP model is more suitable to describe crop response to fertilization (Paris & Knapp Reference Paris and Knapp1989; Kuhlmann Reference Kuhlmann1992; Baeumer Reference Baeumer, Dierks and Heitefuss1994). Baeumer (Reference Baeumer, Dierks and Heitefuss1994) argued in an agronomic way that high Nopt, as estimated by the Q model, probably leads to high yields but does not exclude over-fertilization. In contrast, using a lower Nopt, as obtained from the LRP model, prevents over-fertilization but highest yields are not assured. Baeumer (Reference Baeumer, Dierks and Heitefuss1994) favoured the application of the LRP model as a regulative strategy in order to avoid increasing negative effects of over-fertilization (e.g. N leaching, weeds). The results of the present study, however, indicate that the use of the LRP model may lead to sub-optimal yields and net revenues if fertilization recommendations are derived by simply averaging ex post Nopt values estimated by this model for a range of environmental conditions. As an example, mean net revenue calculated with the mean ex post Nopt were 780 € for the LRP model in winter wheat compared to 802 € calculated with the ex ante Nopt. Despite the fact that the LRP model may be the best model for describing yield response under homogenous boundary conditions, the heterogeneity of annual climate and different soil conditions leads to a situation where the Q model seems to be safer in terms of preventing financial losses under conditions of uncertainty. Similar conclusions were drawn by Wagner (Reference Wagner, Grosskopf, Hanf, Heidhues and Zeddies1995a, Reference Wagner, Noell and Pohlmannb) by analysing yield response in different environments and over different spatial scales within agricultural fields. On the other hand, the risk of high positive N balances rises and the introduction of penalty functions may therefore reverse this ranking of models.
Due to the national implementation of the EU Nitrate Directive, German farmers face restricted N balances of 60 kg N/ha averaged over three years beginning in 2009. In the present study, this limitation could be met by ex post and ex ante analysis on a plot level but it is likely that the EC drinking water directive leads to more restrictive limits. Sieling & Kage (Reference Sieling and Kage2006) reported that more than 34 kg N/ha leaching already exceeds the EC threshold of 50 mg/l nitrate in drinking water for a drainage rate of 300 mm typically for the experimental site. However, a stronger restriction of N balances in arable cropping systems would probably not only be associated with a reduction of N fertilization but also with other changes in production systems. Because OSR is the crop with the highest N balance surplus, the competitiveness of OSR against other crops may decrease in the situation of strongly restricted N balances. A reduction to a sub-optimal N fertilization rate, however, can also have negative effects on the efficiency of other inputs and consequently on the overall resource use efficiency in arable cropping (De Wit Reference De Wit1992). According to Sylvester-Bradley & Chambers (Reference Sylvester-Bradley and Chambers1992) and Sieling & Kage (Reference Sieling and Kage2006) there is no direct short-term correlation between N balance and nitrogen leaching. Nitrogen losses due to leaching are mainly affected by weather conditions, the preceding crop and the N supply. It is also important to mention that increasing N fertilization does not automatically increase N losses via leaching if N is transformed to yield. These results underline the importance of the considerations of uncertainties for fertilization recommendations because the empirical ex post knowledge about Nopt is hardly to adopt when a decision about the actual N rate is made. Sylvester-Bradley & Chambers (Reference Sylvester-Bradley and Chambers1992) reported that fertilizer N recommendations only accommodate a small proportion of the variation in optimum N fertilizer amounts.
CONCLUSIONS
Nitrogen response to yield and thereby net revenues and N balances varied between the single years and the estimated models in the three crops. Taking uncertain year-to-year variations and model parameter estimates into account ex ante Nopt tended to increase for OSR and wheat. Additionally the mean net revenue of the whole rotation rose using the ex ante approach compared to the calculations with the averaged ex post Nopt. This effect was especially observable calculating with the LRP model but there was a smaller or even reverse effect in case of OSR when calculating with the Q model. However, simulation of parameter estimation uncertainty had a smaller effect especially on net revenues and N balances. It is therefore concluded that the effects of uncertainty depend on the yield models' functional form (LRP v. Q) The Q model seems to be quite unsusceptible to uncertainties in year-to-year nitrogen response variation and parameter estimation uncertainty but the LRP model shows an explicit increase in net revenues when uncertainties were considered. According to our calculations, restricted N balances of 60 kg N/ha surplus could be met without serious impact on profits. In practice, however, for arable farms with similar rotation and climatic conditions as underlying the present study such a restriction might be critical because of other uncertainties in N use efficiency not considered in this study.