



1. Introduction
Drop impact phenomena are omnipresent in nature and industrial applications. Despite well over a hundred years of study, many fundamental questions – regarding, for example, splash morphology, droplet size distribution, merger process of the drop and liquid substrate – remain unsettled (Yarin Reference Yarin2006; Deegan, Brunet & Eggers Reference Deegan, Brunet and Eggers2008). An ongoing renaissance of the subject driven by new experimental (Thoroddsen, Etoh & Takehara Reference Thoroddsen, Etoh and Takehara2003; Xu, Zhang & Nagel Reference Xu, Zhang and Nagel2005; Fezzaa & Wang Reference Fezzaa and Wang2008; Kolinski et al. Reference Kolinski, Rubinstein, Mandre, Brenner, Weitz and Mahadevan2012) and computational techniques (Oguz & Prosperetti Reference Oguz and Prosperetti1989; Josserand & Zaleski Reference Josserand and Zaleski2003; Popinet Reference Popinet2003; Howison et al. Reference Howison, Ockendon, Oliver, Purvis and Smith2005; Popinet Reference Popinet2009; Tryggvason, Scardovelli & Zaleski Reference Tryggvason, Scardovelli and Zaleski2011) has revealed previously unsuspected effects and structures. One such structure is the ejecta sheet.
From Worthington’s pioneering studies (Worthington Reference Worthington1882) onward, the standard picture of splashing from drop impact with a liquid layer consisted of the formation, growth and disintegration of a single sheet-like jet, herein called the lamella. However, Weiss & Yarin (Reference Weiss and Yarin1999), using inviscid irrotational numerical computations, found evidence of an earlier jet but did not follow its evolution through the entire lifetime of the splash, because of a very strong stretching of the Lagrangian frame they used. This jet was first observed experimentally by Thoroddsen (Reference Thoroddsen2002), who called it the ejecta sheet, although his experiments revealed that the ejecta sheet evolved into the leading edge of the lamella. More recent experiments showed that at high Reynolds numbers the ejecta and lamella are truly distinct jets, but coalesce into a single jet below a threshold in the Reynolds number (Zhang et al. Reference Zhang, Toole, Fezzaa and Deegan2012a ). At even higher Reynolds numbers, multiple generations of ejecta sheets are possible (Zhang et al. Reference Zhang, Toole, Fezzaa and Deegan2012b ). The dynamics of the ejecta sheet was also studied by Thoroddsen et al. (Reference Thoroddsen, Thoraval, Takehara and Etoh2011) and Thoraval et al. (Reference Thoraval, Takehara, Etoh, Popinet, Ray, Josserand, Zaleski and Thoroddsen2012), who reproduced numerically the complex evolution of the ejecta shapes.
Here, we report the results of our investigation of the bifurcation from one to two jets using experiments and numerical simulations. We report two different types of experiments. In the first set, the use of different fluids in the drop and the pool allows for the direct observation of the interface between the liquid in the pool and the drop. These experiments reveal that a second jet is formed by a vortex ring separating from the free surface and later resurfacing. In the second set, the fluid is the same in the drop and the pool. While the vortex is not experimentally observable in these experiments, the similar shape of the air–liquid interface in both the two-fluid experiments and the single-fluid experiments (compare figures 1 g and 2 e) strongly suggests that the same vortex shedding observed directly in the two-fluid system is also occurring in the single-fluid system. This is confirmed by our numerical simulations of the single-fluid system. We observe in simulations a vortex that either remains attached to the surface or separates from the surface depending on the system parameters. When the vortex remains attached, a single jet is produced; when it detaches, two jets are produced. While we were unable to identify the mechanism causing the transition, we find that the capillary number is the best order parameter for characterizing it.
2. Experiments
In the experiments of Zhang et al. (Reference Zhang, Toole, Fezzaa and Deegan2012a ,Reference Zhang, Toole, Fezzaa and Deegan b ) the impact of a drop onto a deep pool of the same liquid was studied using X-ray high-speed phase contrast imaging. These experiments showed the existence of two distinct sheet-like jets, each capable of producing secondary droplets, that at low Reynolds numbers merged into a single jet (see figure 1). The earlier emerging of these jets has the usual characteristics of a jet generated by the collision of fluid bodies. We call this jet the ejecta since it most resembles the ejecta sheet identified by Weiss & Yarin (Reference Weiss and Yarin1999) and Thoroddsen (Reference Thoroddsen2002). The later emerging jet begins curled up and unwinds with time, an evolution so patently different from that of the ejecta that it strongly hints at a different genesis. Here, we call this structure the roll jet. At low Reynolds numbers, only one jet is generated and it can be interpreted as a merger of the ejecta and the roll jet into a single jet. Here, we call this single jet the lamella because it most resembles the structure traditionally identified as the jet that produces a crown (or corona) splash (e.g. figure 1 of Zhang et al. (Reference Zhang, Brunet, Eggers and Deegan2010)).
Phase contrast X-ray images showing the evolution of the lamella
(a–d) at
 $We=268$
and
 $Re=1978$
and an ejecta sheet and roll jet
(e–i) at
 $We=292$
and
 $Re=2042$
. At later times (not shown), the tip of the roll jet
overtakes the base, and the jet curves away from the centre, rather than as
shown in (g–i), where it curves towards the
centre. The scale bar corresponds to 0.25 mm. Time increases from left to
right.

Thoraval et al. (Reference Thoraval, Takehara, Etoh, Popinet, Ray, Josserand, Zaleski and Thoroddsen2012) showed
that the base of the ejecta sheet can rise on the side of the drop, shedding vortices
along the way. To investigate whether such a vortex is present in conditions similar to
those where two jets form, we repeated the experiments described in Zhang
et al. (Reference Zhang, Toole, Fezzaa and Deegan2012a
), except that the fluids in the pool and the drop were slightly different. The
fluid in the drop was a silicone oil with density
 ${\it\rho}=0.759~\text{g}~\text{cm}^{-3}$
, viscosity
 ${\it\mu}=0.49~\text{cP}$
and surface tension
 ${\it\sigma}=15.7~\text{dyn}~\text{cm}^{-1}$
; the fluid in the pool was also a silicone oil with
 ${\it\rho}=0.813~\text{g}~\text{cm}^{-3}$
,
 ${\it\mu}=0.82~\text{cP}$
and
 ${\it\sigma}=17.2~\text{dyn}~\text{cm}^{-1}$
. These two fluids are miscible, and as such the interfacial tension
between them is negligible. Since X-ray phase contrast imaging is sensitive to density
gradients, these experiments reveal the evolution of the fluid–fluid interface between
the drop and the pool. A typical sequence illustrating the formation of a rolled up
vortex sheet, which we call a roll jet, is shown in figure 2 (see the supplementary movies available at http://dx.doi.org/10.1017/jfm.2014.723 for a video of the same sequence). In
figure 2(a), the presence of
two vortices is shown inside the two bumps on the side of the drop. The first jet
emerges (2
b) at the location of the higher vortex. Despite its early emergence,
its characteristically curled shape indicates that it is not an ejecta sheet, but rather
a roll jet. The second vortex separates from the free surface and forms a second roll
jet further from the centre (see 2
d–f).
Phase contrast X-ray images showing the formation of two roll jets. A vortex
forms on the interface near the nascent ejecta (a,b),
separates (c) and reconnects with the interface to form the
roll jet (d–f). The impact speed
 $U=220~\text{cm}~\text{s}^{-1}$
and the drop diameter
 $D=0.16~\text{cm}$
. The scale bar corresponds to 0.2 mm. The fluids in the pool
and the drop were slightly different (see text). Since our technique is
sensitive to density differences, the vortex is rendered visible by the
contrast between the entwined fluids. The red arrows point to the centre of the
vortex.

3. Numerical simulations
The similar morphology of the jets in the two-fluid system to that in the single-fluid system (drop and pool composed of same fluid) suggests that the same vortex dynamics is occurring in a single-fluid system. Since the motion of the drop–pool interface is invisible to the X-ray technique when the fluids are the same, we instead used numerical simulations. These reproduce with high fidelity all the features and evolution of the free surface observed experimentally. Moreover, the simulations provide data on the flow everywhere in the fluid and access a greater swath of the parameter space than is accessible experimentally.
3.1. Numerical method
We simulate a gas–liquid system with respective densities
 ${\it\rho}_{g}$
and
 ${\it\rho}_{l}$
and viscosities
 ${\it\mu}_{g}$
and
 ${\it\mu}_{l}$
using the Navier–Stokes equations:
 $$\begin{eqnarray}\displaystyle & {\it\rho}(\partial _{t}\boldsymbol{u}+\boldsymbol{u}\boldsymbol{\cdot }\boldsymbol{{\rm\nabla}}\boldsymbol{u})=-\boldsymbol{{\rm\nabla}}p+\boldsymbol{{\rm\nabla}}\boldsymbol{\cdot }(2{\it\mu}\unicode[STIX]{x1D63F})+{\it\gamma}{\it\kappa}{\it\delta}_{s}\boldsymbol{n}+{\it\rho}g\boldsymbol{z}, & \displaystyle\end{eqnarray}$$
 $$\begin{eqnarray}\displaystyle & \boldsymbol{{\rm\nabla}}\boldsymbol{\cdot }\boldsymbol{u}=0, & \displaystyle\end{eqnarray}$$
 $\boldsymbol{u}$
is the fluid velocity,
 ${\it\rho}\equiv {\it\rho}(\boldsymbol{x},t)$
is the density,
 ${\it\mu}\equiv {\it\mu}(\boldsymbol{x},t)$
is the viscosity and
 $\unicode[STIX]{x1D63F}$
is the deformation tensor. The Dirac distribution function
 ${\it\delta}_{s}$
expresses the fact that the surface tension term is concentrated at
the interface,
 ${\it\kappa}$
and
 $\boldsymbol{n}$
being the curvature and the normal of the interface respectively.
We use the Gerris code, a quad/octree-based multilevel solver described in detail in
Popinet (Reference Popinet2003). The interface is tracked by a
volume-of-fluid method described in Popinet (Reference Popinet2009) and Tryggvason et al. (Reference Tryggvason, Scardovelli and Zaleski2011). The accuracy of the code has been validated for a number
of multiphase flow problems (Fuster et al.
Reference Fuster, Agbaglah, Josserand, Popinet and Zaleski2009; Popinet Reference Popinet2009; Agbaglah et al.
Reference Agbaglah, Delaux, Fuster, Hoepffner, Josserand, Popinet, Ray, Scardovelli and Zaleski2011), including splashing (see e.g. Thoraval
et al.
Reference Thoraval, Takehara, Etoh, Popinet, Ray, Josserand, Zaleski and Thoroddsen2012, Reference Thoraval, Takehara, Etoh and Thoroddsen2013; Agbaglah & Deegan Reference Agbaglah and Deegan2014).
3.2. Numerical simulations
We model a drop with diameter
 $D$
and speed
 $U$
falling vertically through an initially quiescent gas and impacting
on a deep pool of the same liquid with depth
 $H=5D$
. The simulation is characterized by five dimensionless parameters:
the viscosity and density ratios (
 ${\it\mu}_{l}/{\it\mu}_{g}$
and
 ${\it\rho}_{l}/{\it\rho}_{g}$
), the liquid Reynolds number
 $Re={\it\rho}_{l}UD/{\it\mu}_{l}$
, the Weber number
 $We={\it\rho}_{l}U^{2}D/{\it\sigma}$
and the Froude number
 $U^{2}/(gD)$
. In our initial simulations we could discern no effect due to
gravity, and thus it was omitted from subsequent simulations. We use the axisymmetric
formulation of the Navier–Stokes equations to exploit the symmetry of the
experimental features studied here. The computational domain is
 $5D\times 10D$
and is discretized with an adaptive mesh up to a maximum number
 $2^{14}$
of grid points along each dimension, corresponding to a minimum
mesh size
 ${\rm\Delta}x=D/3277$
. The mesh is adapted based on four criteria: distance to the
interface, curvature of the interface, vorticity and velocity magnitude.
Figure 3 compares simulation results with the
equivalent experimental profiles obtained by high-speed X-ray imaging. The
experimental profiles were obtained in the same data runs as reported in Zhang
et al. (Reference Zhang, Toole, Fezzaa and Deegan2012a
). Briefly, the fluid was silicone oil with
 $D=0.2~\text{cm}$
,
 ${\it\mu}_{l}=1.3~\text{cP}$
,
 ${\it\rho}_{l}=0.851~\text{g}~\text{cm}^{-3}$
,
 ${\it\sigma}=17.6~\text{dyne}~\text{cm}^{-1}$
and
 $U=156~\text{cm}~\text{s}^{-1}$
, incidence was normal to the pool, the surrounding gas was air, and
the pool depth was 5 cm. The excellent agreement between the experiments and
simulations demonstrates the accuracy with which our simulations capture the
dynamics.
Comparison of X-ray phase contrast images from experiments
(a) with simulation (b) for
 $We=292$
and
 $Re=2042$
at
 $\tilde{t}=tU/D=0.161$
, 0.261, 0.46, 0.811 (left to right). The experimental
configuration and conditions are given in Zhang et al.
(Reference Zhang, Toole, Fezzaa and Deegan2012a
) for the SO3 fluid listed therein; the scale bar corresponds to
0.2 mm. The colours in the simulation indicate the fluid from the drop (red)
and the pool (blue), and the ambient gas (green).

We ran simulations in the parameter range
 $Re\leqslant 5000$
and
 $We\leqslant 900$
with air as the surrounding gas (
 ${\it\mu}_{g}=1.94\times 10^{-2}~\text{cP}$
and
 ${\it\rho}_{g}=1.2\times 10^{-3}~\text{g}~\text{cm}^{-3}$
). We fixed
 ${\it\rho}_{l}/{\it\rho}_{g}=709$
,
 $U=156~\text{cm}~\text{s}^{-1}$
and
 $D=0.2~\text{cm}$
, and varied
 ${\it\mu}_{l}$
and
 ${\it\sigma}$
to select
 $Re$
and
 $We$
. We observed the four distinct behaviours shown in figure 4. At high
 $Re$
where two jets emerge, the simulation results in figure 4(c) show a vortex ring driving
the growth of the roll jet. This vortex ring originates at the corner where the
ejecta and the drop meet, it detaches from the free surface along the downward
direction, travels horizontal below the pool level, and resurfaces to form the roll
jet. Figure 5 illustrates the flow field around
the vortex-shedding event and shows that after the vortex sheds all the fluid
entering the ejecta comes from the pool.
Qualitatively different flows observed in simulations: (a)
vortex separation forming a roll jet without a preceding ejecta (
 $We=100,Re=2500$
); (b) ejecta without vortex shedding
leading to a lamella (
 $We=292,Re=1000$
); (c) ejecta plus vortex separation
leading to separate roll jet (
 $We=292,Re=2042$
); (d) collision of the ejecta with the
drop plus vortex shedding leading to a separate roll jet (
 $We=700,Re=3000$
). The columns correspond to equal times
 $\tilde{t}=0.211$
, 0.311, 0.511 (from left to right) except for (
 $d_{3}$
) which corresponds to
 $\tilde{t}=0.372$
. The colour indicates vorticity, with blue/red
representing counterclockwise/clockwise rotation. The thin yellow line
within the drop indicates the boundary between the fluid from the drop and
the pool.

Irrespective of
 $Re$
, at early times there is always a large patch of vorticity near the
point where the upper side of the jet and the drop meet. The large outward mean flow
hides the fact that this vorticity patch is a vortex attached to the free surface
(see, for example, figure 5). Below some
critical
 $Re$
(see figure 4
b), we observe that the vortex ring remains attached to the
interface at all times, becoming progressively larger but weaker, and eventually
merges with the base of the ejecta to form the lamella. Thus, our simulations show
that the transition from one jet (the lamella) to two jets (an ejecta and a roll jet)
observed in experiments (Zhang et al.
Reference Zhang, Toole, Fezzaa and Deegan2012a
) is dictated by whether the vortex remains attached to the free surface.
At the highest
 $Re$
and
 $We$
in our range of study the ejecta reconnects with the drop surface,
capturing a bubble. This process leads to air entrainment and vortex separation, as
shown in figure 4(d), and is
the same as the ‘bumping’ regime described in Thoraval et al. (Reference Thoraval, Takehara, Etoh, Popinet, Ray, Josserand, Zaleski and Thoroddsen2012). At high
 $Re$
and low
 $We$
we observe vortex shedding and the formation of a lamella but no
ejecta.
Flow field and vorticity at the base of the jet in the laboratory frame
(a,b) and in the reference frame comoving with the point
 $\boldsymbol{T}$
(c,d). (a–c)
Vortex-shedding splash at
 $We=292$
and
 $Re=3000$
for
 $\tilde{t}=0.141$
(a,c) and
 $\tilde{t}=0.236$
(b). Note that in (b)
the liquid entering the jet originates almost exclusively from the pool.
(d) Non-shedding splash at
 $We=292$
and
 $Re=1500$
for
 $\tilde{t}=0.141$
. The flow field of non-shedding splashes at other
parameter values at all times looks similar to (a) in the
laboratory frame or (c or d) in the
comoving frame.

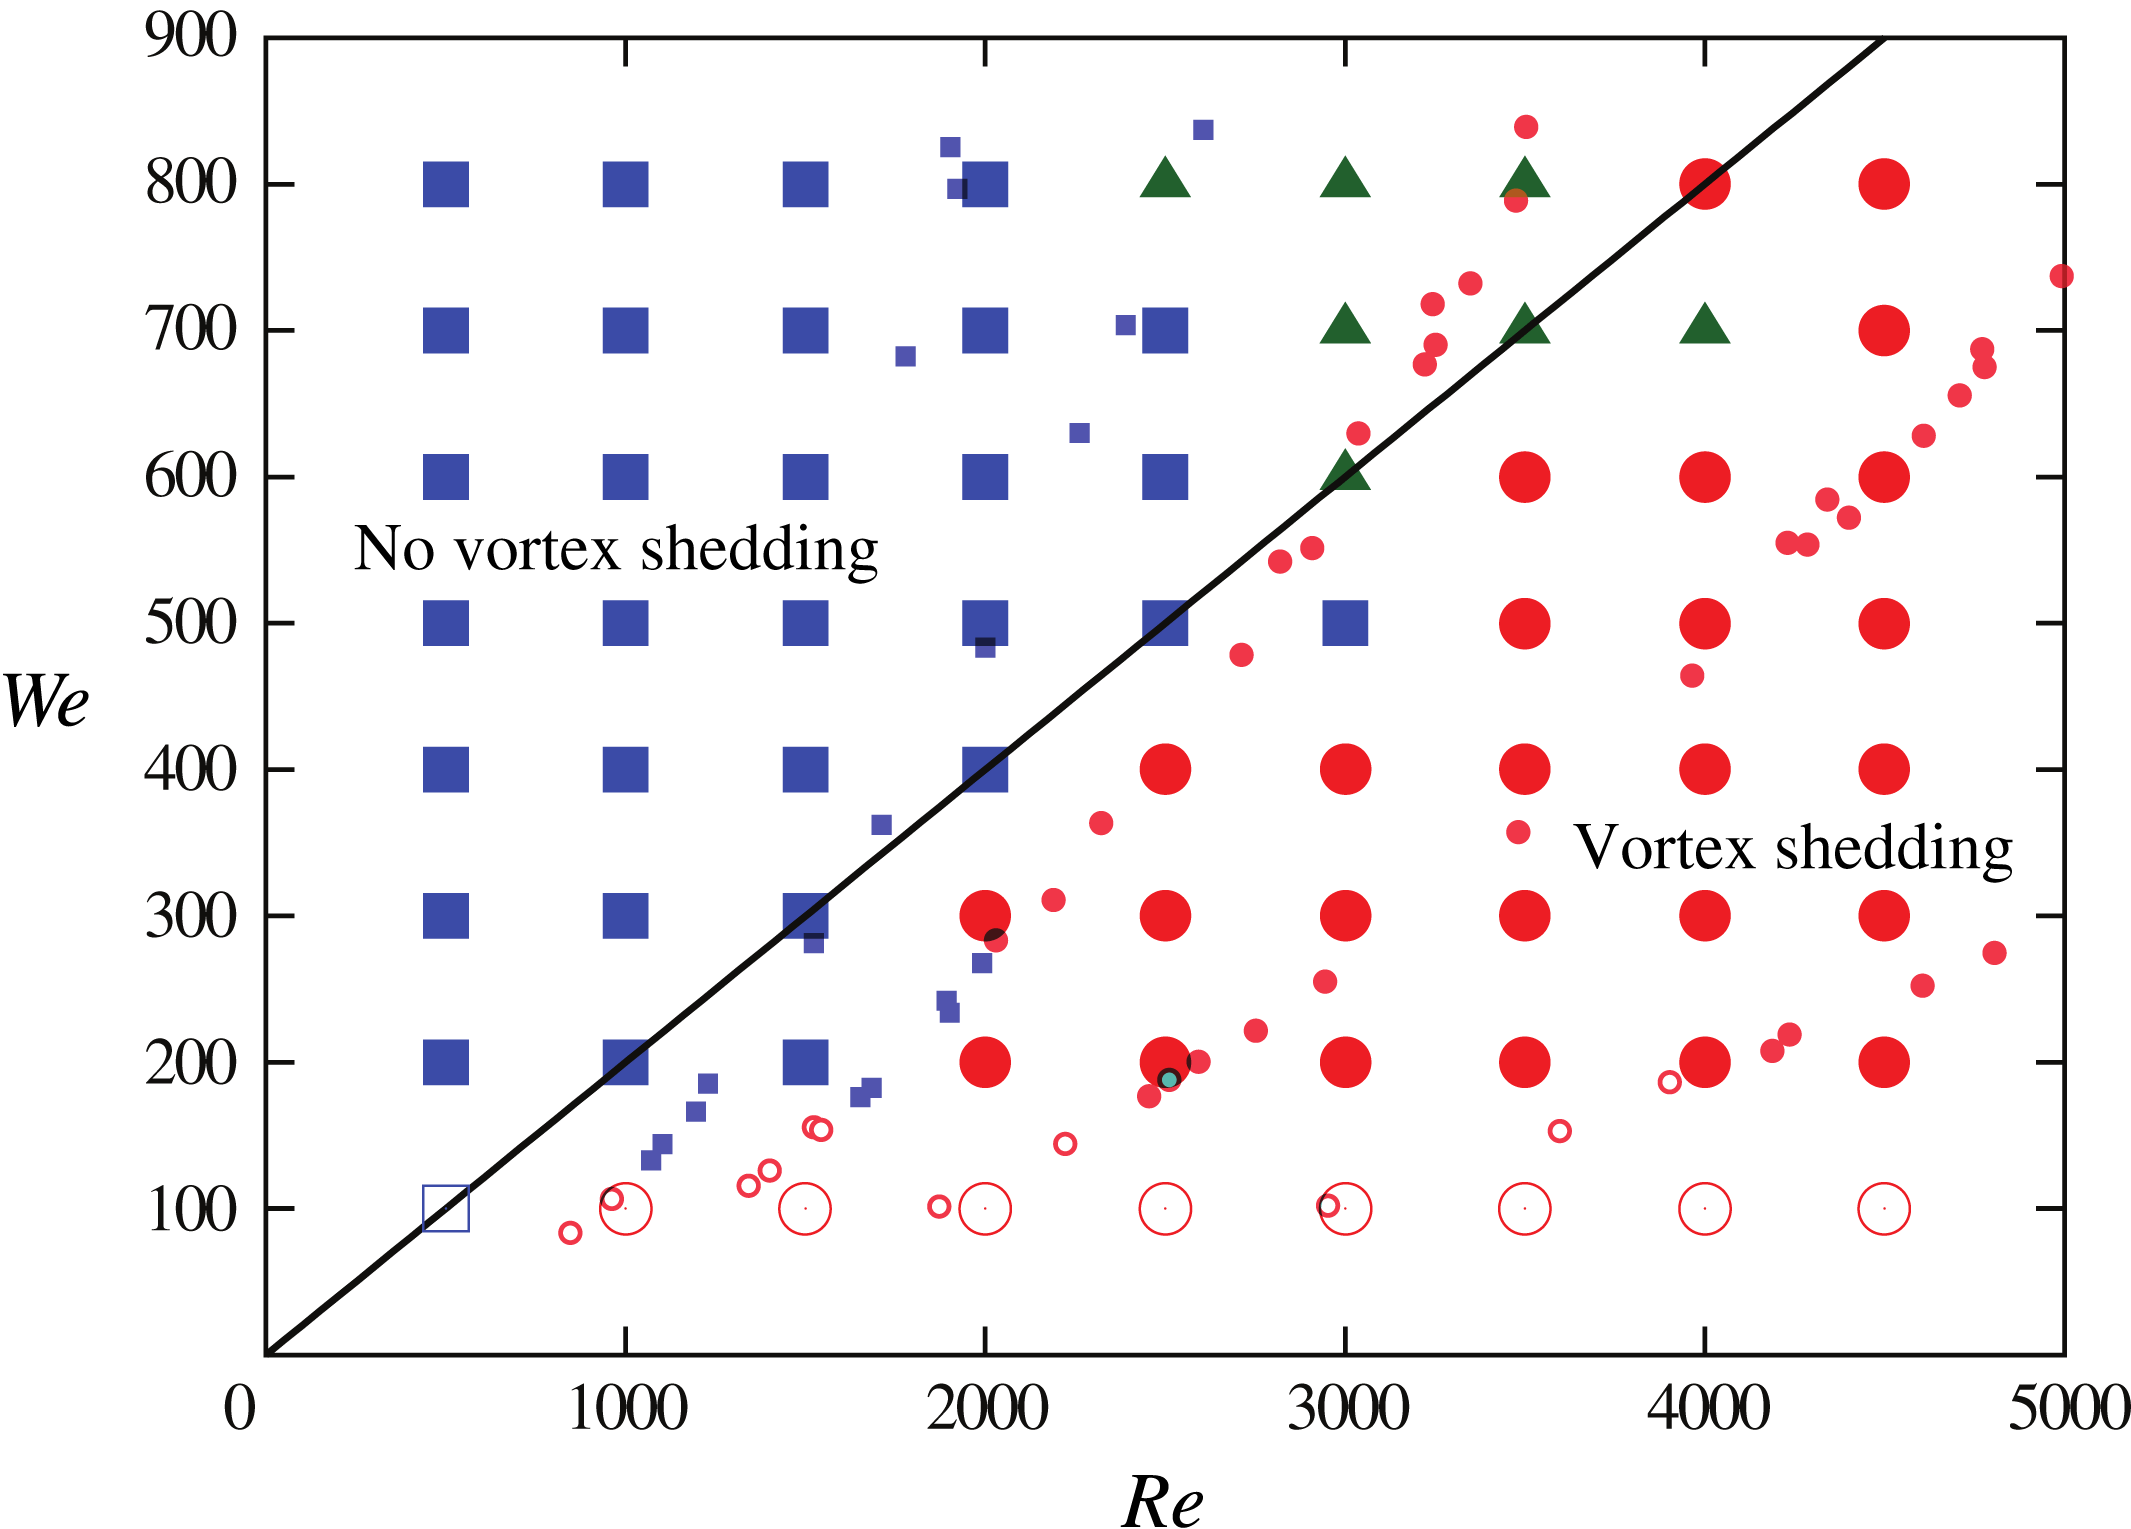
The parametric dependence of the four regimes depicted in figure 4 as found in simulations is given by the phase diagram in
figure 6. Each simulation point in
figure 6 took two weeks of computation on
seven cores using the MPI library combined with dynamic load balancing as described
in Agbaglah et al. (Reference Agbaglah, Delaux, Fuster, Hoepffner, Josserand, Popinet, Ray, Scardovelli and Zaleski2011). For
reference, the equivalent experimental observations from Zhang
et al. (Reference Zhang, Toole, Fezzaa and Deegan2012a
) are also shown. The two datasets show strong agreement. The boundary between
shedding and no shedding is reasonably captured by the relation
 $Re=5We$
, or equivalently
 $Ca\equiv {\it\eta}U/{\it\sigma}=0.2$
.
Phase diagram for vortex shedding. Simulations (shown with large symbols)
that exhibit vortex shedding are represented with circles, no vortex
shedding with squares and bumping with triangles. Filled symbols indicate
the presence of ejecta while open symbols have no ejecta. The experimental
results reported in Zhang et al. (Reference Zhang, Toole, Fezzaa and Deegan2012a
) are plotted with small symbols using the same convention as for the
simulations; the bumping regime was not distinguished in these experiments.
The solid dark line represents the approximate limit of the
vorticity-shedding regime:
 $Ca=0.2$
.
3.3. Characterizing the vortex shedding
In order to investigate the mechanism for vortex shedding, we measured various
characteristics of the flow. Since the shedding event occurs in the vicinity where
the jet emerges from the drop, our measurements focused on this zone and particularly
on
 $\boldsymbol{T}$
, the point within this zone of maximum curvature of the air–liquid
interface (see figure 5
a). We found that there are no simple characteristics that herald a
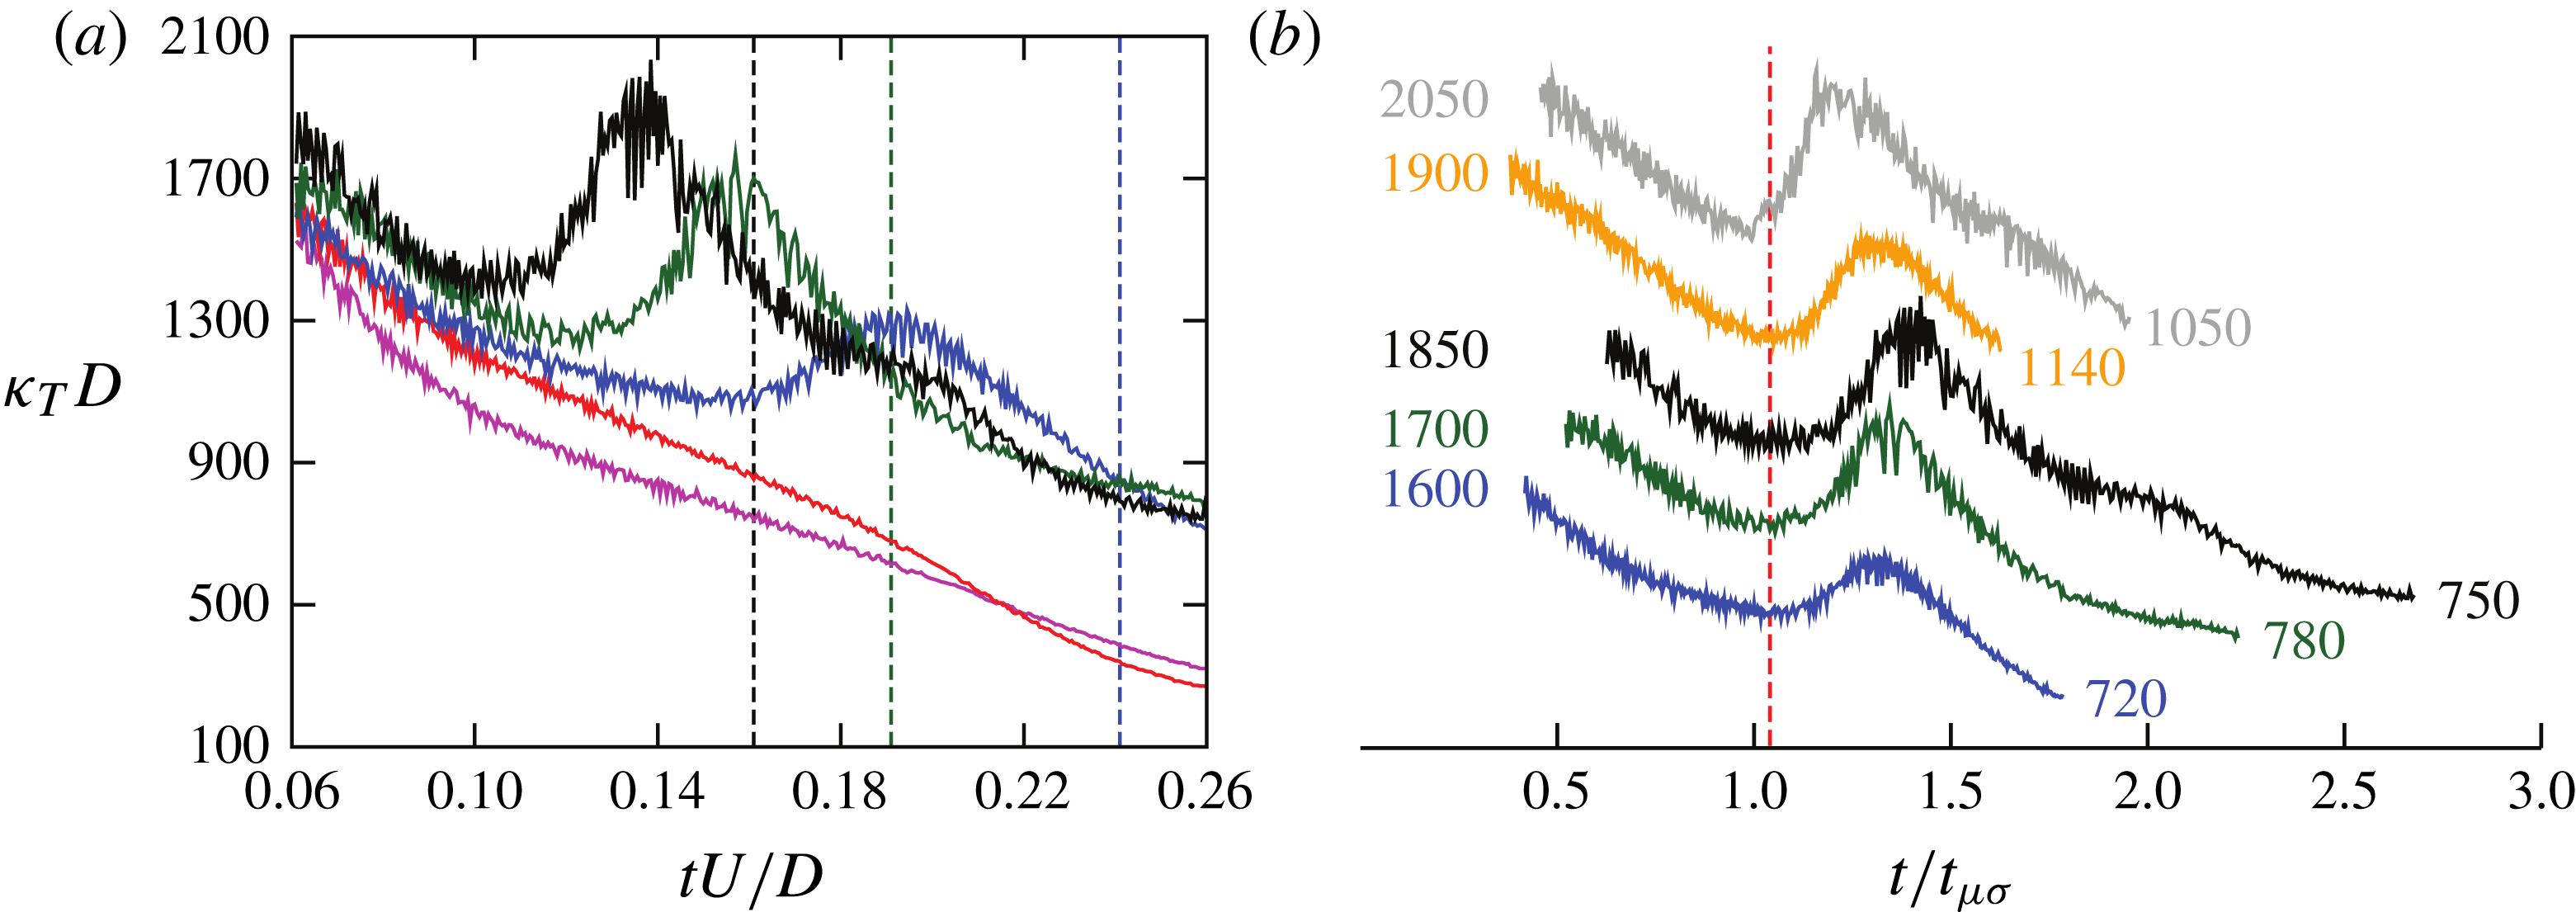
shedding event. For example, as shown in figure 7, the time dependence and magnitude of the curvature
 ${\it\kappa}_{T}$
at
 $\boldsymbol{T}$
right up until the shedding event begins are indistinguishable from
those of the non-shedding cases. In other words, we find no way to predict which
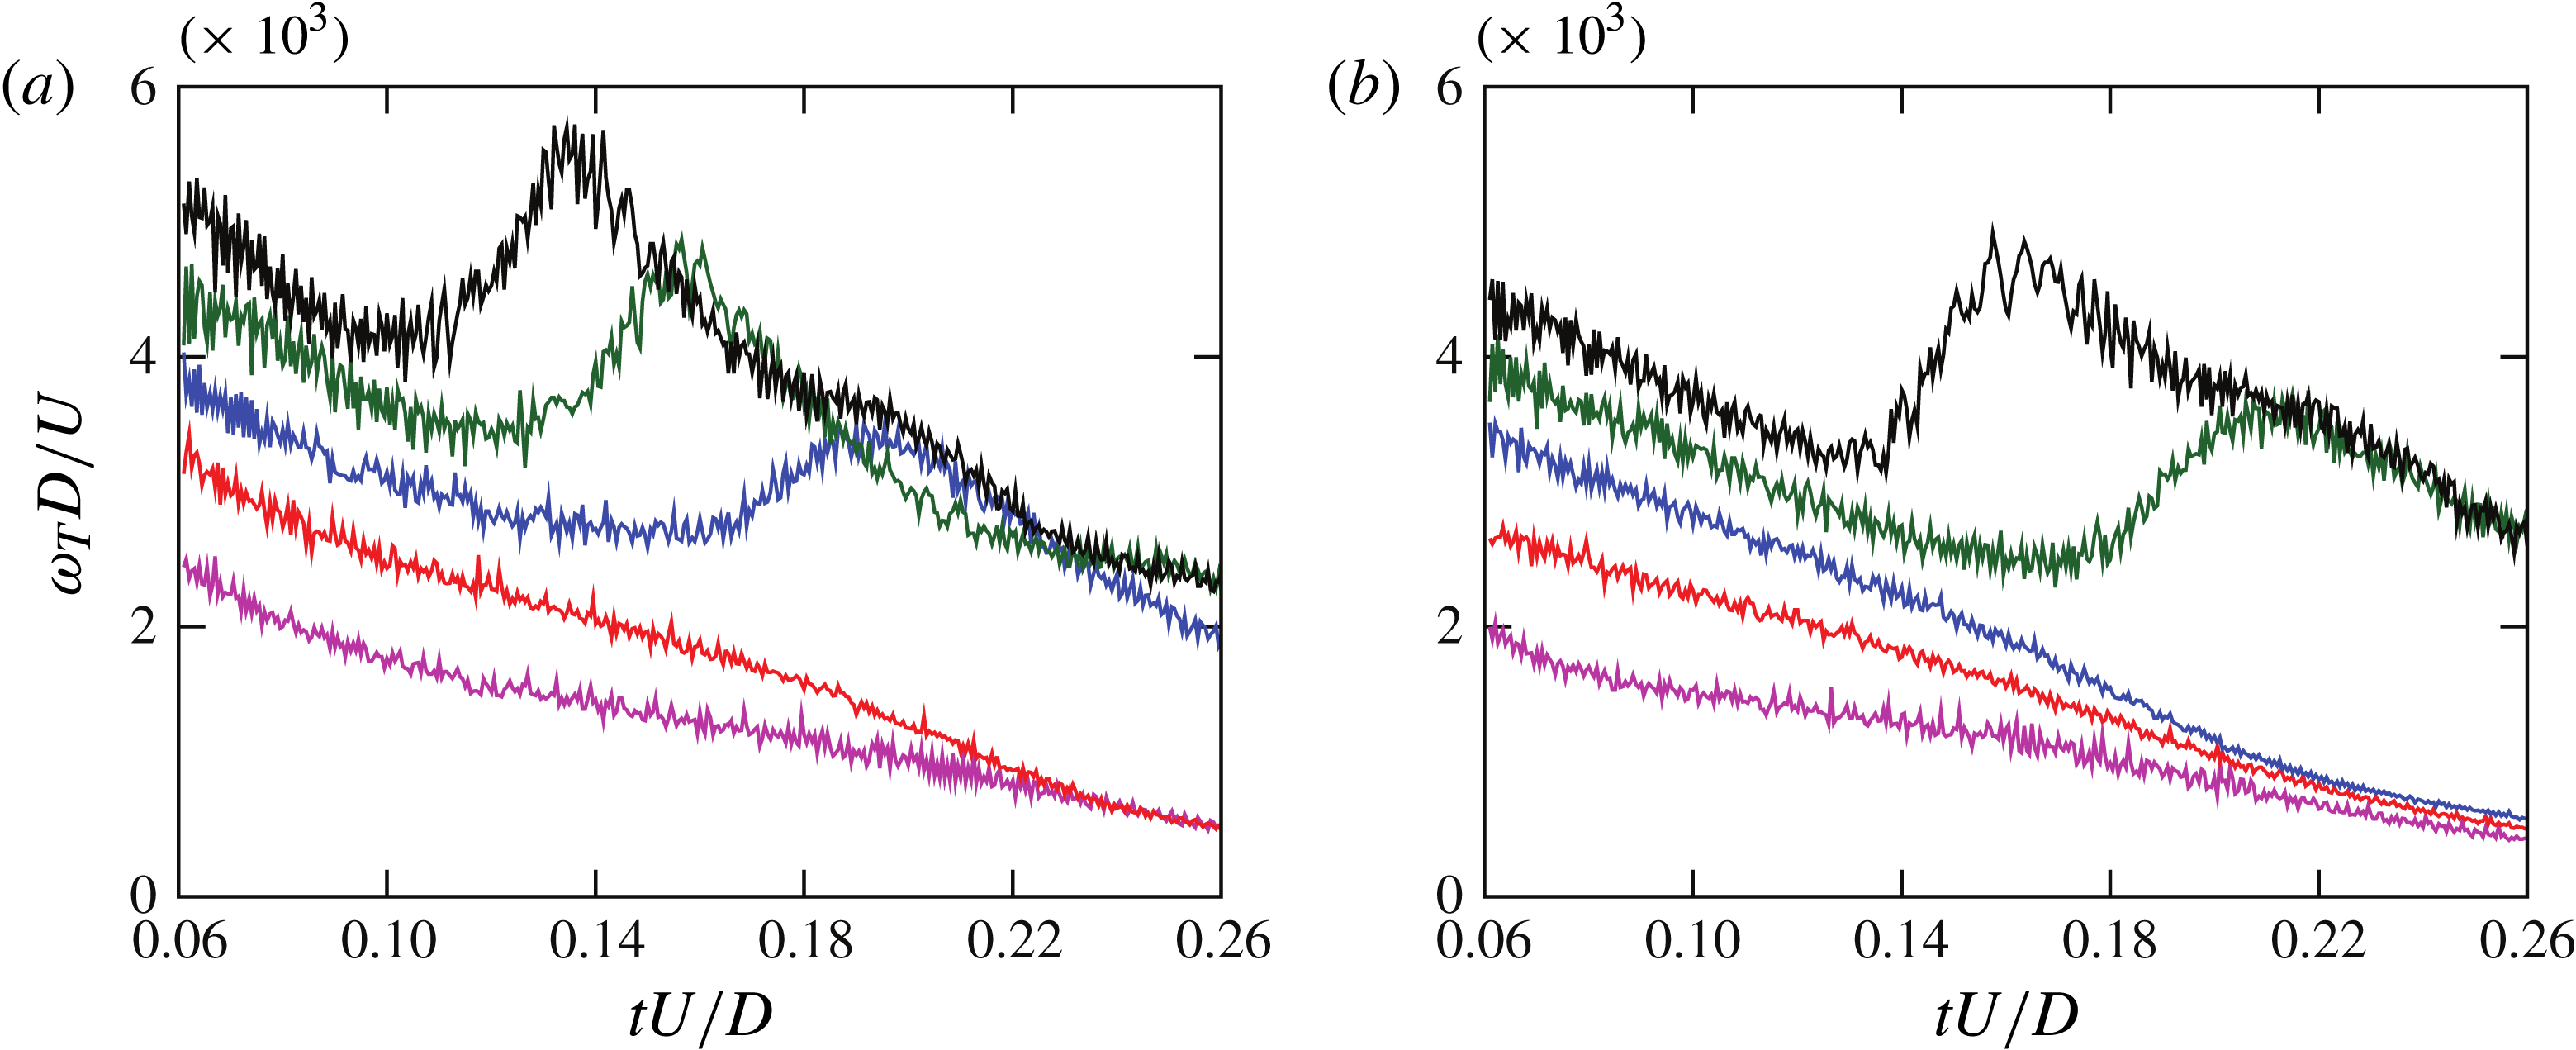
configurations will shed a vortex. The same is true of the vorticity (see
figure 8), the velocity (see the remark in
the caption to figure 5), the local Reynolds
number
 $Re_{L}={\it\rho}_{l}u{\it\kappa}_{T}^{-1}/{\it\mu}_{l}$
(see figure 9
a), where
 $u$
is the maximum speed tangential to the interface around
 $\boldsymbol{T}$
, and the local Weber number
 ${\it\rho}_{l}u^{2}{\it\kappa}_{T}^{-1}/{\it\sigma}$
.
Nonetheless, the initiation of shedding is clearly signalled by the vorticity and the
curvature. Figure 7(b) shows
that a subset of the simulations exhibit a minima in the curvature. All shedding
cases exhibit such a minimum, and the minimum occurs prior to a visually discernible
separation of the vortex. Thus, we take this minimum as a signal that the vortex
separation process has started. Rescaling of the time by the visco-capillary time
 $t_{{\it\mu}{\it\sigma}}={\it\mu}_{l}D/{\it\sigma}$
as in figure 7(b) shows that the initiation of shedding occurs at a
remarkably uniform time
 $t\approx 1.05t_{{\it\mu}{\it\sigma}}$
. These results hint at the importance of the capillary number
 $Ca={\it\mu}_{l}U/{\it\sigma}$
, because
 $t_{{\it\mu}{\it\sigma}}$
in dimensionless units
 $D/U$
is
 $Ca$
. Indeed, the local capillary number
 $Ca_{L}=u{\it\mu}_{l}/{\it\sigma}$
for vortex-shedding splashes is lower at all times than for
non-shedding splashes (see figure 9
b). Moreover, taking the time averaging threshold value of
 $Ca$
indicated in figure 9(b) yields a value of 0.2. Plotting this value on the
phase diagram (figure 6) fairly accurately
captures the transition. Therefore, our data indicate that an understanding of the
interplay between viscous and capillary forces in the vicinity of
 $\boldsymbol{T}$
is the most important ingredient for understanding the transition
between one and two jets.
(a) Mean curvature at
 $\boldsymbol{T}$
versus time for
 $We=300$
and
 $Re=1000$
(magenta), 1500 (red), 2000 (blue), 2500 (dark green) and
3000 (black). The vertical dashed lines indicate the time of the vortex
separation chosen by eye when the material line defined by the pool–drop
interface exhibits strong swirling such as in figure 4(
 $c_{2}$
). The peak in the data indicates vortex shedding;
conversely, its absence indicates that the vortex remains attached to the
interface. (b) Mean curvature at
 $\boldsymbol{T}$
with time in units of the visco-capillary time (
 $t_{{\it\mu}{\it\sigma}}={\it\mu}_{l}D/{\it\sigma}$
) for
 $We=300$
and
 $Re=2000$
(blue), 2500 (dark green), 3000 (black);
 $We=400$
and
 $Re=2500$
(orange), 3000 (dark grey). The curves have been
vertically shifted in order to avoid overlapping and clearly show the
positions of the minima; their starting and ending values are listed with
the same colour as the data.
4. Discussion and conclusion
We used experiments and numerical simulations to observe the transition from one jet to
two jets in splashing from impact of a drop on a deep pool of the same liquid as a
function of
 $Re$
and
 $We$
. We found that the mechanism driving this transition is the separation
of a ring vortex from the air–liquid interface where the first jet emerges from the
drop. The separated vortex eventually resurfaces and forms a second jet. The character
of this second jet is quite distinct from that of the first jet. The first jet is formed
through collision: two bodies of fluid collide and their linear momentum is focused into
an outward-bound stream. In contrast, the second jet emerges tightly wound, uncoiling as
it evolves, whipping the fluid at its tip outward.
In our experiments we focused on a deep pool because a shallower pool introduces another
parameter, the depth, and the additional complexity that entails (Yarin & Weiss
Reference Yarin and Weiss1995; Cossali, Coghe & Marengo Reference Cossali, Coghe and Marengo1997; Wang & Chen Reference Wang and Chen2000; Rioboo et al.
Reference Rioboo, Bauthier, Conti, Voue and De Coninck2003). Nonetheless, the limited depth-wise
penetration of the flow observed in simulations (see figure 4) suggests that depths as shallow as
 $D$
are sufficient for the manifestation of two jets. The observation of
vortex shedding at the pool–drop interface (Castrejón-Pita, Castrejón-Pita &
Hutchings Reference Castrejón-Pita, Castrejón-Pita and Hutchings2012) for
 $\tilde{t}<1$
and in shallower pool depths (Thoraval et al.
Reference Thoraval, Takehara, Etoh and Thoroddsen2013) suggests that similar phenomena may occur
in yet shallower depths at high
 $Re$
.
Our simulations show that the transition is best characterized by the capillary number.
Nonetheless, the separation process sufficiently resembles separation from a free
surface observed in other configurations to warrant investigation of whether the
criteria established in these other flows can be usefully applied to splashing.
Batchelor (Reference Batchelor1967) argues on general grounds that
separation can only occur at large curvatures. This qualitative statement was examined
recently by Moore et al. (Reference Moore, Ockendon, Ockendon and Oliver2014),
who looked at the high-
 $Re$
perturbations to steady two-dimension Helmholtz flows relevant for the
flow in the jet root of Wagner’s theory for droplet impact (Howison
et al.
Reference Howison, Ockendon, Oliver, Purvis and Smith2005). They showed in this situation that vortex
shedding is possible only if the
 $Re_{L}$
is of order unity. This is consistent with figure 9(a), although unsteady effects could play a role
here. Figure 7 shows that the curvatures of
shedding and non-shedding splashes are comparable, and furthermore the curvature at the
instant of shedding is always lower than the values at early times in non-shedding
splashes. Hence, the curvature by itself cannot be the sole criterion for shedding.
Leal (Reference Leal1989) investigated separation from a bubble
and found that separation occurs when the surface vorticity reaches a critical value and
 $Re$
is large. As with the curvature, we observe higher surface vorticities
in non-shedding splashes than we do at the instant of separation in shedding splashes.
Hence, surface vorticity is not a good criterion for vortex shedding in drop impact.
Finally, we note that the flow at
 $\boldsymbol{T}$
resembles the classic problem of a jet plunging into a pool. In the
latter, the jet drags the interface downward and for sufficiently fast flows can cause
opposing sides of the interface to meet, pinch off and entrain bubbles. The transition
to air entrainment is known to be governed by the local capillary number at low
viscosities (Kiger & Duncan Reference Kiger and Duncan2012). The
similar kinematics and the same dependence on the capillary number suggest that the
physics of the plunging jet may be fruitfully applied to the jet problem considered
here.
Maximum absolute value of the vorticity
 ${\it\omega}_{T}$
on the interface near
 $\boldsymbol{T}$
(equivalent to the deepest blue in figure 5) for (a)
 $We=300$
and (b)
 $We=400$
at
 $Re=1000$
(magenta), 1500 (red), 2000 (blue), 2500 (green), 3000
(black).
(a) Local Reynolds number
 $Re_{L}$
and (b) local capillary number
 $Ca_{L}$
around
 $\boldsymbol{T}$
for
 $We=300$
(solid) and
 $We=400$
(dashed), and
 $Re=1000$
(magenta), 1500 (red), 2000 (blue), 2500 (dark green) and
3000 (black).

Acknowledgements
The authors thank the James S. McDonnell Foundation for support through a 21st Century Science Initiative in Studying Complex Systems Research Award, S. Weiss and J. Soundar Jerome for valuable discussions, and Claudio Falcón for assistance with the experiments.
Supplementary movies
Supplementary movies are available at http://dx.doi.org/10.1017/jfm.2014.723.



