Introduction
Prostate cancer is the most common in males. Reference Riou, de la Mothe and Azria1 Radiotherapy is the commonly used treatment modality. Intensity-modulated radiotherapy (IMRT) is superior technique than 3D conformal radiotherapy due to its ability to generate non-homogenous dose flounce according to geometry of target volume. Since IMRT delivers the dose in fixed gantry positions with fixed dose rate, volumetric arc therapy (VMAT) is superior to IMRT because it can deliver the precise dose to target using the enhanced parameters such as gantry speed, variable dose rate and variable multi-leaf collimator position. Reference Gao, Li and Ning2,Reference Gautam3 VMAT offers similar or better organ at risk sparing compared to IMRT in less time and using less number of monitoring units. Reference Mellon, Javedan and Strom4
Simultaneous integrated boost (SIB) is a way to deliver selective doses to different planning tumour volume (PTV) in a single plan. Reference Franzese, Fogliata and D’Agostino5–Reference Ishii, Ogino and Hosokawa7 This can be achieved using IMRT or VMAT. Reference Daoud, Saleh and Elsherbini8 SIB can be delivered to prostate patients without increasing the risk of acute toxicity. Reference Onal, Sonmez and Erbay9
The standard seven gantry angles for prostate IMRT planning technique are 30, 60, 105, 180, 255, 300 and 330. The standard VMAT plan for prostate uses one or two full arc rotations around the patient while the beam is on. Reference Mellon, Javedan and Strom4
VMAT offers superior dose homogeneity index (HI), dose gradient index (GI) as compared to IMRT. Reference Daoud, Saleh and Elsherbini8 A better GI shows sharp dose fall near normal tissue which indicates better Organ at risk (OAR) sparing. Although VMAT offers better dosimetric results Reference Johnson, Osei and Fleck10 but there is no final conclusion. There is much variation in results as it depends upon institutional workflow and practice. Reference Johnson, Osei and Fleck10
Bhoj Gotam has compared several research works in an article Reference Gautam3 about IMRT and VMAT techniques for prostate cancer patients. Tsai et al. Reference Tsai, Wu and Chao11 showed that the results of IMRT and VMAT were comparable with VMAT having little dosimetric advantage over IMRT. Zhang et al. Reference Zhang, Happersett and Hunt12 has described that dose-delivery time is reduced by up to 50–55% in VMAT as compared to IMRT. Ost et al. Reference Ost, Speleers and De Meerleer13 showed that rectum dose is less in VMAT plan. Yoo et al. Reference Yoo, Wu and Lee14 concluded after comparison of ten patient plans that IMRT offers better OAR sparing as compared to VMAT. Wolff et al. Reference Wolff, Stieler and Welzel15 showed that mean rectum dose was less in IMRT plans. The variation in results depends upon certain factors like treatment planning system data, plan optimisation parameters, techniques and heterogeneous structures like femoral heads in beam path and heterogeneity corrections applied in dose calculation algorithm which varies from institute to institute. Reference Gautam3 The variation in IMRT and VMAT results in different studies also depends upon linear accelerator commissioning data and linear accelerator model used in the study. Reference Gautam3 Onal et al. Reference Onal, Sonmez and Erbay9 declared that PTV homogeneity was better in IMRT than VMAT for all the PTV dose energy levels.
The purpose of this study is to have an institutional-based retrospective review between two planning techniques in terms of plan evaluation parameters and efficient dose delivery and also this work has been intended to provide methods to develop alternative tool to enhance the quality of the treatment plans.
Material and Method
Fifteen high-risk prostate patients were selected randomly who were treated with SIB–VMAT plans during 2018–19. Sixteen slice CT scanner (Model: Aquilion LB Toshiba Medical Systems) was used to scan the patients with scan slice thickness of 3 mm. For bladder and rectum, standard institutional protocols were followed which were empty rectum and comfortably full bladder. All patients were scanned in supine position with Vac-lock being used as immobilisation device.
PTV 48, PTV 57.6 and PTV 60 were delineated, and margins were assigned according to CHIP trial protocols. Reference David, Syndikus and Mossop16 Bladder, rectum, femoral heads and small bowel were contoured as organs at risk.
Total prescribed dose was 60 Gy in 20 fractions. It is biologically equivalent to 74 Gy in 33 fractions according to alpha beta ratio 3. Reference Lee17,Reference Myrehaug, Chan and Craig18
PTV contouring
PTV 48, PTV 57.6 and PTV 60 were contoured according to Conventional or hypo-fractionated high dose intensity modulated radiotherapy for prostate cancer (CHHiP) trial guidelines. Reference David, Syndikus and Mossop16
Treatment planning
IMRT and VMAT plans were optimised using newly developed photon optimiser (PO). The exact IGRT couch top medium was incorporated in the dose calculation grid. Dose calculations were done using anisotropic analytic algorithm (AAA) on ARIA Version 15.6. SIB plans were optimised to deliver the dose 60Gy in 20 fractions which is according to linear quadratic model (ELQ) is equivalent to 74 Gy in 37 fractions in conventional method.
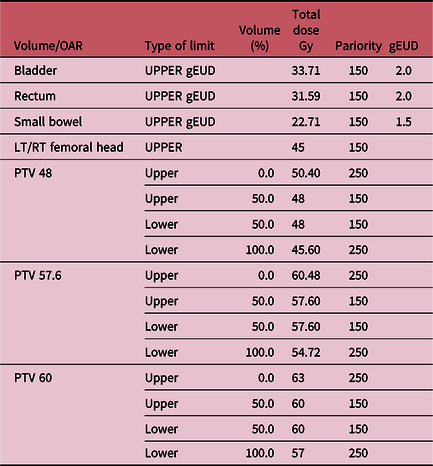
VMAT and IMRT plans for prostate were created using Varian Eclipse ARIA version 15.6 (Varian Medical Systems, Palo Alto, CA, USA). Dose constraints were applied for both IMRT and VMAT plans according to Table 1.
Optimisation objectives
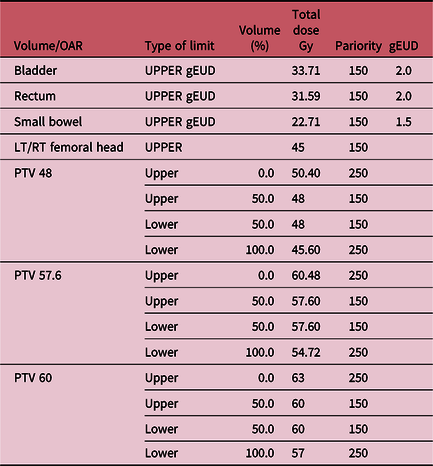
Abbreviation: LT/RT, left and right.
Structures and objective parameters used for VMAT and IMRT plan optimisation
A relatively new feature has been introduced in the latest version of ARIA treatment planning system version 15.6 known as generalised equivalent uniform dose (gEUD) which has been applied as upper dose constraint to bladder, rectum and small bowel. All the plans were made using the beam data of Varian Linear Accelerator Clinac-DHX.
IMRT plans were created using seven gantry angles 0, 30, 60, 105, 180, 255, 300 and 330. Diffident angles can also be used as described in other literature, for example, Sale et al. Reference Sale and Moloney19 suggested gantry angles 0, 75, 105,135, 225 and 270. But, there is no final agreement on the IMRT gantry angles and number of fields. Reference David, Syndikus and Mossop16,Reference Sale and Moloney19,Reference Pasler, Georg and Wirtz20 We followed our institutional practice for IMRT gantry angles and number of fields. VMAT plans were made using single full arc 179–181 or two full arcs as some studies suggested using two full arcs spare OAR in better way. Reference Gautam3 All VMAT plans were made using default collimator angles automatically adjusted by ARIA arc geometry tool feature. All the plans were made to be run on Varian’s Clinac DHX linear accelerator.
Photons of 6 MV were used for creating all the plans. Using high energy has in general no greater benefit in case of IMRT or VMAT. Reference Onal, Sonmez and Erbay9,Reference Pasler, Georg and Wirtz20,Reference Jo, Kim and Baek21 Eclipse treatment planning system 15.6.04 has been used for IMRT and VMAT optimisation and dose calculation.
HI was calculated according to the following formula Reference Yoon, Park and Shin22
 $${\rm{HI}} = {{\rm{D}}_{\rm{5}}}{\rm{/}}{{\rm{D}}_{{\rm{95}}}}$$
where D5 and D95 are the doses received by 5 and 95% of the PTV volume, respectively. Smaller and value closer to 1 indicates a homogenous PTV coverage.
Conformity index (CI) was calculated according to the following formula Reference Chow, Jiang and Kiciak23
 $${\rm{CI}} = {\rm{PT}}{{\rm{V}}_{{\rm{95\% P}}{\rm{.D}}}}{\rm{/}}{{\rm{V}}_{{\rm{PTV}}}}$$
It is defined as volume of PTV receiving 95% of prescribed dose divided by total volume of PTV.
GI has been calculated as
 $${\rm{GI}}=\hskip -1pt{{\rm{V}}_{50\% }}{\rm{/}}{{\rm{V}}_{100\% }}$$
V50% and V100% are simply the isodose volumes of 50 and 100% of the prescribed dose. Reference Chow, Jiang and Kiciak23–Reference Paddick and Lippitz25
CI closer to 1 indicates conformal dose to the target volume while GI closer to 1 shows a faster dose fall off and better OAR sparing. Reference Maraghechi, Davis and Badu26
Dose verification and quality assurance
Each plan was evaluated for quality assurance using electronic portal imaging device (EPID), and DTA setting was 3 mm 3% dose–distance criteria to make sure the reproducibility of the plan. Reference Schreibmann, Dhabaan and Elder27–Reference Xu, Kang and Jiang29
Statistical analysis
All the statistical analyses were done using MS EXCEL 2013 (Microsoft Corporations). Statistical analysis of the collected data includes the average values of all the plan evaluation parameters that were collected for individual patient from the dose volume histogram (DVH).
Results
The mean PTV 44, 57.6 and 60 volumes were 225.22 cm3 (range: 178.8–275.5 cm3), 199.50 cm3 (range: 147.5–260 cm3) and 116.74 cm3 (range: 79.3–152.5 cm3), respectively.
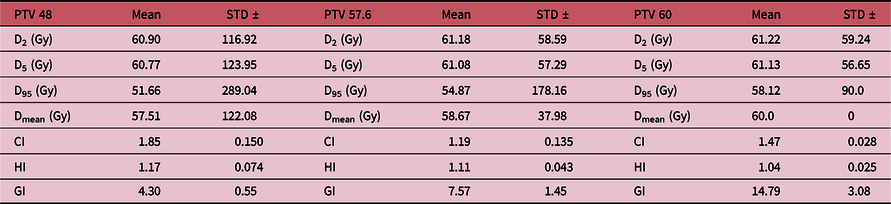
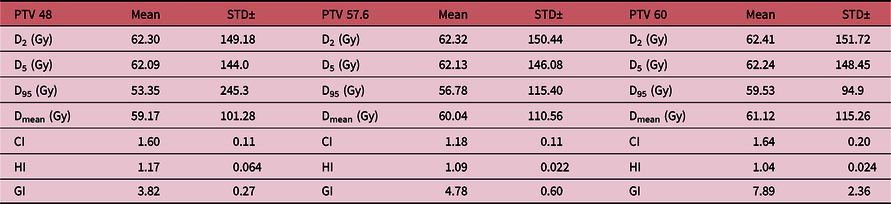
The plan evaluation parameters are described in Tables 2 and 3.
IMRT pkan evaluation parameters

VMAT plan evaluation parameters

All the plan evaluation parameters represent the mean values.
Since there were three dose levels (48, 57.6 and 60 Gy), so plan quality parameters D2, D5, D95, Dmean, HI, CI and dose GI were calculated for each individual dose level as shown in Tables 2 and 3 for IMRT and VMAT plans.
As described by Xu et al. Reference Xu, Kang and Jiang29 and definition from Paddick. Reference Paddick and Lippitz25 CI shows the portion of contoured PTV covered by 95% of isodose line. CI should be between 0 and 1.
HI is the ratio between maximum and minimum dose of PTV and its value should be closer to 1. Lower value of HI indicates better PTV homogeneity. Reference Xu, Kang and Jiang29,Reference Quan, Li and Li30
Dose GI describes the dose fall off near the organs at risk. Lower value indicates better dose fall off. All these plan evaluation parameters have been calculated to compare the IMRT and VMAT plans as shown in Tables 1 and 2.
Dose constraints to organ at risk were applied to organ at risk as given in CHHiP trial protocol. Reference David, Syndikus and Mossop16
For PTV 1 (48 Gy), D2(Gy) was higher in VMAT (mean 60.90 vs. 62.30), similarly values of D5 and D95 were higher in VMAT as compared to IMRT as shown in Tables 2 and 3. Dmean was also higher in VMAT (mean 57.51 vs. 59.17 Gy).
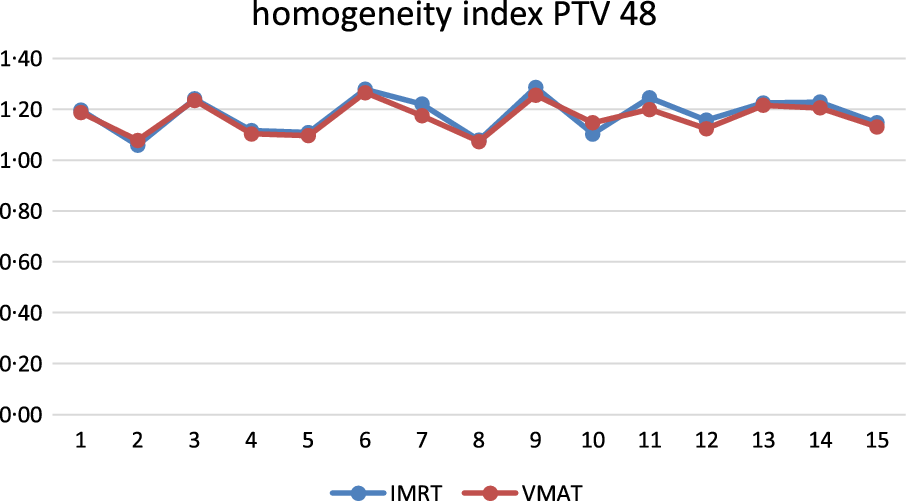
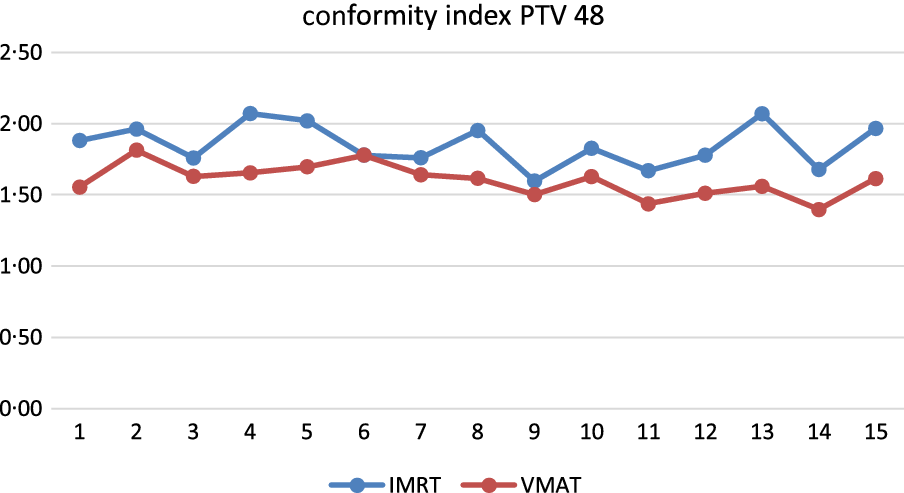
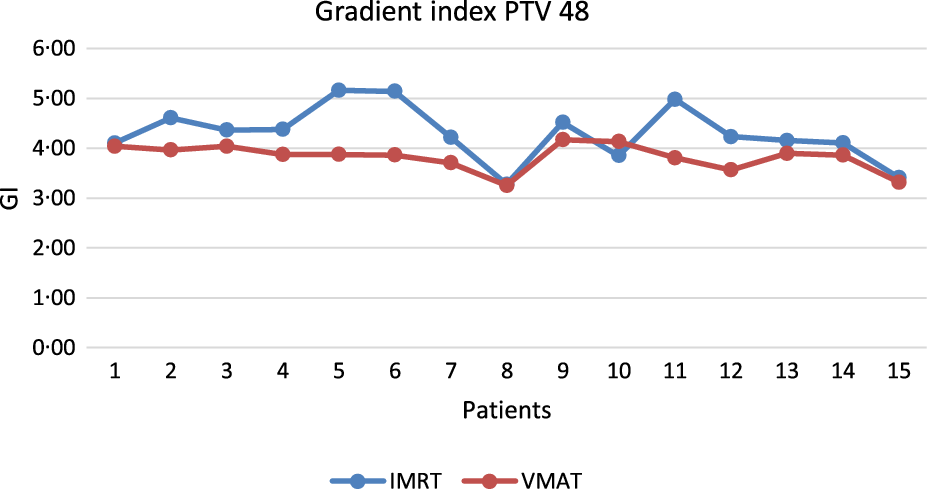
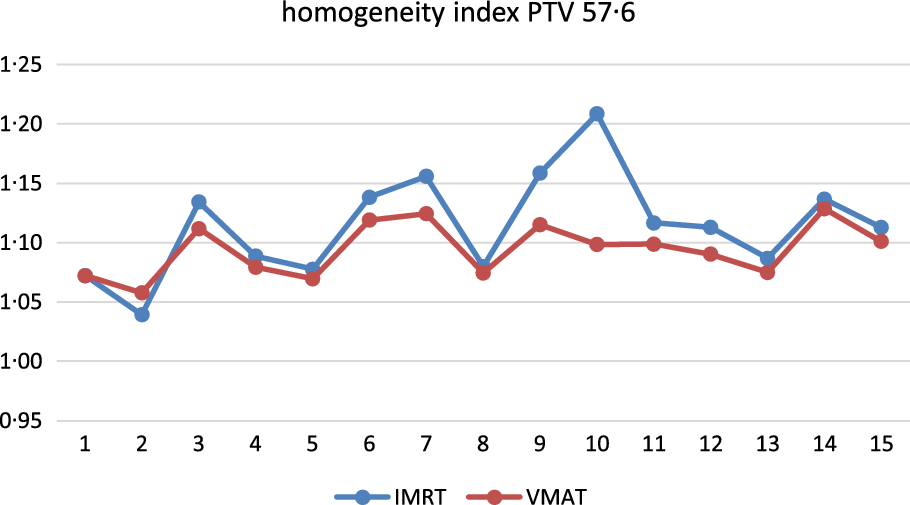
Mean value of HI was same for both techniques (1.17). CI was lower and thus better in VMAT than IMRT (mean 1.85 vs. 1.60). GI was also better in VMAT as compared to IMRT (3.82 vs. 4.89). A trend of HI, CI and GI has been shown in Figures 1–3 for all 15 patients.
Homogeneity index for PTV 48 Gy.

Conformity index for PTV 48 Gy.

Dose gradient index for PTV 48 Gy.

For PTV 2 (57.6 Gy), similar behaviour has been observed where D2, D5, D95 and Dmean were slightly higher in VMAT plans as compared to IMRT as shown in Table 4.
OAR dose comparison between IMRT and VMAT

Abbreviation: LT, left; RT, right.
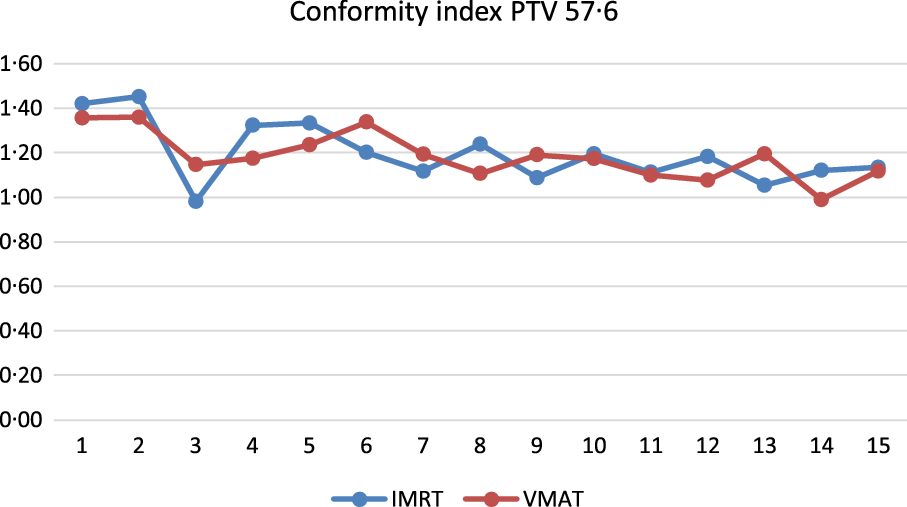
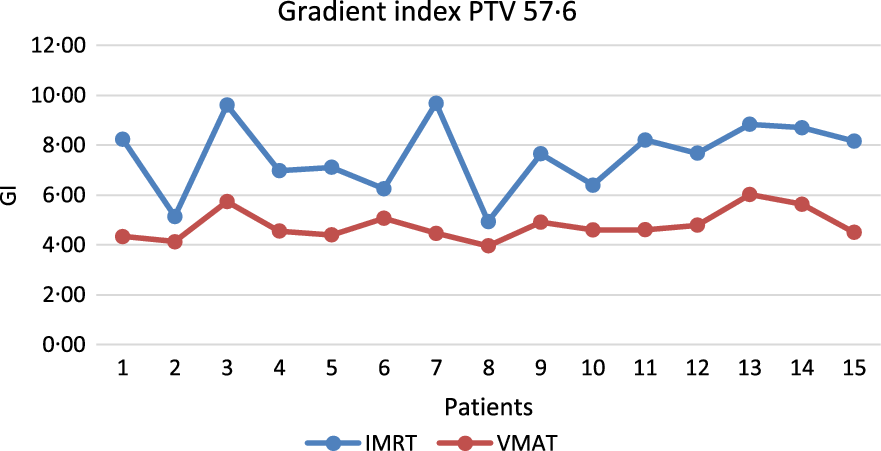
Mean values of CI, HI and GI were lower and thus better in VMAT as compared to IMRT. (1.19, 1.11, 4.78 vs 1.18, 1.09, 7.56) (Figures 4–6).
Homogeneity index for PTV 57.6 Gy.

Conformity index for PTV 57.6 Gy.

Dose gradient index for PTV 57.6 Gy.

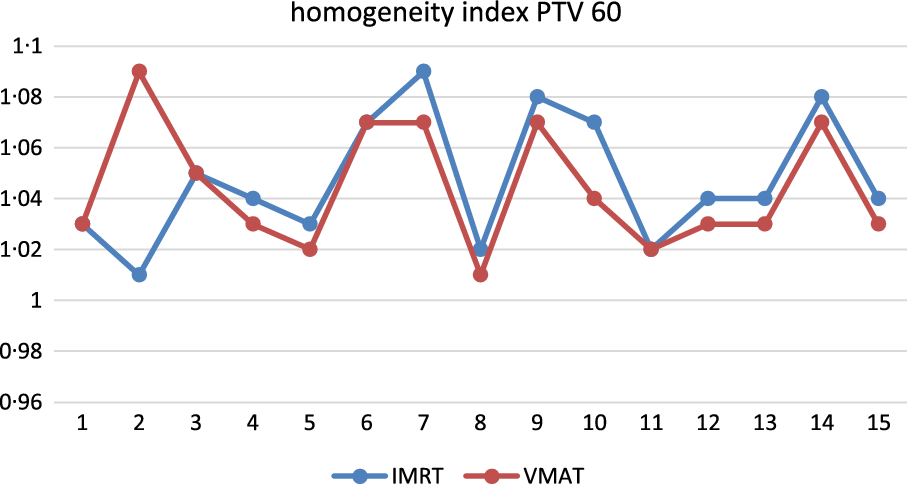
For PTV 3 (60 Gy), D2, D5, D95 and Dmean were slightly higher in case of VMAT. (61.22, 61.13, 58.12, 60.0 vs. 62.41, 62.24, 59.53, 61.12 Gy, respectively).
In terms of CI, IMRT was slightly better than VMAT (1.47 vs. 1.64). HI was same for both techniques (1.04) while GI was much better in VMAT as compared to IMRT (7.89 vs. 14.79) (Figures 7–9). A lower value of GI indicates sharper dose fall off near OAR. Reference Tsai, Wu and Chao11
Homogeneity index for PTV 60 Gy.

Conformity index for PTV 60 Gy.

Dose gradient index PTV 60 Gy.

It is interesting to note that for higher dose PTV that is PTV 60, dose GI is much better in VMAT.
Organs at risk
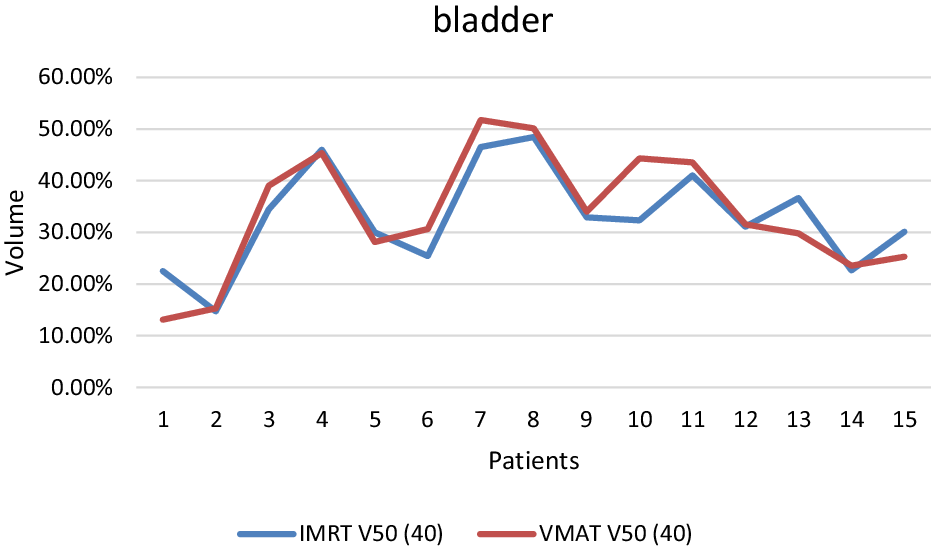
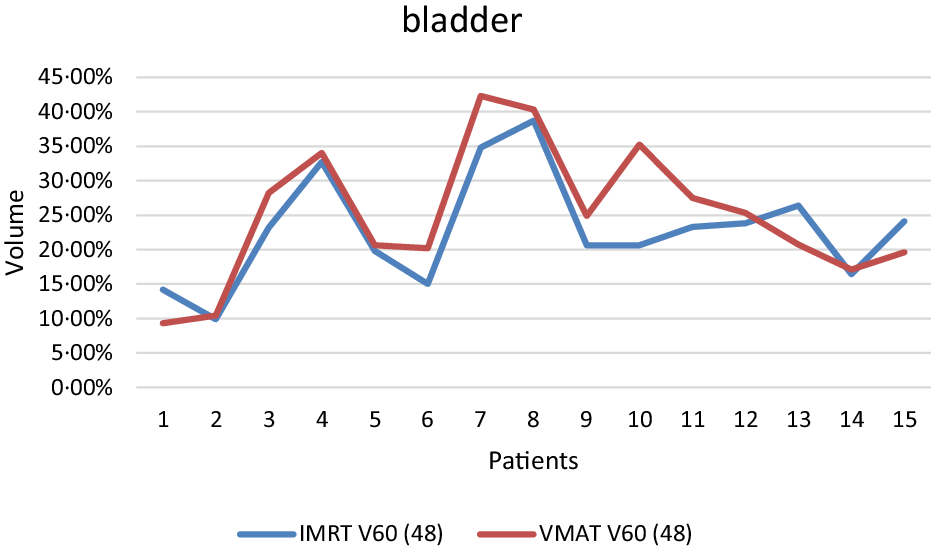
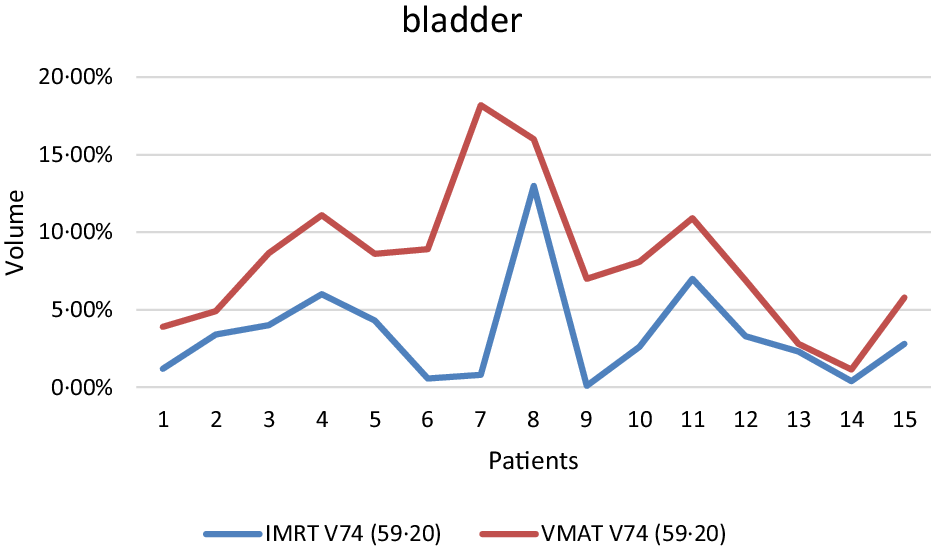
In terms of OARs, the dose constraint objectives were easily achieved. For bladder, V40 < 50% was achieved for all patients as shown in Figure 10. There were few exceptions in some patients, for example, as shown in Figure 11, the objective V48 < 25% could not be met for all cases. Similarly, V59.20 < 5% could not be met in all cases as shown in Figure 12.
Bladder V40 Gy IMRT versus VMAT.

Bladder V48Gy IMRT versus VMAT.

Bladder V59.20 Gy IMRT versus VMAT.

IMRT and VMAT showed a mixed conflicting behaviour in terms of which technique is superior for OAR sparing as Tsai et al. Reference Tsai, Wu and Chao11 had described that IMRT and VMAT showed comparable results with VMAT slightly better than IMRT in some cases.
Figures 10–12 are showing the comparison of volume of bladder receiving 40, 48 and 59.20 Gy for IMRT and VMAT.
According to CHHiP trial guidelines for OAR doses, Reference David, Syndikus and Mossop16 the volume of bladder receiving 40, 48 and 59.20 Gy (if prescribed dose is 60 Gy in 20 fractions) should be less than 50, 25 and 5%, respectively. In case of 59.20 Gy, IMRT is showing better results compared to VMAT as shown in Figure 13.
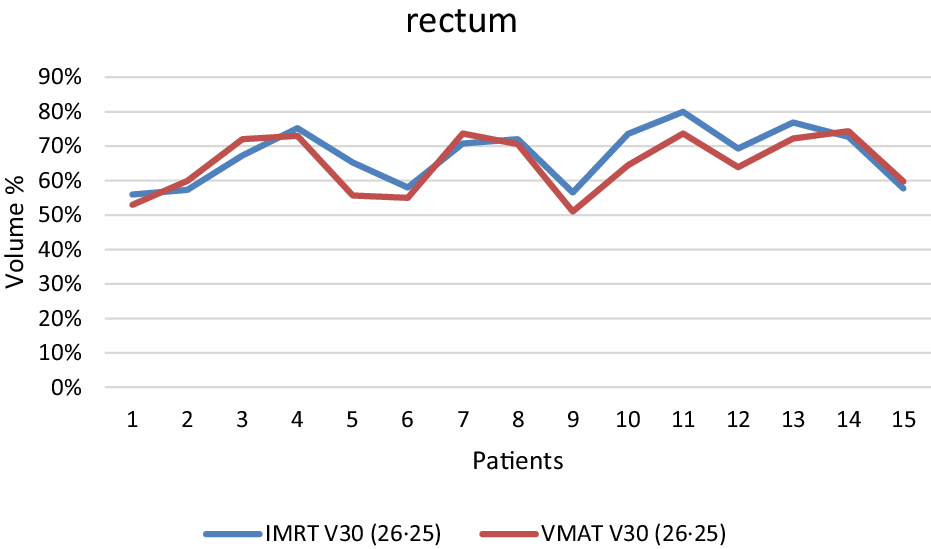
Rectum V26.25 Gy IMRT versus VMAT.

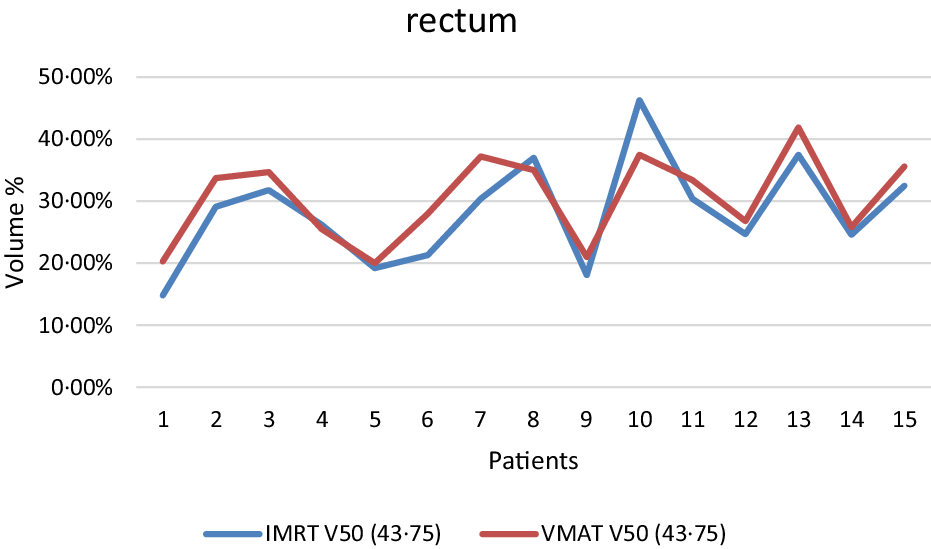
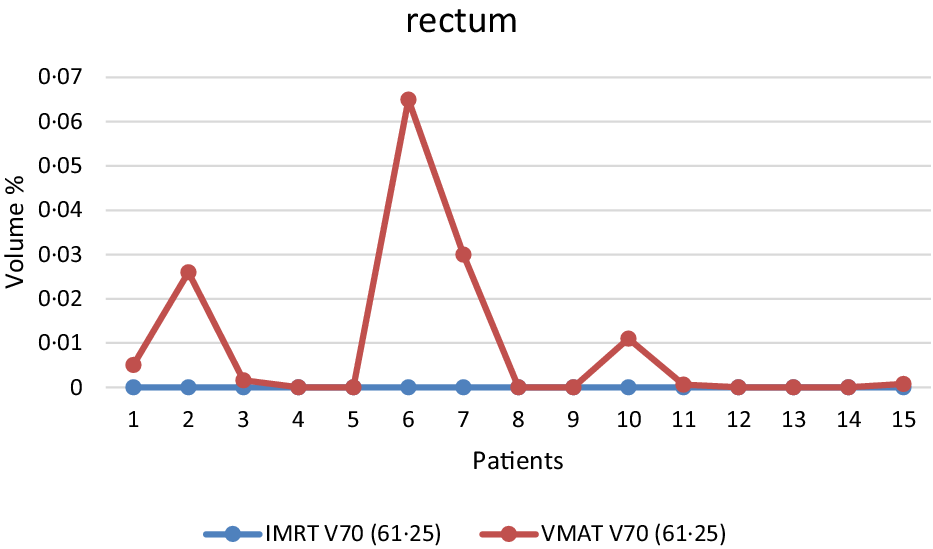
In case of rectum, the dose constraint objectives V26.25 < 80%, V43.75 < 60% and V61.25 < 15% were easily achieved as shown in Figures 13–15.
Rectum V43.75 Gy IMRT versus VMAT.

Rectum V61.25 Gy IMRT versus VMAT.

VMAT offered better rectum sparing as shown in Figures 13 and 14, respectively. Although there is a spike in graph as shown in Figure 15, but this is not clinically significant since target dose constraint was V70 (61.25) < 15% which was easily achieved for all patients.
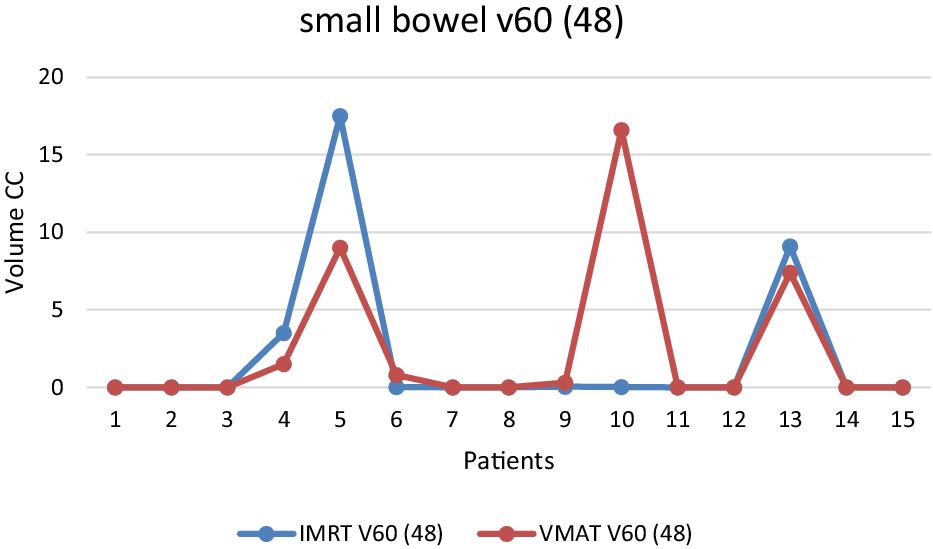
Figure 16 is showing a trend of small bowel volume in cubic centimetre (cc) receiving 48 Gy. It should be between 6 and 17 cc as an acceptable value. Reference David, Syndikus and Mossop16 In some patients, small bowel dose was very good in VMAT or RapidArc (RA) technique.
Small bowel V48 Gy IMRT versus VMAT.

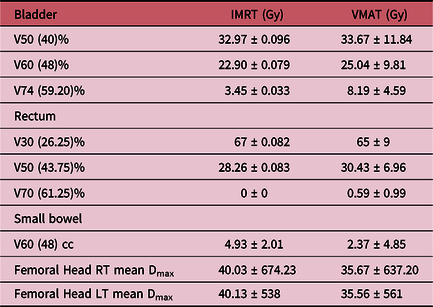
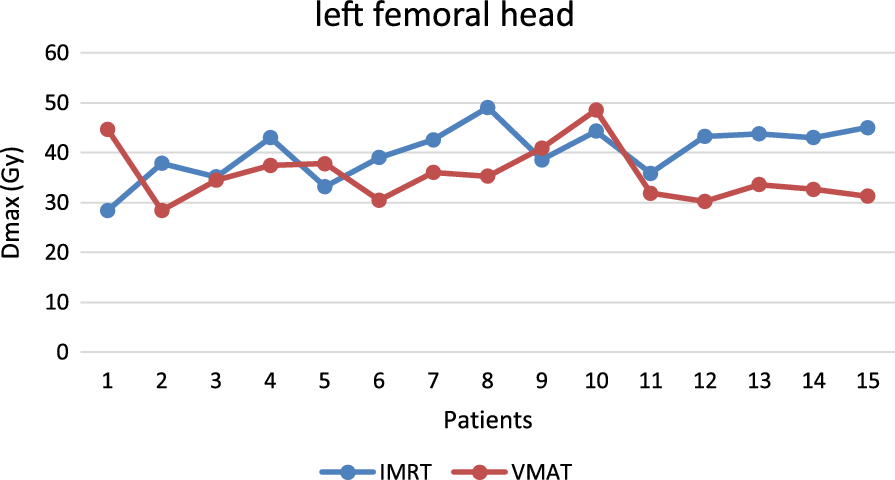
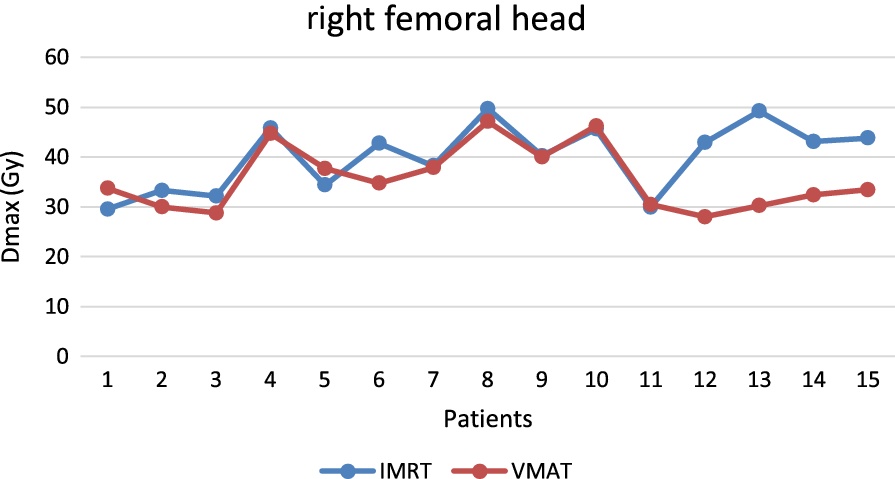
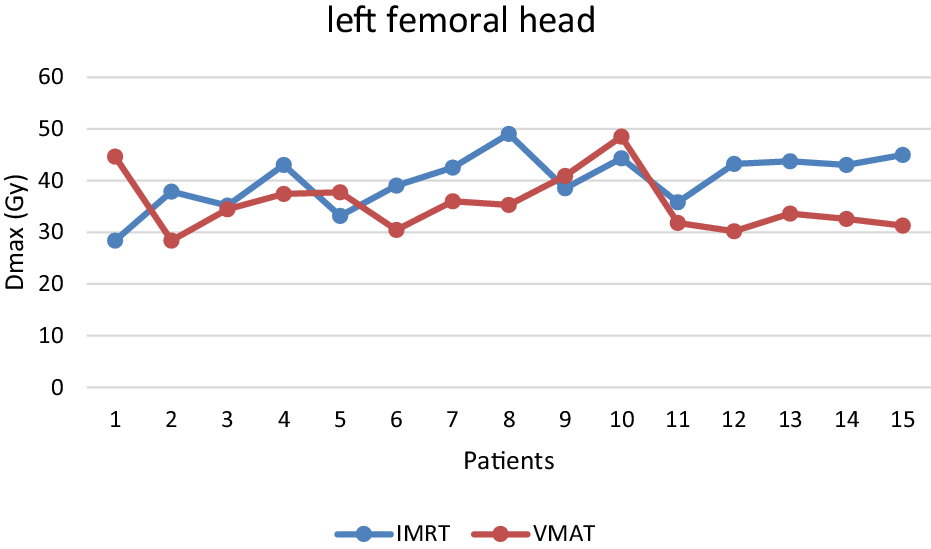
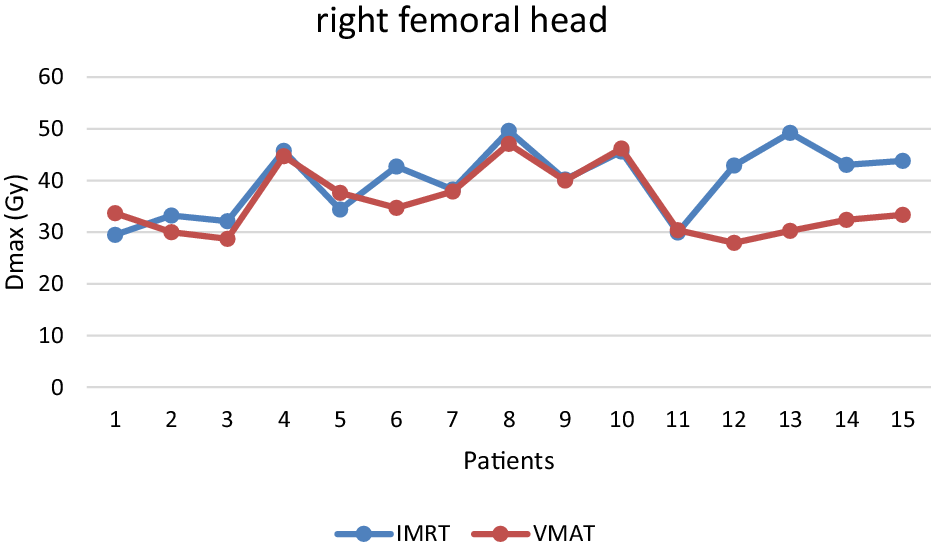
Similarly, we measured the maximum dose for right and left femoral heads of 15 patients (Figures 17 and 18) and results showed that VMAT offered much lower femoral head doses than IMRT (35.67 Gy ± 637.20 vs. 40.03 Gy ± 674.23 for RT femoral head and 35.56 Gy ± 561 vs. 40.13 Gy ± 538 for left (LT) femoral head, respectively). This shows VMAT offers better plan quality in terms of OAR sparing as has been described by Quan et al. Reference Quan, Li and Li30
LT femoral head Dmax.

RT femoral head Dmax.

Discussion
Two advanced radiotherapy techniques IMRT and VMAT have replaced the need of 3D conformal radiotherapy as they offer more conformal isodoses to the target while minimising the toxicity risk to organs at risk. Reference Iqbal, Isa and Buzdar31,Reference Zulkafal, Khan and Ahmad32
In this research work, we have compared two planning techniques which are widely used to treat the prostate cancer patients. We compared these two techniques in terms of plan quality parameters which are HI, CI, dose GI and doses of organ at risk.
Fifteen high-risk prostate patients were randomly selected and planned with IMRT and VMAT for hypofratioinated radiotherapy. Plans were optimised and normalised so that PTV 1 should receive 76% of prescribed dose, PTV 2 should receive 91% of prescribed dose and PTV 3 which is high-dose PTV should get at least 95% of prescribed dose. The organs at risk were kept as spare as possible so that coverage of each PTV dose level should not be compromised. All the plans were optimised using AAA and PO on Eclipse treatment planning system ARIA version 15.6.
IMRT and VMAT plans were optimised and dosimetric comparison was made between these two techniques in terms of plan evaluation parameters. These plan evaluation parameters were calculated for each dose level (PTV 48, PTV 57.6 and PTV 60).
If we talk about the results of organ at risk doses, IMRT offered better OAR sparing as compared to VMAT in case of bladder and rectum doses as shown in Table 4. Quan et al. Reference Quan, Li and Li30 has shown the similar behaviour of IMRT plans offering better bladder and rectum doses and he concluded that this is due to greater number of monitor units (MUs) of IMRT plan as compared to VMAT plan. All IMRT plans generated in this study uses seven gantry angles and VMAT plans were generated using two full arcs. Two full arcs offer better OAR sparing as compared to one full arc since two full arc rotations gives more room for beam modulation. Reference Quan, Li and Li30
We cannot conclude which technique is better in terms of OAR sparing based on our conflicting results as in some patients, IMRT provided better bladder and rectum sparing but higher femoral head doses as shown in Table 4. This conflicting behaviour in results could be due to applied dose constraints and PTV definitions which entirely depend upon the position of bladder and rectum. Onal et al. Reference Onal, Sonmez and Erbay9 has also discussed the conflicting behaviour of IMRT and VMAT in terms of OAR sparing. He has described the effect of planning strategies, applied dose calculation algorithms and treatment planning system data on the plan quality. The dose splash in IMRT was greater as compared to VMAT and our data of femoral head maximum doses show that VMAT has better ability to spare femoral heads than IMRT.
We only used 6 MV photon energy to generate the IMRT and VMAT plans as Onal et al. Reference Onal, Sonmez and Erbay9 has described that high energy of photons has no advantage over low energy photons, and neutron generation at 15 MV photon energy cannot be ignored. Reference Onal, Sonmez and Erbay9
Just like OAR doses, the plan quality parameters summarised in Tables 2 and 3 showed a conflicting behaviour. Since we had planned each prostate patient with three different PTV dose levels using SIB, in some dose levels, VMAT offered better conformity than IMRT. HI was almost same in both techniques. However, the dose GI was much better in VMAT. This may indicate a sharper dose fall off near organ at risk offering less acute OAR toxicity. In a study of 292 patients, Kopp et al. Reference Kopp, Duff and Catalfamo33 has discussed that acute rectum toxicity is lower in VMAT and our data of dose GI are describing the similar story.
This study is obviously has come with some limitations. We compared the OAR doses and plan evaluation parameters for a limited number of patients, in an attempt to find that up to how much extent, VMAT can provide better plans. Hence, based on our results of OAR doses and plan quality parameters which are summarised in Tables 2–4, we cannot definitely conclude which technique is better. As far as our own very busy radiotherapy centre is concerned, VMAT is more feasible as it requires less patient-specific quality assurance (QA) and dose-delivery time.
Conclusion
VMAT is a more efficient dose-delivery technique for high-risk prostate cancer patients in terms of time and without inducing the risk of toxicity to organs at risk. VMAT technique also uses a less number of monitoring units as compared to IMRT. All the plan evaluation parameters including HI, CI were analysed for each individual dose level of PTV and they were almost same for both techniques except dose GI, which is quite better in VMAT (14.79 vs. 7.89) for high-dose PTV3. Better dose GI indicates a sharper dose fall off and better dose conformity. We conclude that VMAT is better and efficient dose-delivery technique than IMRT.
Acknowledgements
The authors acknowledge the Shaukat Khanum Memorial Cancer Hospital and Research Centre for Institutional Review Board (IRB) approval and utilising its services in conduction of this research activity.
Financial Support
This research received no specific grant from any funding agency, commercial or not-for-profit sectors.
Conflict of Interest
None.
Ethical Standards
The authors assert that all procedures contributing to this work comply with the ethical standards and have been approved by the institutional committees (Institutional Review Board Shaukat Khanum Memorial Cancer Hospital and Research Centre Lahore).
No actual human/animal has been affected in conduction of this research work.