Introduction
High entropy alloys (HEAs) are a new assortment of engineering materials and may be potential candidates for various applications because of their promising properties [Reference Maulik and Kumar1, Reference Kumar, Maulik, Kumar, Prasad and Kumar2, Reference Kumar, Kumar, Maulik, Pradhan, Kumar and Patniak3, Reference Murty, Yeh and Ranganathan4, Reference Kumar, Kumar, Das, Gurao and Biswas5, Reference Yeh, Chen, Lin, Gan, Chin, Shun and Chang6]. The concept was first proposed by Prof. Jien Wei Yeh [Reference Yeh, Chen, Lin, Gan, Chin, Shun and Chang6] and Prof. Brian Cantor [Reference Cantor, Chang, Knight and Vincent7]. in 2004. The basic guideline for the concept of HEAs reveals that they contain at least five major principal elements in equiatomic or near-equiatomic ratios, each element having concentration between 5 and 35% [Reference Maulik and Kumar1, Reference Kumar, Maulik, Kumar, Prasad and Kumar2, Reference Kumar, Kumar, Maulik, Pradhan, Kumar and Patniak3, Reference Murty, Yeh and Ranganathan4, Reference Kumar, Kumar, Das, Gurao and Biswas5, Reference Yeh, Chen, Lin, Gan, Chin, Shun and Chang6]. It also leads to a high entropy of mixing which will overwhelm the formation of intermetallic compounds and give rise to a simple solid solution in crystal structures, such as body-centered cubic (BCC), face-centered cubic (FCC), and hexagonal close packed (HCP) [Reference Zhang, Zuo, Tang, Gao, Dahmen, Liaw and Lu8, Reference Widom, Gao, Yeh, Liaw and Zhang9, Reference Gao, Zhang, Guo, Qiao and Hawk10]. Because of their simple solid solution crystal structure, HEAs possess outstanding mechanical properties such as high fatigue resistance, outstanding thermal stability, better wear resistance, high mechanical strength, high fracture roughness, and better room temperature (RT) ductility [Reference Hemphill, Yuan, Wang, Yeh, Tsai, Chuang and Liaw11, Reference Wang, Wang and Yeh12, Reference Chuang, Tsai, Wang, Lin and Yeh13, Reference Senkov, Senkova and Woodward14, Reference Gludovatz, Hohenwarter, Catoor, Chang, George and Ritchie15, Reference Zhang, Mao, Wang, Gludovatz, Zhang, Mao, George, Yu and Ritchie16, Reference Otto, Dlouhý, Somsen, Bei, Eggeler and George17]. These preeminent properties are directly related to four core effects on HEAs: (i) lattice distortion effect, (ii) sluggish diffusion, (iii) high entropy effect, and (iv) cocktail effect [Reference Jien-Wei18]. The correlation between the mechanical properties and microstructure analysis of HEAs has been extensively studied in the past few years [Reference Murty, Yeh and Ranganathan4, Reference Widom, Gao, Yeh, Liaw and Zhang9, Reference Tsai and Yeh19]. However, it has also been noticed that typical HEAs acquire good soft magnetic behaviors such as high saturation magnetization (M s) enrichment of the capacity, high electrical resistivity (ρ) reduction of eddy current loss and reduction of energy loss, low coercivity (H c), and high Curie temperature (T C) [Reference Osaka, Takai, Hayashi, Ohashi, Saito and Yamada20, Reference Yeh, Chen, Lin and Chen21, Reference Cheng, Zhang, Zhang, Lee, Duckham, Weihs, Cammarata, Xiao and Chien22, Reference Duckham, Zhang, Liang, Luzin, Cammarata, Leheny, Chien and Weihs23]. HEAs are highly sensitive to the addition of some minor elements, which are responsible for change in their crystal structure [Reference Lucas, Mauger, Muñoz, Xiao, Sheets, Semiatin, Horwath and Turgut24, Reference Zuo, Li, Ren and Zhang25]. It was reported that Si reduces the M s value more significantly than Al in the case of CoFeNi alloys [Reference Zuo, Li, Ren and Zhang25]. Furthermore, with the addition of Al to FeCoCrNi, the paramagnetic phase (M s ∼ 3 emu/g) turns into the ferromagnetic phase (M s ∼ 13 emu/g) [Reference Lucas, Mauger, Muñoz, Xiao, Sheets, Semiatin, Horwath and Turgut24]. S. Uporov et al. worked on equiatomic AlCoCrFeNi HEAs; the value of M s was found to be in the range of 15 emu/g–54 emu/g at RT [Reference Uporov, Bykov, Pryanichnikov, Shubin and Uporova26]. A new investigation reported relatively high M s (1.15 T–915 emu/g), which opens up a new application of FeCoNi-based HEAs as soft magnets [Reference Zhang, Zuo, Cheng and Liaw27]. However, an M s of 64 emu/g and a H c of 51.52 Oe were observed in FeCoNiCrAl HEAs, and it has been found that addition of Nb was not good in the case of soft magnets [Reference Ma and Zhang28]. Equiatomic Bi–Fe–Co–Ni–Mn HEAs showed a transition from soft (100 Oe at 5 K) to hard (658 Oe at 873 K) ferromagnet with an elevation of temperature [Reference Yao, Zhang, Liu, Li, Ye, Liu and Tong29]. Equiatomic AlCoCrCuFeNi HEAs were prepared by splat quenching, conventional casting, and casting followed by aging, whose M s values were found to be 41 emu/g, 36 emu/g, and 40 emu/g and H c values were found to be 11 Oe, 44 Oe, and 26 Oe, respectively [Reference Singh, Wanderka, Kiefer, Siemensmeyer and Banhart30]. Addition of W and Zr in AlCoCrCuFeNi promoted the formation of partial paramagnetic and complete paramagnetic phases, respectively [Reference Tariq, Naeem, Hasan, Akhter and Siddique31]. Equiatomic FeSiBAlNi and FeSiBAlNiNb HEAs synthesized by mechanical alloying (MA) decrease the value of M s (55 emu/g max.) with an increase of extensive milling time (more than 40 h) [Reference Wang, Zheng, Xu and Wang32]. FeCrCoNiAl HEAs showed the evolution of the paramagnetic phase instead of the ferromagnetic phase [Reference Huang, Li, Li, Schönecker, Bergqvist, Holmström and Vitos33]. Recently, Nisheeth et al. worked on FeCoNi with the addition of Mg–Si, whose M s values were found to be supreme as compared to those of other researchers (125–266 emu/g) and a coercivity (H c) around 46–58 Oe [Reference Prasad and Kumar34]. By considering the previous studies on soft magnetic HEAs, followings things are concluded: First, a great focus has been made to reach high M s but yet there is a need of improvement. Second, very little attention has been given to the H c of HEA-based magnetic materials. Third, the permeability (µ), which is used to ascribe the magnetic flux established in the component, has not been considered. Therefore, to design soft magnets which can be used for low frequency applications such as transformer cores, M s, H c, and µ need to be paid equal attention.
In our present work, an attempt has been made to investigate the materials–structure–magnetic properties correlation of FeCoNi(Mn–Si)x (x = 0.5, 0.75, 1.0) HEAs followed by simulation work being done using COMSOL Multiphysics software to know the application characteristics of proposed HEAs as a transformer core.
Results and discussion
Phase evolution study
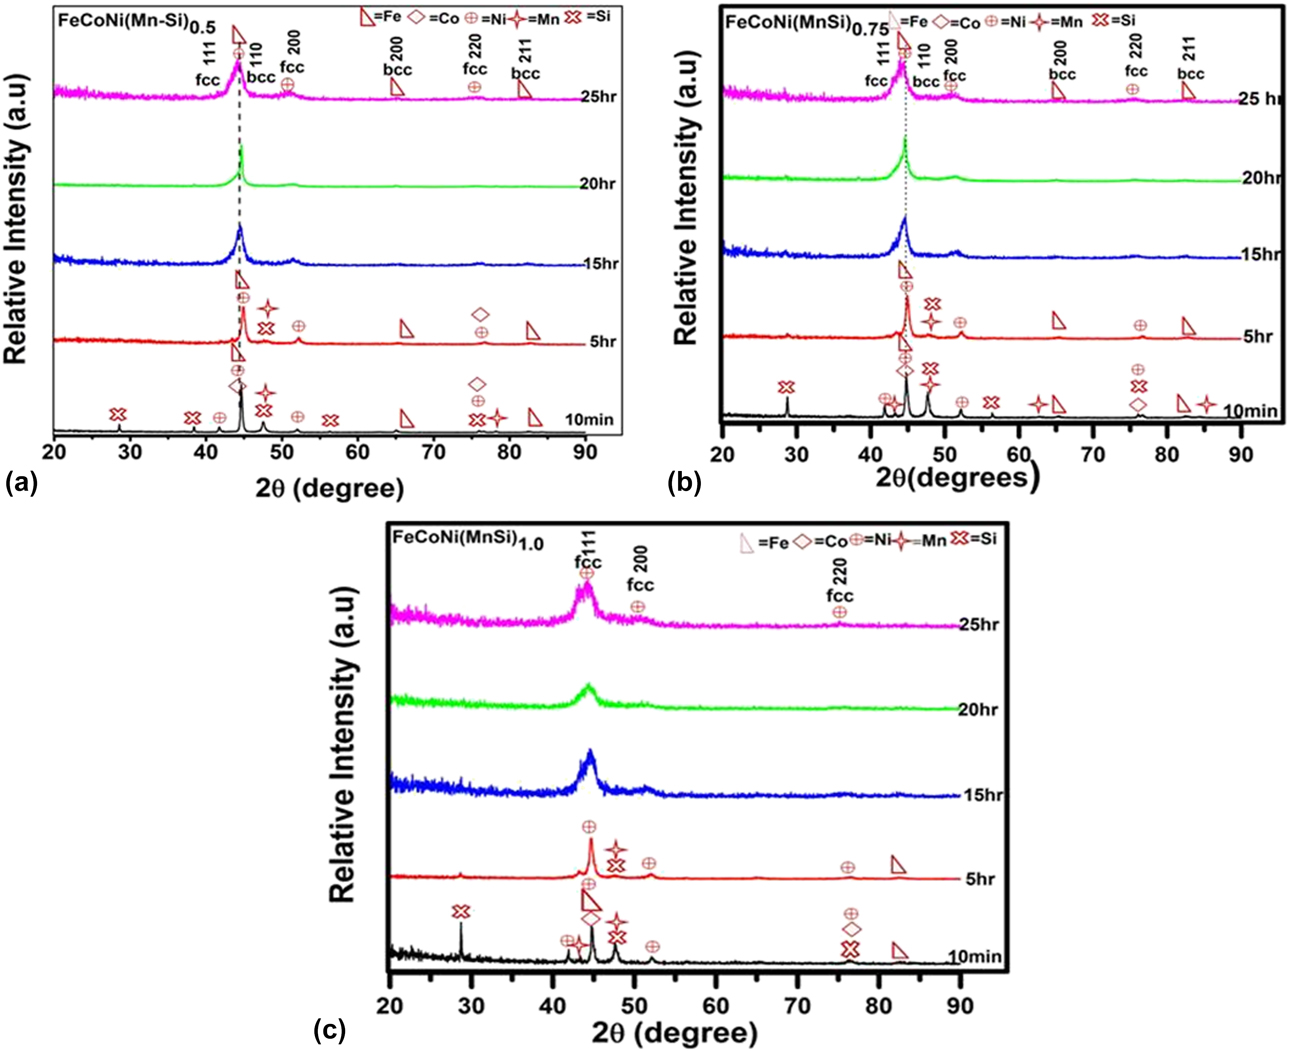
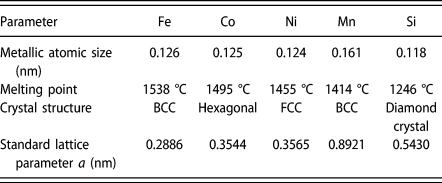
FeCoNi(Mn–Si)x (x = 0.5, 0.75, 1.0) HEAs with different milling times (10 min, 5 h, 15 h, 20 h, 25 h) is shown in Fig. 1. Figure 1(a) shows the X-ray diffraction (XRD) curve of FeCoNi(Mn–Si)0.5 HEA. The XRD analysis of primordial powders after 10 min of milling confirm that powders consist of elemental Fe (BCC), Co (HCP), Ni (FCC), Mn (BCC), and Si (DC) particles. For 5 h of milling, the diffraction peaks of all constituent elements remain the same, but the peak intensity of Si and Mn vanishes. Meanwhile, the peak intensity of Co and Ni decreases significantly, which shows that there is dissolution of Si and Mn into the Fe lattice and that there is partial dissolution of Co and Ni into the Fe lattice. As milling time increases to 15 h, the decrease in the intensity and peak broadening indicates the beginning of the solid-solution reaction. After 20 h of milling, the peak intensities of the diffraction pattern get further decreased. Consequently, to reduce the grain size and expedite the formation of homogeneous solid solutions, the milling mechanism was sustained to 25 h; the diffraction pattern gets further broadened insignificantly and becomes weaker in intensity, which indicates that an Fe-rich BCC (major) phase is formed with a small fraction of the Ni-rich FCC phase. The peak analogous to (110) plane of Fe-rich BCC phase reduces in intensity and broadens with increase in milling time. Thus, it can be assured that as-milled FeCoNi(Mn–Si)0.5 HEA consists of Fe-rich BCC as a major phase and Ni-rich FCC as a minor phase [please refer Supplementary material for deconvoluted XRD data—Fig. A4(a)]. Depending on XRD pattern analysis [Fig. 1(a)], lattice parameter, and melting point of individual elements (as shown in Table I), it can be assumed that Co, Mn, Si, and partial Ni dissolve in Fe matrix. The alloying sequence in the case of FeCoNi(Mn–Si)0.5 during MA is Co, Mn, Si → Fe, and Ni is partially dissolved in Fe.
(a) The XRD pattern for as-milled FeCoNi(MnSi)0.5 HEAs at different milling times (10 min, 5 h, 15 h, 20 h, and 25 h). (b) The XRD pattern for as-milled FeCoNi(MnSi)0.75 HEA at different milling times (10 min, 5 h, 15 h, 20 h, and 25 h). (c) The XRD pattern for as-milled FeCoNi(MnSi)1.0 HEA at different milling times (10 min, 5 h, 15 h, 20 h, and 25 h).

Atomic size, melting point, crystal structure, and lattice parameter of individual elements [Reference Yao, Zhang, Liu, Li, Ye, Liu and Tong1, Reference Prasad and Kumar34–Reference Kumar, Shekhar, Balasubramaniam and Balani35].

Phase evolution during MA process of FeCoNi(Mn–Si)0.75 HEA with respect to milling time is shown in Fig. 1(b). It is observed that after 5 h of milling, the diffraction peaks of both Si and Mn dissipate, suggesting that complete dissolution has taken place into the Ni-rich FCC lattice. When milling time is further increased to 15 h and 20 h, the intensity of Fe and Co diffraction peaks decreases which manifests the partial dissolution of Fe and Co into Ni lattice. After 25 h of milling, it shows that two phases are present, namely Ni-rich FCC as a major phase and Fe-rich BCC as a minor phase [please refer Supplementary material—Fig. A4(b)]. Based on the XRD analysis [shown in Fig. 1(b)], lattice parameter, and melting points of individual elements (shown in Table I), it must be concluded that the alloying sequence during MA of FeCoNi(Mn–Si)0.75 HEA follows Co, Mn, Si → Ni, and Fe is partially dissolved in Ni.
Figure 1(c) shows the XRD diffraction pattern of FeCoNi(Mn–Si)1.0 HEA, where the alloying elements were steadily alloyed, and the formation of FCC solid solution is taking place within 25 h of milling. The alloying sequence during MA processes can be predicted based on XRD pattern and physical properties of individual elements, such as their melting points [Reference Maulik and Kumar1, Reference Kumar, Shekhar, Balasubramaniam and Balani35, Reference Yousefi, Sharafi and Mehrolhosseiny36] (as shown in Table I). It can be concluded that Fe, Co, Si, and Mn atoms were easily diffused into the Ni matrix and form a single-phase solid solution.
Lattice parameter analysis
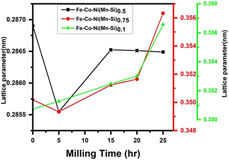
The lattice parameter plotted against milling time interval (10 min, 5 h, 15 h, 20 h, and 25 h) using experimental formula 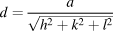 $d = {a \over {\sqrt {{h^2} + {k^2} + {l^2}} }}$ is shown in Fig. 2. It is observed that the peak shifting takes place with subsequent milling process in the case of FeCoNi(Mn–Si)x (x = 0.5, 0.75, 1.0) HEAs. For FeCoNi(Mn–Si)0.5 HEA, lattice parameter was estimated using the Fe-rich BCC peaks of (110), (200), and (211) and for FeCoNi(Mn–Si)0.75 and FeCoNi(Mn–Si)1.0 using Ni-rich FCC peaks (111), (200), and (220).
Variation of lattice parameter of FeCoNi(MnSi)0.5, FeCoNi(MnSi)0.75, and FeCoNi(MnSi)1.0 HEAs as a function of different milling times (10 min, 5 h, 15 h, 20 h, and 25 h).
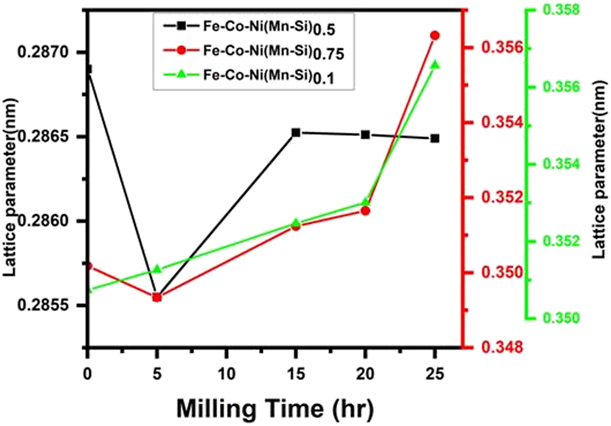
For FeCoNi(Mn–Si)0.5, the lattice parameter at 10 min of milling is found to be 0.2869 nm, whereas at 25 h of milling, the lattice parameter is reduced to 0.2864 nm, which closely matches the standard lattice parameter of Fe (0.2866 nm: PDF card no-00-0006-0696). The reduction in lattice parameter is mainly due to a very small atomic radius (r a) of Si (0.118 nm), Ni (0.124 nm), and Co (0.125 nm) as compared to Fe (0.126 nm) [Reference Kumar, Shekhar, Balasubramaniam and Balani35, Reference Yousefi, Sharafi and Mehrolhosseiny36]. The dissolution of Si and Mn in the Fe-rich BCC lattice leads to a reduction in lattice parameter that has been proved by XRD analysis.
For FeCoNi(Mn–Si)0.75, the lattice parameter decreases from 0.3501 to 0.3493 nm at an interval of 10 min to 5 h of milling; then, the lattice parameter extension takes place; and finally, it reaches the 0.3563 nm at 25 h of milling, which is slightly higher than the standard lattice parameter of Ni (0.3565: PDF card no-01-089-7128). The reduction of lattice parameter is due to the smaller atomic radius (r a) of Si (0.118 nm) [Reference Silva, Meunier and Foggia37]. It is well recognized that the crystal structure of Si is DC, which is much brittle in nature and causes abundant distortion in the lattice during an initial stage at 5 h of milling. It can be concluded that after 5 h of milling, the rate of diffusion of Mn (r a = 0.161 nm) and Fe (r a = 0.126 nm) into Ni (r a = 0.124 nm) lattice becomes more prominent and thus slightly increases the lattice parameter of Ni.
For FeCoNi(Mn–Si)1.0, the lattice parameter after 25 h milling is 0.3565 nm (0.3565: PDF card no-01-089-7128). It can be concluded that the increase in lattice parameter of the FCC phase (i.e., Ni-based phase) from 0.35074 nm (10 min of milling) to 0.3565 nm is mainly due to the diffusion of Mn and Fe into Ni lattice during MA.
Crystallite size and micro strain determination
The crystallite size and lattice strain of FeCoNi(Mn–Si)x (x = 0.5, 0.75, 1.0) HEAs have been calculated from the following formula:
 $$D = {{k\lambda } \over {\beta \cos \theta }}\quad ,$$
where D is the crystallite size, K ∼ 0.9 is Scherrer constant, λ is a wavelength of the X-ray used (0.1541 nm), and θ is the Bragg’s angle.
The strain anisotropy effect has been ignored while calculating the crystallite size and strain, which may be the probable reason for the error in the prediction by the Williamson–Hall method [Reference Williamson and Hall38, Reference Cullity39]. The variation of lattice strain can be calculated by the following formula:
 $$\varepsilon = {\beta / {4\tan \theta }}\quad ,$$
where βhkl is the full width at half maximum (FWHM).
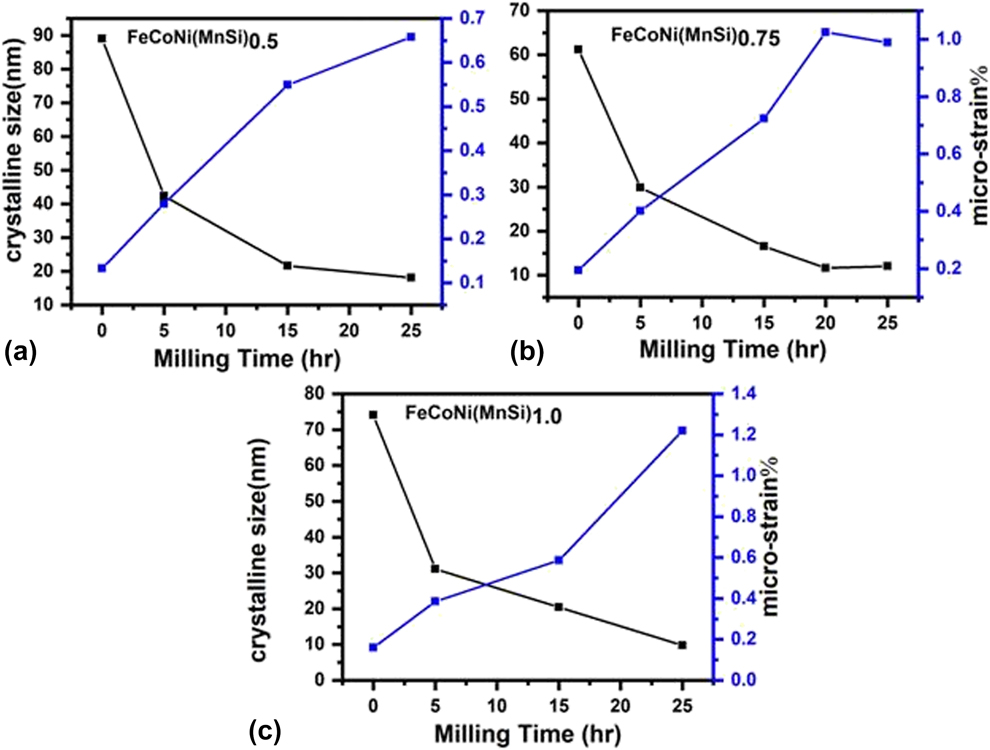
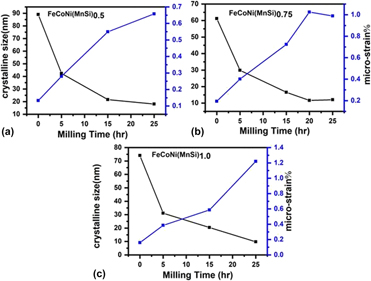
Figure 3 shows XRD diffraction pattern of FeCoNi(Mn–Si)x (x = 0.5, 0.75, 1.0) HEAs with increase of milling hour, which indicates that the intensity of the peaks decreases and the shape of XRD pattern undergoes peak broadening as a result of increase in milling time. The two main properties extracted from peak width analysis (using FWHM) are the crystallite size and lattice strain after excluding the contribution due to instrumental error [Reference Cullity39]. The variation in crystallite sizes and microstrain can be plotted with a milling time of FeCoNi(Mn–Si)x (x = 0.5, 0.75, 1.0) HEAs, which is shown in Fig. 3. As shown in Fig. 3(a), for FeCoNi(Mn–Si)0.5 HEA, the crystallite size drastically changes during 5 h of milling. On further milling, the size of crystallite size decreases slowly and reaches to its least value of 18.08 nm after 25 h of milling.
Crystallite size (D) and % microstrain of (a) FeCoNi(MnSi)0.5, (b) FeCoNi(MnSi)0.75, and (c) FeCoNi(MnSi)1.0 HEAs.
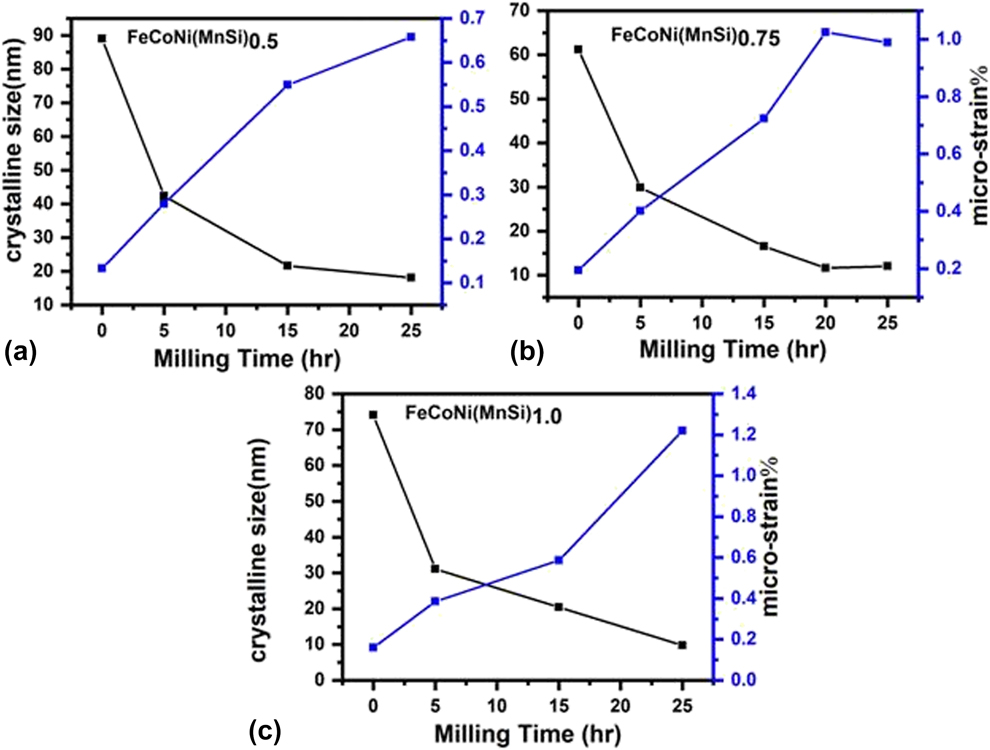
The final crystallite size of FeCoNi(Mn–Si)0.75 and FeCoNi(Mn–Si)1.0 HEAs was obtained after 25 h of milling as 12.09 nm and 9.78 nm, respectively. The crystal defects such as dislocation and vacancy were created at an early stage of MA (mechanical alloying) [Reference Suryanarayana40]. When milling time increases, the density of dislocation and their pileups at obstacles also increases, which might lead to the formation of new boundaries and try to fragment the crystal structure into nanoscale crystals [Reference Bahrami and Sharafi41]. Moreover, Si particles have a DC structure, which is more brittle than Fe and Ni particles. As a result, the Si particles were fragmented at a very early stage of milling and further increase in milling time makes the matrix finer. The speedy decrease of crystallite size is due to the annihilation and recombination of dislocation and tries to form nanostructure subgrains [Reference Baghbaderani, Sharafi and Chermahini42].
The value of lattice strain increases as a result of milling of FeCoNi(Mn–Si)x (x = 0.5, 0.75, 1.0) HEAs, as shown in Fig. 3. The increase in lattice strain may be due to the severe plastic deformation occurred during MA and diffusion of dissimilar elements into a specific matrix having bigger or smaller atomic radii and different crystal structures as compared to the matrix [Reference Nasibi, Shokrollahi, Karimi and Janghorban43].
Morphological evolution
SEM study
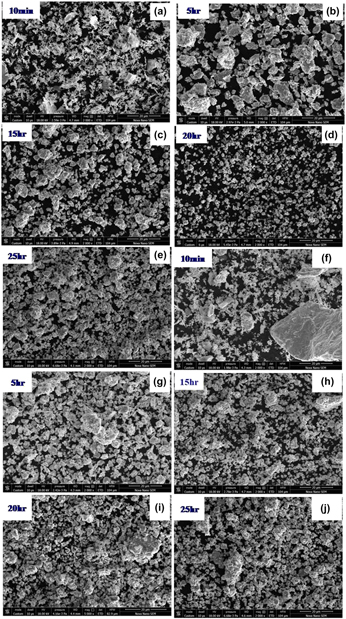
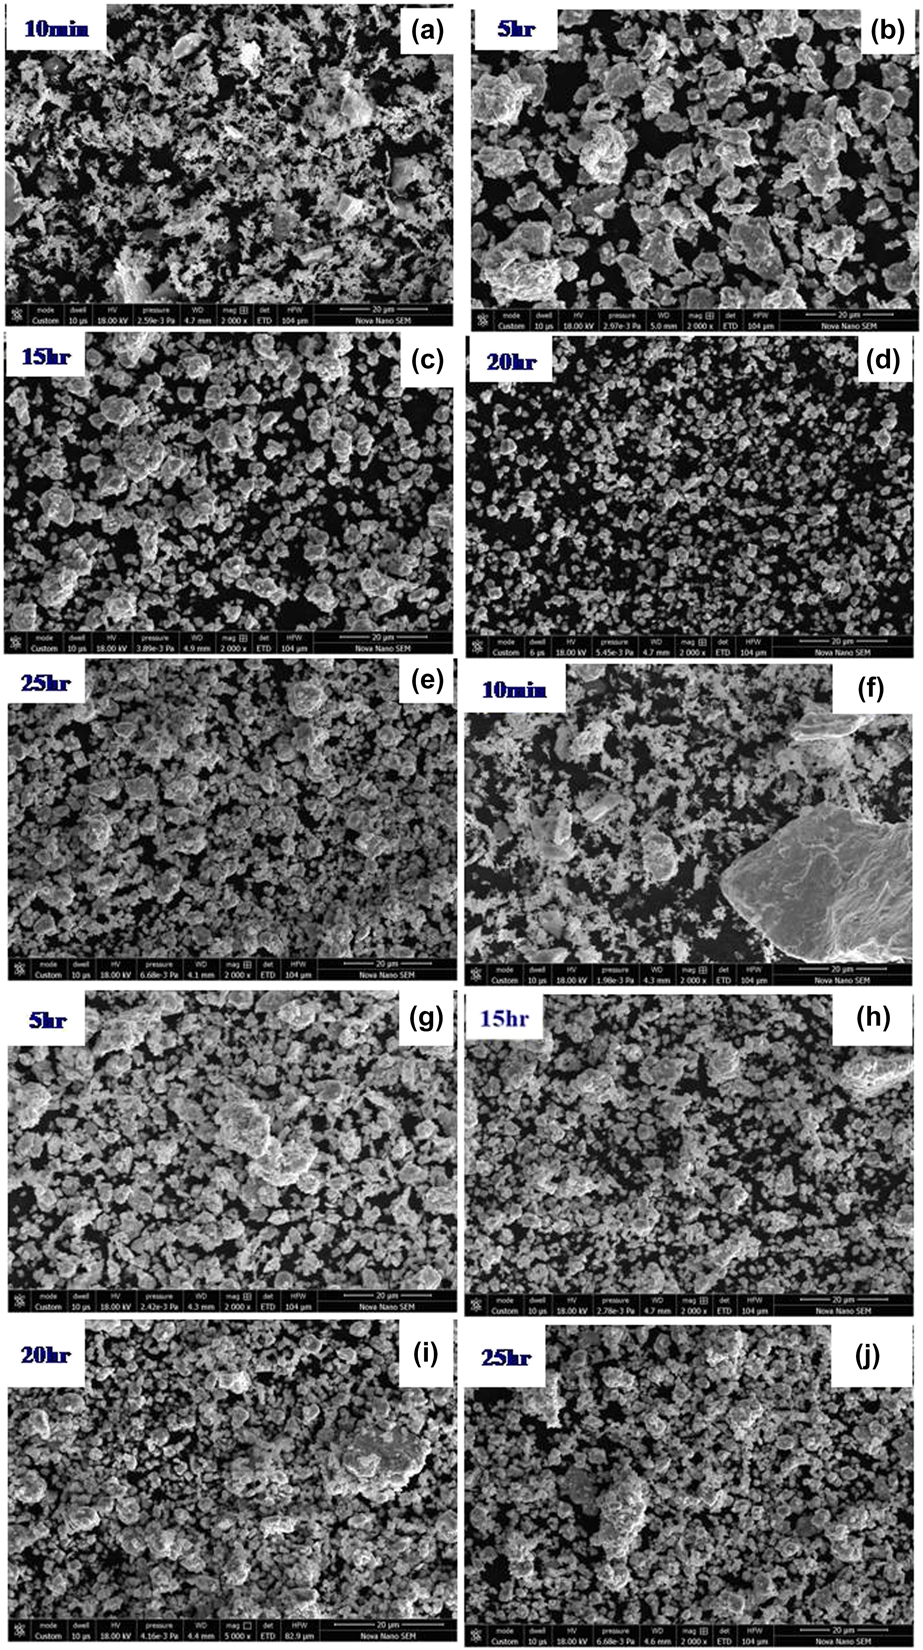
Figures 4(a)–4(e) show the surface morphology evolution of FeCoNi (Mn–Si)0.5 as a function of milling time. Just after 10 min of milling, flakes of powder particles along with agglomerated particles are clearly observed in the micrograph [Fig. 4(a)]. The size and shape of raw material particles were inhomogeneous. The agglomerated particles were broken down into finer particles with increase of milling time, as shown in Figs. 4(b) and 4(c). As a result of excess milling up to 20 h, all the grains lead to finer particles size with round shape as shown in Fig. 4(d). After prolonged milling time up to 25 h [Fig. 4(e)], mechanically alloyed particles become finer (as confirmed by XRD analysis) and these particles became agglomerated. The gradual rise of agglomerated particles may be due to competition between the cold-welding and fracturing process under the repetitive events of impact [Reference Yousefi and Sharafi44, Reference Khajepour and Sharafi45, Reference Chitsazan, Shokrollahi, Behvandi and Ghaffari46]. Figures 4(f)–4(j) show the surface morphology of FeCoNi(Mn–Si)0.75 at different milling stages. As shown in Fig. 4(f), the starting powders (10 min) show both spherical (agglomerated particles) and flakes shape. A similar type of morphology evolution has been observed as discussed in the case of FeCoNi(Mn–Si)0.50 HEA.
(a–e) Typical SEM micrographs of FeCoNi(MnSi)0.5 HEA as a function of different milling times (10 min, 5 h, 15 h, 20 h, and 25 h). (f–j) Typical SEM micrographs of FeCoNi(MnSi)0.75 HEA as a function of different milling times (10 min, 5 h, 15 h, 20 h, and 25 h).
TEM study
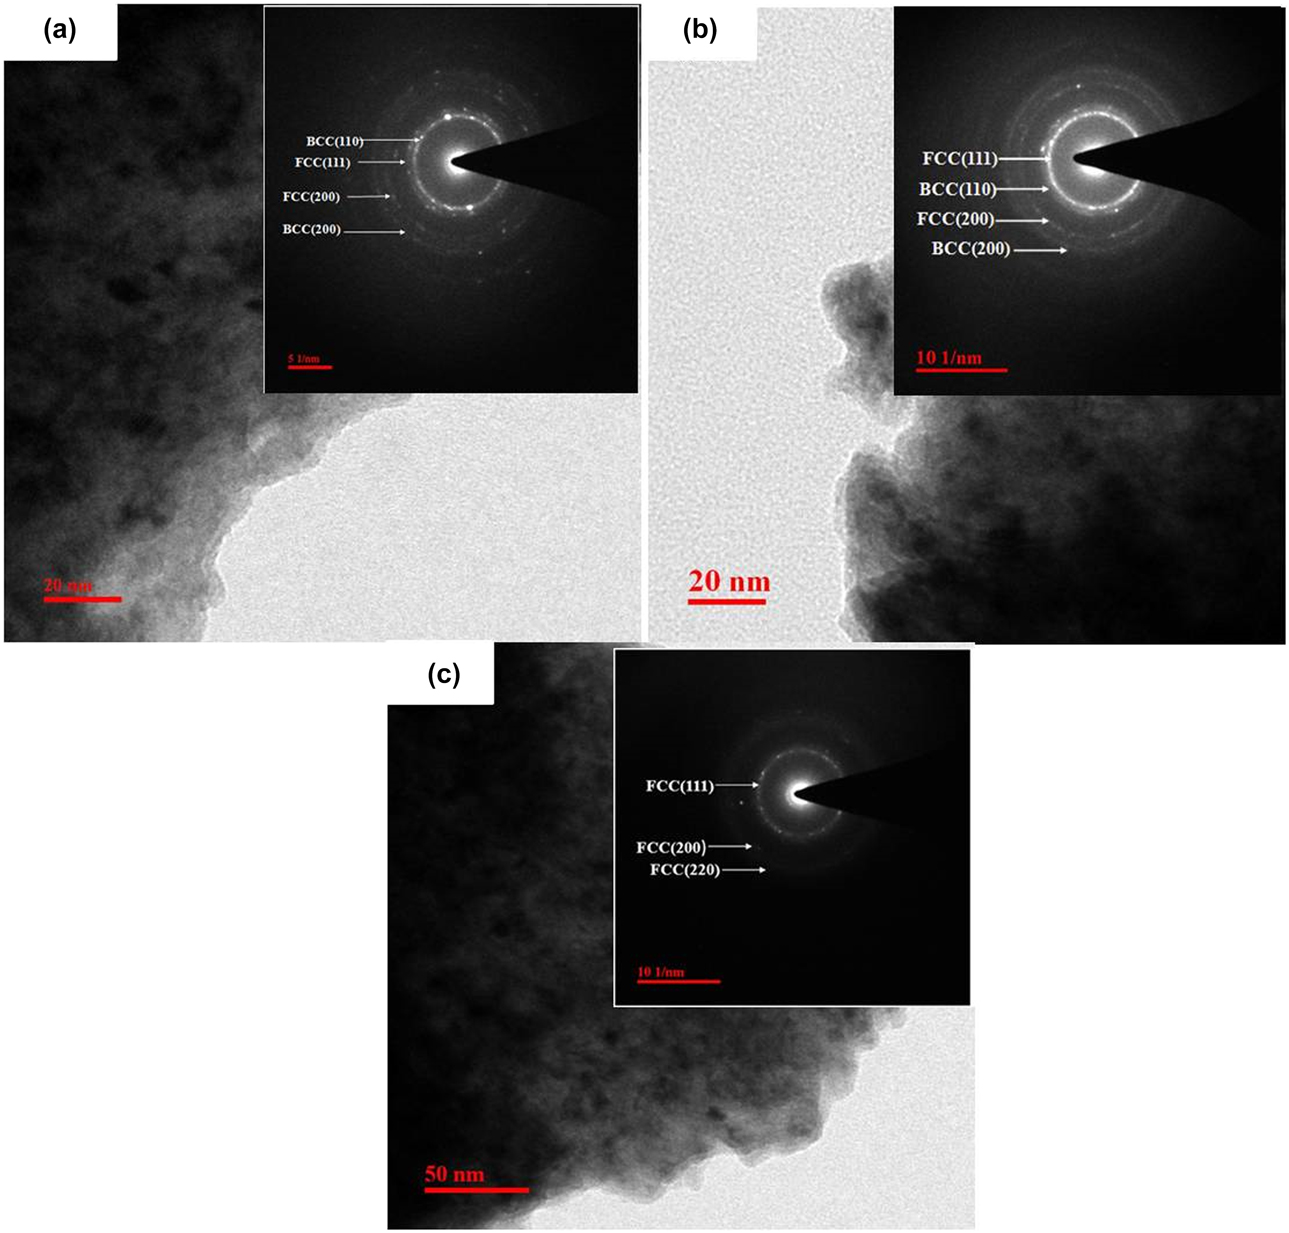
Figure 5 shows the transmission electron microscopy (TEM) analysis of FeCoNi(Mn–Si)x (x = 0.5, 0.75, 1.0) observed after 25 h of milling. Figure 5(a) shows the bright field image and selected area electron diffraction (SAED) pattern [inset of Fig. 5(a)] of the FeCoNi(Mn–Si)0.5 HEA. The diffraction rings present in FeCoNi(Mn–Si)0.5 HEA belong to (110) and (200) plane of the BCC crystal structure and (111) and (200) plane of the FCC crystal structure. The bright field image and SAED pattern [inset of Fig. 5(b)] of FeCoNi(Mn–Si)0.75 HEA are shown in Fig. 5(b). The bright field image and SAED pattern [inset of Fig. 5(c)] of FeCoNi(Mn–Si)1.0 HEA is shown in Fig. 5(c), which confirms the diffraction rings of (111), (200), (220) planes of FCC crystal structure. TEM results match the analysis of XRD diffraction pattern of FeCoNi(Mn–Si)x HEAs.
(a) Bright-field TEM image and corresponding SAED pattern for mechanically alloyed FeCoNi(MnSi)0.5 HEA after 25 h of milling. (b) Bright-field TEM image and corresponding SAED pattern for mechanically alloyed FeCoNi(MnSi)0.75 HEA after 25 h of milling. (c) Bright-field TEM image and corresponding SAED pattern for mechanically alloyed FeCoNi(MnSi)1.0 HEA after 25 h of milling.

Magnetic characterization
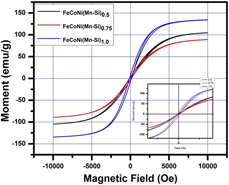
Figure 6 shows the hysteresis loop of FeCoNi(Mn–Si)x (x = 0.5, 0.75, 1.0) HEAs at RT. These alloys can be easily magnetized (saturation) and demagnetized (low coercivity). The incredible rise of magnetic saturation (M s) exhibits in the range of 89.08–134.21 emu/g and low coercivity (H c) in the range of 98.07–133.87 Oe of FeCoNi(Mn–Si)x (x = 0.5, 0.75, 1.0) HEAs (Table II). First, the magnetic saturation (M s) decreases from FeCoNi(Mn–Si)0.5 to FeCoNi(Mn–Si)0.75 HEA and then further increases from FeCoNi(Mn–Si)1.0 HEA. Although exhaustive investigations are recommended and proposed to thoroughly rationalize these changes, these fundamental trends to rationalize these changes are based on the lattice parameters and crystal structure changes with increase of Mn–Si content. In section “Phase evolution study,” it has been observed that FeCoNi(Mn–Si)0.5 HEA consists of Fe-rich BCC (major) and Ni-rich FCC (minor) phase. The FeCoNi(Mn–Si)0.75 HEA has Ni-rich FCC (major) and Fe-rich BCC (minor) phases. However, in FeCoNi(Mn–Si)1.0 HEA, only the Ni-rich FCC phase has been observed. The higher value of M s has been observed in FeCoNi(Mn–Si)1.0 HEA, which may be due to the formation of the single-phase solid solution that is Ni-rich FCC phase, and complete MA is taking place when Si and Mn are added to the alloy system [Reference Yousefi and Sharafi44]. The low value of M s is because of the changing phase from Fe-rich BCC to Ni-rich FCC phase.
Typical magnetic hysteresis loop of FeCoNi(MnSi)0.5, FeCoNi(MnSi)0.75, and FeCoNi(MnSi)1.0 HEAs.
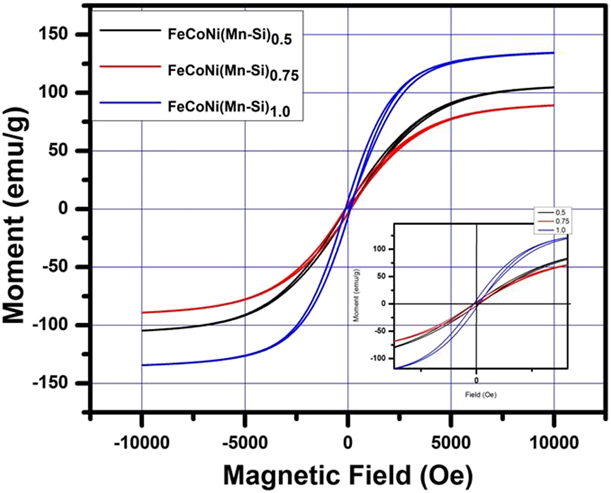
Saturation magnetization (M s), retentivity (M r), coercivity (H c), initial permeability (µi), and maximum energy product (BH) for FeCoNi(MnSi)0.5, FeCoNi(MnSi)0.75, and FeCoNi(MnSi)1.0 HEAs.

It is well known that coercivity (H c) is a unique significant parameter for determining the magnetic properties of material, which strongly depends on the grain size that consists of grain boundaries (GB), internal defects, dislocations, and inclusions [Reference Chitsazan, Shokrollahi, Behvandi and Ghaffari46]. The most effective tool for determining H c is the crystallite size. The relation between H c and crystalline size is determined by following equation [Reference Bahrami, Sharafi and Baghbaderani48]:
 $${H_{\rm{c}}} = \root 3 \of {{{K{T_{\rm{C}}}{K_1}} \over {a{M_{\rm{s}}}}}} {1 \over D}\quad ,$$
where k is the Boltzmann constant, T C is the Curie temperature, K 1 is the magneto crystalline, a is lattice constant, M s is the magnetic saturation, D is the crystallite size; it is also noticed that the crystalline size depends on magnetic exchange length (L ex). L ex can be expressed as [Reference Razi, Ghasemi and Borhani49]
 $${L_{{\rm{ex}}}} = \sqrt {{A \over {{K_1}}}\quad ,}$$
where A is the exchange stiffness constant.
There are the two major aspects, where H c depends on crystalline size. First, when the crystallite size is greater than the L ex, the H c depends on the crystallite size and the M s, and second, when the crystalline size is smaller than L ex, grain boundary effect diminishes and each grain behaves as a single grain.
Based on the random anisotropy model, the H c can be expressed as [Reference Yousefi and Sharafi44, Reference Bitoh, Makino, Inoue and Masumoto50]
 $${H_{\rm{c}}} = {{{P_{\rm{C}}}{D^6}K_1^4} \over {{\mu _0}{M_{\rm{s}}}{A^3}}}\quad ,$$
where P C is a constant of the order of unity, μ0 is the permeability of free space, and A is the exchange constant. For Fe45Co45Ni10 [Reference Baghbaderani, Sharafi and Chermahini42], using A = 1.7 × 10⁻¹¹ J/m, K 1 = 8 kJ/m3, L ex value was calculated to be 46 nm. For the current alloy systems, the crystallite size of powder samples was calculated as 18.08 nm (for x = 0.5), 12.09 nm (for x = 0.75), and 9.78 nm (for x = 1.0), which is less than the magnetic exchange length. As a result, the H c follows the D 6 power law and decays with reduction of crystallite size. The Hc of FeCoNi(Mn–Si)0.5 HEA system reaches 98.07 Oe and with increases of Mn and Si content in the FeCoNi(Mn–Si)0.75 HEA, the H c further increased to 133.87 Oe. With Mn and Si content further increasing in the FeCoNi(Mn–Si)1.0 alloy system, the H c decreases to 118.87 Oe. The enhancement of H c is due to the growth of plastic deformation and microstrain from FeCoNi(Mn–Si)0.5 HEA to the FeCoNi(Mn–Si)0.75 HEA. The decrement of H c is based on the D6 law, where the existence of Si content may speed up the reduction of a crystallite size at critical values and thus H c will be decreased. The prolonged milling time may also decrease in connectivity due to the annihilation of dislocation because of their high density in the particle. The other reason to decrease H c is due to surface irregularities causes by prolonging of milling.
COMSOL Multiphysics simulation
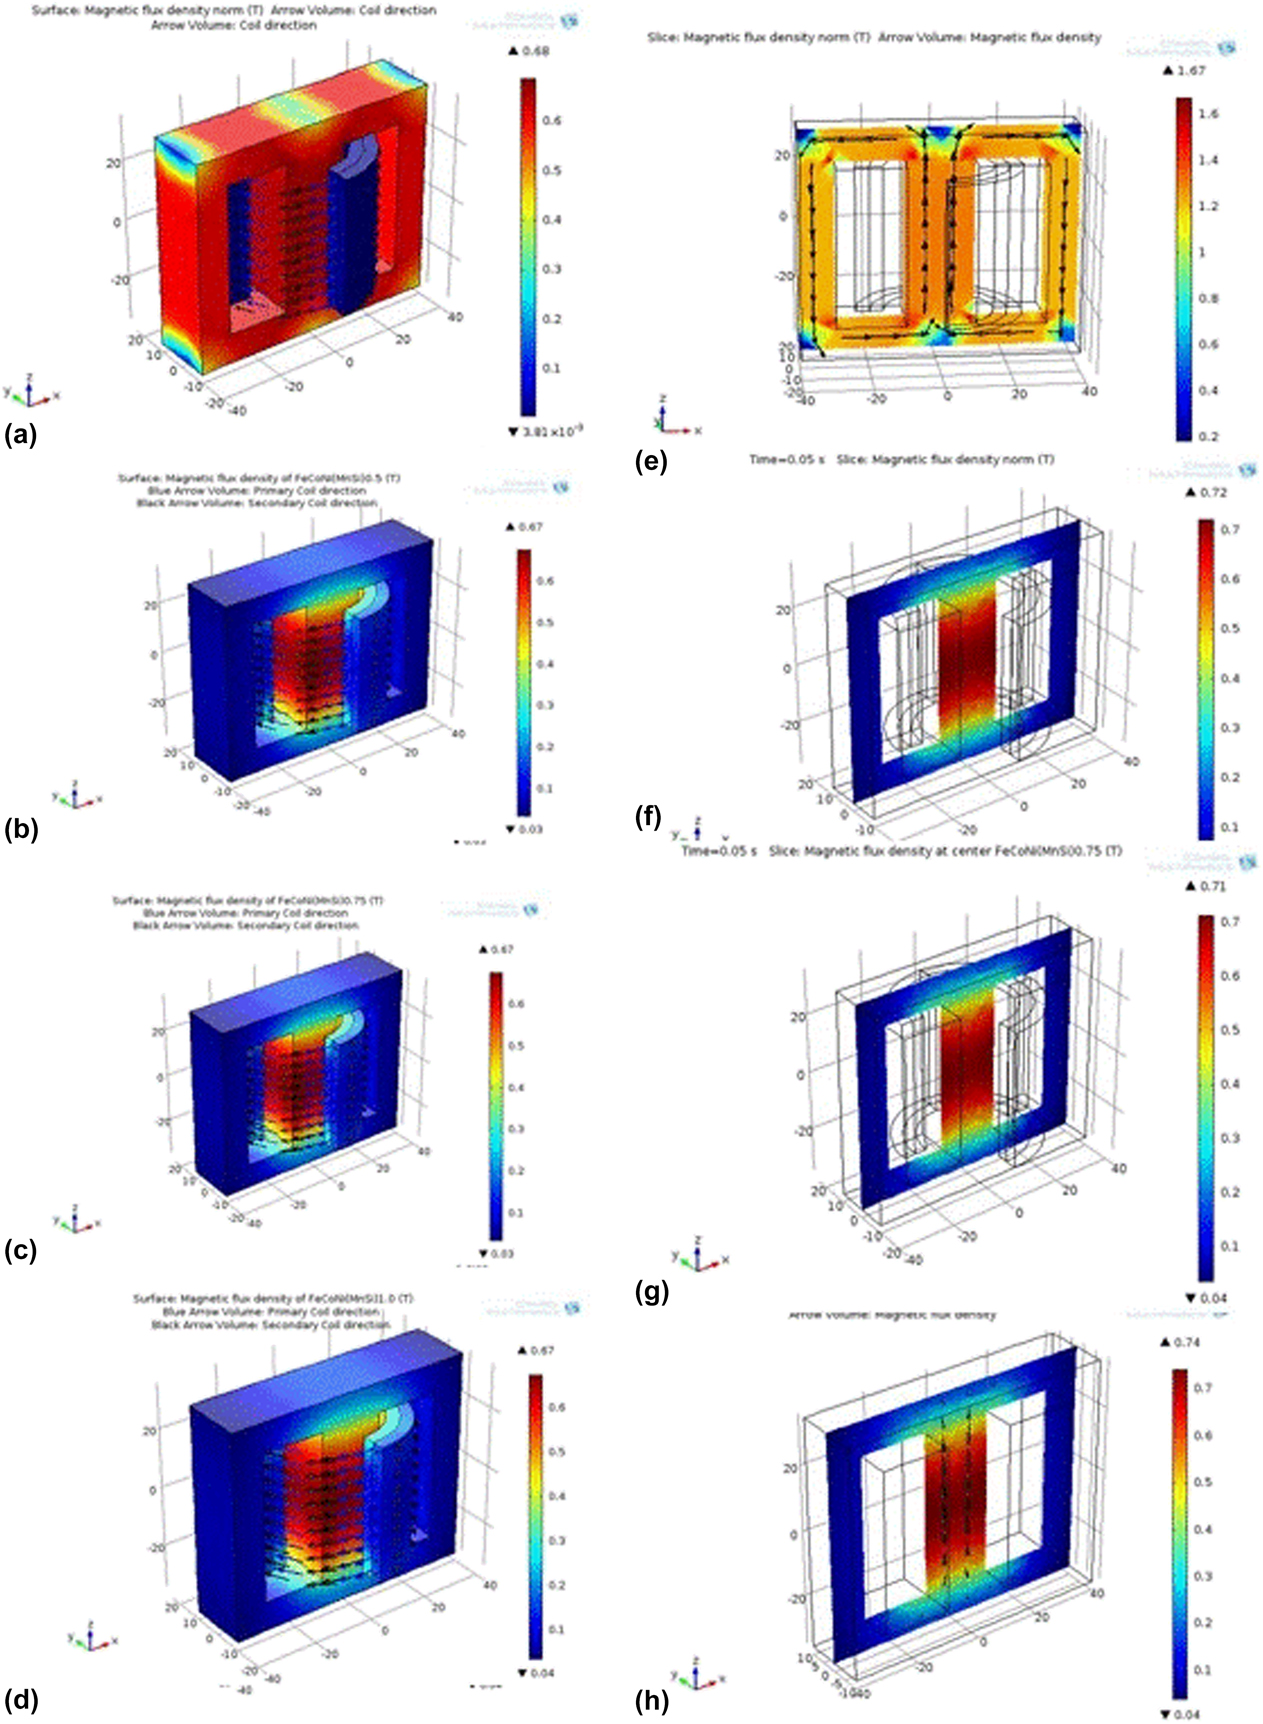
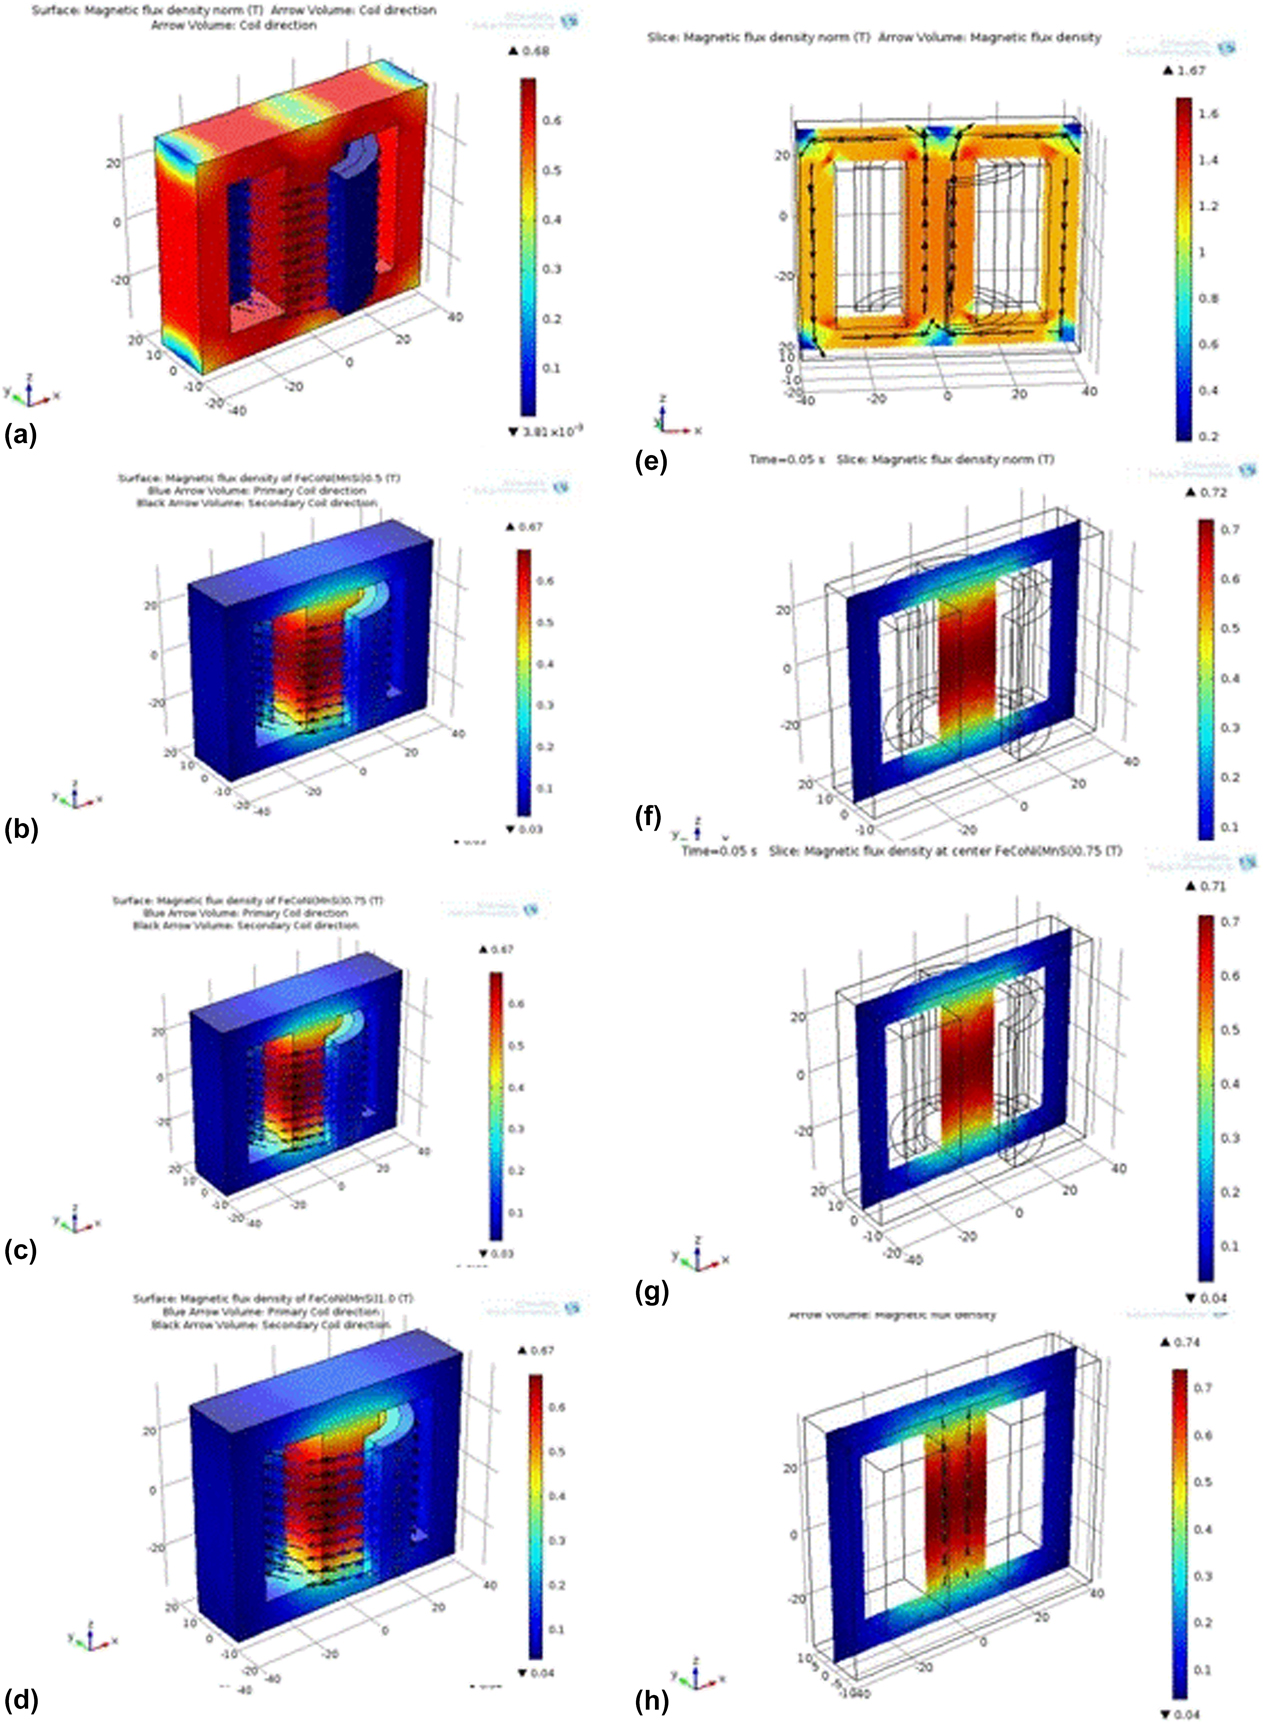
To analyze the output signal of the transformer core and its overall performance, the COMSOL Multiphysics simulations has been utilized to discuss the flux density distribution within the magnetic core. Figure 7 shows the magnetic flux density on the surface and at the center of transformer soft iron and FeCoNi(Mn–Si)x (x = 0.5, 0.75, 1.0) HEAs. It is observed that on the surface of the transformer core, there is no change in magnetic flux density but at the center of the transformer cores, following changes are observed. It is observed that the magnetic flux density at the center of a transformer core in FeCoNi(Mn–Si)0.5 HEA is 0.72 Tesla and it decreases to 0.71 Tesla in FeCoNi(Mn–Si)0.75 HEA. Further increasing the Mn and Si content, the magnetic flux density at the center of core increases from 0.71 Tesla to 0.74 Tesla at FeCoNi(Mn–Si)1.0 HEA. The sudden change in magnetic flux density is due to the presence of change in phase from Fe-rich BCC (major) to Ni-rich FCC (minor) phase. The high value of magnetic flux density was observed in FeCoNi(Mn–Si)1.0 HEA, which is due to the single-phase solid solution observed.
(a–d) The magnetic flux density on the surface of soft iron core. (e–h) The magnetic flux density at the center of a transformer core in soft iron core and FeCoNi(Mn–Si)0.5, FeCoNi(Mn–Si)0.75, and FeCoNi(Mn–Si)1.0 HEAs.
It can be concluded that finite element method (FEM) facilitates in the analysis and provides better understanding of the transient behavior by B-H curve of proposed HEAs and the generated flux density distributions in transformer geometries throughout the designing process. Advanced studies are going on to improve the magnetic flux density based on their numerical stability of the models and consider the effects of eddy currents on transformer cores and windings into the transformer models.
Conclusions
FeCoNi(Mn–Si)x (x = 0.5, 0.75, 1.0) HEAs are successfully prepared by MA. XRD analysis revealed the formation of major BCC phases along with minor fraction of FCC phases in FeCoNi(Mn–Si)0.5 HEA, whereas FCC phase as major and BCC phase as minor were observed in case of FeCoNi(Mn–Si)0.75 HEA. However, single phase has been observed in FeCoNi(Mn–Si)1.0 HEA. The crystallite size was reduced from 18.08 to 9.78 nm for FeCoNi(Mn–Si)0.5 and FeCoNi(Mn–Si)1.0 HEAs, which may be due to the presence of high content of Si that tries to help the fragmentation of the neighboring powder particle because of the brittle behavior of Si. While increasing the Mn content, the lattice parameter also increased from 0.2864 to 0.3565 nm for FeCoNi(Mn–Si)0.5 and FeCoNi(Mn–Si)1.0 HEA. The morphology of powder particles by SEM shows the irregular distribution. The powder sample after 25 h of milling shows the high value of magnetic saturation of 134.21 emu/g for FeCoNi(Mn–Si)1.0 due to the formation of single FCC phase. The minimum coercivity (H c) of 98.07 Oe was found for FeCoNi(Mn–Si)0.5 alloy due to the presence of Si that tries to speed up the development of crystallite size reduction below the magnetic exchange length. The maximum flux density occurs at the center of the transformer is 0.74 Tesla for FeCoNi(Mn–Si)1.0 HEA, which is higher than that of FeCoNi(Mn–Si)0.5 and FeCoNi(Mn–Si)0.75 HEA.
Experimental details
Materials and methodology
Iron (Fe), cobalt (Co), nickel (Ni) powders with purity of 99.8%, and manganese (Mn) and silicon (Si) powders with 99.5% purity, procured from Loba Chemie, were mechanically alloyed to develop FeCoNi(Mn–Si)x (x = 0.5, 0.75, 1.0) HEAs. High-energy planetary ball milling of Fritsch Pulverisette P6 was used for MA process having a tungsten carbide (WC) cylindrical container with a capacity of 250 mL and the rotation speed was maintained at 300 rpm. WC balls of 5 mm diameter were loaded onto WC cylindrical container. The total amount of prepared sample was 30 gm and the ball to powder ratio was sustained at 10:1. Therefore, overall 38 WCs balls were used for the preparation of 30 g powder. Enough quantity of toluene was supplemented to the powder sample, which acts as a process control agent (PCA) throughout the process of MA. The process was supported in the range of 10 min to 25 h (10 min, 5 h, 15h, 20h, and 25h) to demonstrate its effect on microstructure and magnetic behavior of acquired sample. A pause of 30 min was performed to escape extravagant heating through milling. Meanwhile, the direction of rotation was changed from clockwise to counter clockwise subsequently by every 1 h to ensure uniform mixing of these elemental powders. The XRD measurement was taken using Xpert-Pro Panalytical (Malvern, United Kingdom) diffractometer having Cu target (λ = 0.154060 nm). The range of 2θ (degrees) values was taken from 20 to 90° at RT to investigate the phase formation during the MA process. The lattice parameter was calculated experimentally by selecting 40 kV operating voltage and 40 mA operating current in XRD instrument. Deconvolution of overlapped peak was performed using the Lorentzian function. Further, the Scherrer formula and Williamson–Hall method were used to determine the crystallite size and lattice strain, respectively. The instrumental error was corrected using the single-crystal silicon sample. Surface morphology evolution and secondary electron (SE) images were captured after consequent milling time (10 min, 5 h, 15 h, 20 h, and 25 h) using field-emission scanning electron microscopy (FE-SEM) [Nova Nano FE-SEM 450 (FEI), Netherlands], whose functional voltage was sustained at 15 kV. Around 2–3 mg of powders was taken subsequently at distinctive intervals of milling time and then it is diffused in an ethanol followed by ultrasonication for about 1 h. For SEM analysis, the dispersed solutions were released on a carbon tape and allowed the ethanol to evaporate. Transmission electron microscopy (TEM) was performed using Technic20 FEI (Munich, Germany) operating on 200 kV. FeCoNi(Mg–Si)x (x = 0.5, 0.75, 1.0) HEA powders, obtained after 25 h of milling process, were used for TEM analysis. About 1 mg of powder was dispersed in an absolute ethanol and ultrasonicated for about 1 h. The top layer solution about 20 µL was released on a carbon-coated copper grid plate for TEM study, subsequently the ethanol gets evaporated. TEM bright-field images and SAED pattern were taken to confirm the nanocrystalline behavior of the powder samples. The magnetic behavior of the as-milled powder, which is obtained after 25 h of MA, was studied using a Lakeshore vibrating sample magnetometer (VSM) Princeton at Rajasthan University, Jaipur. The functional frequency, maximum current, and testing temperature were selected at 82 Hz, 30 A, and 270 °C, respectively. Magnetic saturation (M s), initial permeability (µi), coercivity (H c), and maximum energy product (BH) of FeCoNi(Mn–Si)x (x = 0.5, 0.75, 1.0) HEAs were obtained from the hysteresis plot of respective powder samples.
Simulation by COMSOL Multiphysics software
Simulation work is accomplished by means of FEM-based software, i.e., COMSOL Multiphysics software, to know the application characteristics of soft magnetic material as a transformer core [Reference Silva, Meunier and Foggia37]. Furthermore, it has also been correlated with the currently used silicon steel as a transformer core. In this process, we design whole transformer in COMSOL Multiphysics software [Reference Neubert, Bödrich and Disselnkötter51, 52]. The model contains a primary coil, a secondary coil, and ferromagnetic transformer core. In this model, we have assumed that primary and secondary coil consists of thin wire and multiple turns. It was also assumed that diameter of wire was smaller than the skin depth so that there were various turns. These windings were modeled with Multi-Turn Coil Domain features. The primary winding relates to primary resistance (R p) and the source voltage (V ac), and the secondary winding relates to secondary resistance or load resistance (R s) (shown in Fig. A1 as a Supplementary material)
To examine the special effects of local core saturation at high current amplitudes, the nonlinear B-H curve characteristic of the core material has taken into account. In this case, a high permeability silicon iron alloy is selected, and based on the VSM data of FeCoNi(Mn–Si)x (x = 0.5, 0.75, 1.0) HEAs, subsequent B-H curves have been plotted separately (shown in Fig. A2 of Supplementary material).
The operation of the transformer has been characterized by the strong dynamic interaction between the magnetic system and the electrical circuit, which was connected by primary and secondary windings [Reference Neubert, Bödrich and Disselnkötter51, Reference Bödrich, Neubert and Disselnkötter53]. The induced supply voltage in the primary coil and induced output voltage in secondary coil for step-down transformer has been determined using COMSOL software (please refer Fig. A3 of Supplementary material). The materials considered for the transformer core were FeCoNi(Mn–Si)x (x = 0.5, 0.75, 1.0) HEAs, which have been compared with the existing soft iron core material [Reference Neubert, Bödrich and Disselnkötter51, 52]. The input voltage was taken as 25,000 V and the output voltage was 250 V in the case of the present study.
Supplementary material
To view supplementary material for this article, please visit https://doi.org/10.1557/jmr.2019.34.
Acknowledgment
Authors are thankful to BRNS Project No. 34/20/01/2014-BRNS-0339, Mumbai (India), for financial assistance.