INTRODUCTION
The Neuropsychological Assessment Battery (NAB, Stern and White, Reference Stern and White2003a) is a relatively new comprehensive test battery that assesses five cognitive domains: Attention, Language, Memory, Spatial, and Executive Functions. This test has several advantages including the use of a single normative sample to ensure that differences in a patient’s performance across domains can be attributed to true relative strengths and weaknesses without the confound of using different normative samples between tests. No published studies have presented data across all five NAB modules in a clinical population except for some clinical samples presented in the technical manual (White and Stern, Reference White and Stern2003), although several studies have presented data on the screening module or on individual subtests (Brown et al., Reference Brown, Stern, Cahn-Weiner, Rogers, Messer and Lannon2005; Gavett et al., Reference Gavett, Poon, Ozonoff, Jefferson, Nair and Green2009; Grohman & Fals-Stewart, Reference Grohman and Fals-Stewart2004; Temple, Zgaljardic, Abreu, Seale, Ostir, & Ottenbacher, Reference Temple, Zgaljardic, Abreu, Seale, Ostir and Ottenbacher2009). Furthermore, one recent study (Iverson, Williamson, Ropacki, & Reilly, Reference Iverson, Williamson, Ropacki and Reilly2007) found surprisingly low levels of neuropsychological deficits in a mixed neurological sample in the NAB Screening module, suggesting that further investigation of the NAB’s sensitivity to neurological damage is warranted.
Stroke is a common neurological diagnosis, which is easily verified by neuroimaging; this population is therefore well suited to examination of the ability of a test battery to detect cognitive deficits secondary to neurological insult. To date, there have been no studies that have examined the NAB’s ability to detect deficits typically seen after unilateral stroke. The clinical samples presented in the NAB technical manual include data from the NAB Screening and Language Modules in patients with aphasia; it is not specified how many of those participants were status post-stroke. Cognitive deficits are common following stroke, with prevalence rates of dementia ranging from 6 to 30% and prevalence rates of cognitive impairment without dementia ranging from 24 to 72% three to eighteen months post-stroke (Barba, Martinez-Espinosa, Rodriguez-Garcia, Pondala, Vivancos, & Del Ser, Reference Barba, Martinez-Espinosa, Rodriguez-Garcia, Pondal, Vivancos and Del Ser2000; Desmond et al., Reference Desmond, Moroney, Paik, Sano, Mohr and Aboumatar2000; Linden, Skoog, Fagerberg, Steen, & Blomstrand, Reference Linden, Skoog, Fagerberg, Steen and Blomstrand2004; Madureira, Guerreiro, & Ferro, Reference Madureira, Guerreiro and Ferro2001; Rasquin, Lodder, Ponds, Winkens, Jolles, & Verhey, Reference Rasquin, Lodder, Ponds, Winkens, Jolles and Verhey2004; Sachdev et al., Reference Sachdev, Brodaty, Valenzuela, Lorentz, Looi and Berman2006; Srikanth et al., Reference Srikanth, Anderson, Donnan, Saling, Didus and Alpitsis2004; Stephens et al., Reference Stephens, Kenny, Rowan, Allan, Kalaria and Bradbury2004). Studies applying a comprehensive battery of neuropsychological tests in patients with stroke in both acute and chronic phases have emphasized the need for routine cognitive testing following stroke to detect cognitive deficits that may be otherwise overlooked and that could inform rehabilitation strategies and management decisions (Hom & Reitan, Reference Hom and Reitan1990; Jaillard, Naegele, Trabucco-Miguel, LeBas, & Hommel, Reference Jaillard, Naegele, Trabucco-Miguel, LeBas and Hommel2009; Sachdev et al., Reference Sachdev, Brodaty, Valenzuela, Lorentz, Looi and Wen2004). Surprisingly, few recent studies have examined the classification accuracy of cognitive deficits in patients with chronic stroke. Furthermore, none have used a comprehensive neuropsychological battery with the same normative sample across all domains and with demographically corrected scores. Thus, the primary aim of this study is to assess the classification accuracy of the NAB Total score and its cognitive domains in a chronic stroke sample with unilateral damage.
In addition to coordinated normative data, another potential advantage of using a single comprehensive neuropsychological battery is the ability to derive a summary score. Summary scores from neuropsychological tests are sensitive to brain damage and provide a simple unitary measure to examine global cognitive functioning (Hom & Reitan, Reference Hom and Reitan1990; Iverson, Mendrek, & Adams, Reference Iverson, Mendrek and Adams2004; McKay, Wertheimer, Fichtenberg, & Casey, Reference McKay, Wertheimer, Fichtenberg and Casey2008). However, Heaton and colleagues (Reference Heaton, Grant, Butters, White, Kirson and Atkinson1995) have raised concerns about possible attenuation of sensitivity of such summary scores when high and low scores are averaged, which may be particularly problematic in stroke patients with focal lesions and focal deficits. This approach has proven useful in HIV-positive individuals across disparate test batteries and it has shown excellent agreement with gold-standard clinical ratings of impairment (Carey et al., Reference Carey, Woods, Gonzalez, Conover, Marcotte and Grant2004; Gonzalez et al., Reference Gonzalez, Heaton, Moore, Letendre, Ellis and Wolfson2003). Because the NAB Total score may be affected by this limitation, a secondary aim of this study was to compare the NAB Total score with the Global Deficit Score (GDS) derived from the NAB (Carey et al., Reference Carey, Woods, Gonzalez, Conover, Marcotte and Grant2004; Heaton et al., Reference Heaton, Grant, Butters, White, Kirson and Atkinson1995; Heaton, Miller, Taylor, & Grant, Reference Heaton, Miller, Taylor and Grant2004). Finally, neurologists traditionally look at physical deficits following stroke but residual cognitive symptoms may be just as common as residual physical symptoms (Hom & Reitan, Reference Hom and Reitan1990; Jaillard et al., Reference Jaillard, Naegele, Trabucco-Miguel, LeBas and Hommel2009; Sachdev et al., Reference Sachdev, Brodaty, Valenzuela, Lorentz, Looi and Wen2004) and may have equal or greater impact on more complex everyday tasks (Stricker, Sadek, Leiphart, Stapp, & Haaland, Reference Stricker, Sadek, Leiphart, Stapp and Haaland2009). Cognitive deficits also have the potential for clinical prediction of functional outcome when detected acutely, particularly impairments in executive functions (Lesniak, Bak, Czepiel, Seniow, & Czlonkowska, Reference Lesniak, Bak, Czepiel, Seniow and Czlonkowska2008; Nys et al., Reference Nys, van Zandvoort, de Kort, van der Worp, Jansen and Algra2005). Surprisingly few, if any, studies have compared the classification accuracy of physical and cognitive deficits post-stroke, which was another secondary aim of this study. Therefore, we compared the classification utility of the NAB Total score and a common physical symptom of stroke, residual upper extremity functioning in contralateral and ipsilateral arms.
In summary, this study had a primary aim and two secondary aims. The primary aim was to evaluate the diagnostic accuracy of the NAB in detecting cognitive deficits in patients with chronic stroke with unilateral hemisphere damage and age-, education-, and sex-matched healthy control (HC) participants. Secondary aims were to compare the clinical utility of different summary score methods and of motor versus cognitive measures. We hypothesized that (1) the stroke group would be impaired relative to the HC group on the NAB Total score, each of the domain scores, and a motor composite score; (2) the GDS would be more sensitive to detection of impairment in patients with stroke than the Total NAB score; and (3) the sensitivity of cognitive and motor measures to stroke would be comparable. To provide clinically useful information, ROC curves are presented to demonstrate optimal cutoff scores between these two groups, and classification statistics are presented at different levels of clinical impairment.
METHOD
Participants
Forty-two right-handed patients with unilateral left (n = 24; LHD) or right (n = 18; RHD) hemisphere damage and 36 right-handed healthy control subjects participated in the study. The institutional review board of the NMVAHCS at the University of New Mexico School of Medicine approved the study according to the Helsinki Declaration, and informed consent was obtained from each participant. Patients were included in the study if they had a radiologically confirmed stroke that damaged either the right or left hemisphere. All patients were at least 6 months post-stroke at the time the NAB was administered, and the majority were several years post-stroke (median years post-stroke = 6.9; see Table 1). All but two had damage to the cerebral cortex. Fourteen had both subcortical and cortical involvement, and the remaining patients with stroke had damage exclusively in the cerebral cortex (with the exception of the centrum semiovale). The majority of strokes were in the territory of the middle cerebral artery (89% of RHD group; 92% of LHD group; see Table 1). The percentage of patients with stroke with anterior, posterior, or both anterior and posterior damage relative to the central sulcus was 24%, 37% and 39%, respectively. Exclusion criteria included (1) neurological diagnosis other than stroke; (2) neuroradiological evidence of damage to the cerebellum or brain stem, extensive periventricular white matter changes, or significant cortical atrophy based upon the opinion of a radiologist; (3) history of or current major psychiatric diagnosis (e.g., psychosis, major depression); (4) hospital admission for substance abuse or dependence in the last 10 years, or (5) peripheral neurological disorders affecting sensation or movement of the upper extremities. History and current symptoms in the stroke group were obtained by review of medical record and self- or collateral report. The control participants were recruited by newspaper advertisement and advertisements posted in the community. Based on self-report, control participants were excluded for the same reasons as the stroke patients as well as any evidence of stroke.
Mean (standard deviation) and frequencies for demographic variables

Note
MCA = middle cerebral artery.
Neuropsychological Assessment Battery
The NAB is a reliable and valid battery of tests designed to assess the cognitive functioning of adults from age 18 to 97 (Stern and White, Reference Stern and White2003a). The test is composed of a screening module and five other domain-specific modules (attention, language, memory, spatial, and executive functioning). Each of the five domain-specific modules was administered to each participant. The screening module was not administered. The NAB normative sample is comprised of 1448 participants. Normative scores are corrected for age, education and sex. Demographically adjusted T-scores (subtests) and standard scores (domain scores and total score) were derived for all subjects using published normative data (Stern and White, Reference Stern and White2003b). The NAB technical manual (White and Stern, Reference White and Stern2003) describes that, to calculate the NAB Total Score, primary T-scores within each domain are first combined to create domain index scores, and then each domain contributes equally to the NAB Total Score.
A GDS was calculated using all 31 T-scores that comprise the NAB Total score (see White & Stern, Reference White and Stern2003 p. 84). Each of these demographically adjusted T-scores was assigned a weighted deficit score ranging from 0 to 5, depending on the level of impairment using the classification system described by Heaton, Miller, Taylor & Grant (Reference Heaton, Miller, Taylor and Grant2004; 0 if ≥ 40, 1 if 39–35, 2 if 34–30, 3 if 29–25, 4 if 24–20 and 5 if ≤ 19). Next, all weighted scores were averaged to yield the GDS. With 31 subtests scores comprising this measure, approximately 16 points would be needed for a GDS average of .5. This may be reached by “severe” impairments on a few subtests or by mild impairment on approximately half (16) of the subtests. Conversely, using a GDS cutoff of .25, eight mildly impaired subtests would be required. One limitation of the current approach to calculating the GDS is that to fairly compare the performance of the GDS and the Total NAB score, all subtests comprising the domain index scores and the NAB Total Score were used to calculate the GDS. Unfortunately, the number of T-scores comprising each domain varies from four to ten depending on the domain in question. Thus, the GDS calculated in this way gives unequal weight to deficits in domains with more subtests, particularly the Attention and Memory domains.
Other Measures
A motor composite was calculated by averaging T-scores for both right and left hands across three motor tests (Finger Tapping, Grip Strength, Grooved Pegboard; Heaton et al., Reference Heaton, Miller, Taylor and Grant2004). Although contralateral motor deficits are most prominent following stroke, we chose to average performances across both hands because this measure provided better psychometric properties (due to floor effects of contralateral motor scores in patients with hemiparesis) and allowed for an equivalent measure across HC and stroke groups. Importantly, highly similar results for group comparison and classification statistics were achieved with the average motor composite and use of a contralateral average for patients with stroke.
Hemiparesis was defined as contralateral grip strength 1.5 SD below normal (T = 50) and ipsilateral-contralateral grip strength greater than 1.5 SD. Visual neglect in the stroke group was defined as a greater number of errors than the worst control subject in the contralesional hemispace only in a line cancellation task, and limb apraxia was based on gestural imitation deficits 2 SD below published normative data (Haaland, Harrington, & Knight, Reference Haaland, Harrington and Knight2000).
Lesion Reconstruction Methods
Magnetic resonance images (MRI) or computed tomography (CT) of the head were obtained at least 3 months post-stroke (except for one patient who was scanned at 11 weeks post-stroke) and near the time of testing unless the patient had a previous research image with no report of additional stroke. CT scans were obtained in 4 of the stroke patients who had medical contraindications for MRI. A description of the lesion reconstruction method has previously been reported (Haaland, Prestopnik, Knight, & Lee, Reference Haaland, Prestopnik, Knight and Lee2004; Rinehart, Singleton, Adair, Sadek, & Haaland, Reference Rinehart, Singleton, Adair, Sadek and Haaland2009).
Statistical Analyses
The χ2 analysis was used to test for differences across groups on categorical variables (sex). A 5 (NAB domain, within subjects) × 2 (group, between subjects) multivariate analysis of variance (ANOVA) was conducted to examine whether the pattern of group differences varied across the five NAB modules; tests of the simple effect of group were conducted at each level of NAB domain using independent samples t tests when the NAB domain x group interaction was significant. Independent sample t tests were also conducted to examine group differences on overall NAB performance for both NAB Total score and GDS and on age and education. Cohen’s d effect sizes were calculated for all measures. Receiver operating characteristic (ROC) curves were calculated to examine the overall diagnostic utility of each measure. ROC curves plot the sensitivity [i.e., (total number of true positive – in this case stroke participants who are accurately categorized)/(total number of actual stroke participants)] on the Y-axis and one minus the specificity [i.e., (total number of true negatives – in this case healthy participants who are accurately categorized)/(total number of actual healthy participants in the sample)] on the X-axis (Hanley & McNeil, Reference Hanley and McNeil1983). As the test moves from being overly conservative (i.e., setting the deficit needed for stroke categorization very high) to overly liberal (i.e., setting the deficit needed for stroke categorization very low), the sensitivity increases, but the specificity decreases (i.e., one minus the specificity increases). The following values were derived from the stroke and HC groups: sensitivity, specificity, overall correct classification (OCC), and odds ratio (OR). These values were derived at cutoffs of 1, 1.5, and 2 standard deviations below the mean, corresponding to standard scores of 85, 78, and 70, respectively, for NAB Total and Domain scores and corresponding to T-scores of 40, 35, and 30 for the motor composite. Values were also derived for GDS cutoffs of .25, .5, 1, and 1.5.
RESULTS
Participant Characteristics
The stroke and control groups did not differ in age (t 76 = −.28; p = .78), years of education (t 76 = 1.33; p = .19), or sex ratio ( ; p = .17; see Table 1). Refer to Table 1 for the incidence of hemiparesis, visual neglect (cancellation test), and limb apraxia (Haaland & Flaherty, Reference Haaland and Flaherty1984; Haaland et al., Reference Haaland, Harrington and Knight2000).
Group Comparisons
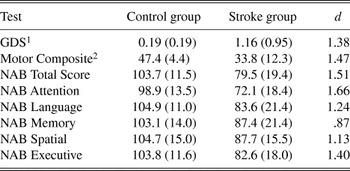
Independent samples t tests showed that the stroke groups performed significantly below that of the healthy control group for the motor composite (t 76 = 6.27; p < .001), NAB Total score (t 76 = 6.56; p < .001), and GDS (t 76 = −5.98; p < .001). See Table 2. To assess if stroke group deficit varied across specific NAB domains, we conducted a multivariate ANOVA treating the five domains as within-subjects factors and group (i.e., control vs. stroke) as a between subjects factor. The analysis revealed a main effect of group (F 1,76 = 4.5; p < .001) and a main effect of domain (F 4,73 = 13.7; p < .001), which were qualified by an interaction between group and NAB domain (F 4,73 = 3.2; p = .02). In other words, the control group scored higher than the stroke group in general, but the differences (i.e., stroke deficits) varied significantly across NAB domains. We next conducted independent samples t testsFootnote 1 comparing stroke and control groups at each NAB domain. Although the control group performed better than the stroke group for all five domains (all p’s < .001), the magnitudes of the differences measured using a standardized mean difference (Cohen’s d) varied from a minimum of .87 on the Memory domain to a maximum of 1.66 on the Attention domain.
Mean (standard deviation) and effect size for summary and domain index scores and the motor composite

Note
All group differences were significant (p < .001).
1 GDS = Global Deficit Score as defined by Heaton et al. (Reference Heaton, Miller, Taylor and Grant2004).
2 Calculated by averaging T-scores for both right and left hands across three motor tests (Finger Tapping, Grip Strength, Grooved Pegboard; Heaton et al., Reference Heaton, Miller, Taylor and Grant2004).
Classification Statistics
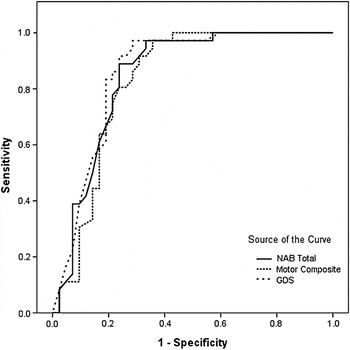
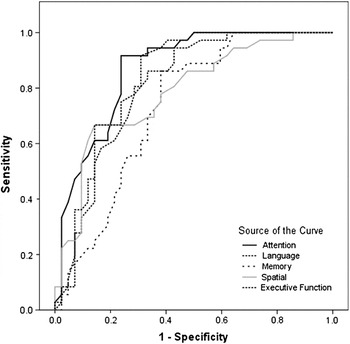
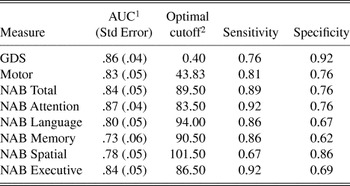
We used SPSS 15.0 to plot ROC curves and derive AUC (area under curve) estimates and standard errors (see Figures 1 and 2). The AUC statistic indexes the overall diagnostic utility of a measure, and the standard errors allow for hypotheses to be tested regarding differential diagnostic utility between instruments. An AUC of .50 suggests that a test categorized individuals no better than random assignment to condition using the known prevalence of a condition. Judged by published criteria (Fischer, Bachmann, & Jaeschke, Reference Fischer, Bachmann and Jaeschke2003), in which AUCs between .50 and .70 are low, AUCs between .70 and .90 are moderate, and AUCs over .90 are high, we found all measures to have moderate diagnostic effectiveness (see Table 3). However, the AUCs ranged from a minimum of .73 (the NAB memory domain) to a maximum of .87 (the NAB attention domain), suggesting some differentiation in their utility. Following procedures proposed by Hanley and McNeil (Reference Hanley and McNeil1983), we next performed hypothesis tests for differences in AUCs. This procedure examines the ratio of difference in AUCs to pooled standard errors adjusted for covariance between measures, and is compared to critical Z values. We tested for differences between the following pairs of measures: Total NAB and GDS; Total NAB and motor composite; Total NAB and Attention; Total NAB and Executive; Attention and Memory; Attention and Executive; and Memory and Executive. The Spatial and Language subtests were not included due to possible attenuation of classification ability by collapsing across hemispheric groups. Only the AUCs for the Attention and Memory domains (Z = 2.57), and the Executive and Memory domains (Z = 2.14), differed at the p < .05 level (all other Z’s < 1.0); the Attention and Executive domains had a significantly higher AUC than the Memory domain. We also estimated the optimal point at which to classify individuals for each test by calculating the Euclidean distance between perfect diagnosis (i.e., specificity and sensitivity values of 1) and the observed points on the ROC curve. The minimum distance between perfect classification and classification at various cutoffs is the point at which accuracy is maximized. AUC values, optimal cutoffs and associated specificity and sensitivity are listed in Table 3.
Receiver operating curves for Neuropsychological Assessment Battery (NAB) total score, motor composite, and Global Deficit Score.

Receiver operating curves for Neuropsychological Assessment Battery (NAB) domain scores.

ROC derived AUC and optimal cutoffs

Note
ROC = receiver operator curve; GDS = Global Deficit Score; AUC = area under the curve.
1 AUC values reflect the overall diagnostic effectiveness of a test. AUCs between .50 and .70 are low, AUCs between .70 and .90 are moderate, and AUCs over .90 are high (Fischer et al., Reference Fischer, Bachmann and Jaeschke2003).
2 Optimal cutoffs reflect the score at which maximum diagnostic accuracy is met. Test sensitivity and specificity are provided at these cutoffs.
To investigate whether NAB summary statistics accounted for additional variance in the classification of HC and stroke groups, we conducted binary logistic regression and compared a model with the motor composite alone as a predictor to a second model with a NAB summary statistic (GDS or Total NAB) added. The model with group (HC or stroke) as the dependent variable and motor composite as the independent variable yielded an overall classification rate of 78.2% (sensitivity = 71.4; specificity = 86.1; model Nagelkerke R 2 = .47; χ2 = 33.49; p < .001). The addition of GDS in the second step of the model yielded a significant χ2 change in model 2 versus model 1 (χ2 = 14.26; p < .001) and the full model yielded an overall classification rate of 80.8% (sensitivity = 73.8; specificity = 88.9; model Nagelkerke R 2 = .61; χ2 = 47.75; p < .001), with both motor composite and GDS significantly related to group membership (p’s < .05). Similarly, the addition of the Total NAB score in the second step of the model yielded a significant χ2 change in model 2 versus model 1 (χ2 = 10.55; p = .001) and the full model yielded an overall classification rate of 79.5% (sensitivity = 71.4; specificity = 88.9; model Nagelkerke R 2 = .58; χ2 = 44.04; p < .001), with both motor composite and Total NAB significantly related to group membership (p’s < .05). Running the analyses with the NAB summary statistic in the first model and the motor composite in the second model yielded similar results, with the majority of the classification occurring with the initial variable entered into the model, and then a small but significant amount of additional variance accounted for by the variable entered in the second model.
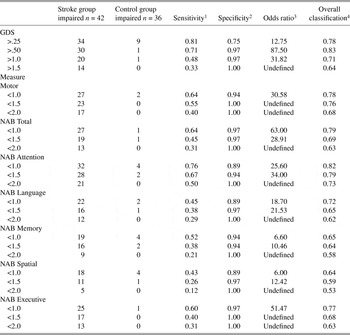
We next examined the sensitivity (i.e., ratio of correctly diagnosed stroke participants to total stroke participants), specificity (i.e., ratio of correctly diagnosed control participants to total control participants), overall classification rate (i.e., ratio of correctly classified participants to total participants), and odds ratios (i.e., odds of being a stroke participant if classified as stroke divided by odds of being a stroke participant if classified as healthy) at different clinical cutoffs (see Table 4).
Number of participants in stroke and control samples that were impaired at different clinical cutoffs with corresponding classification statistics

Note
NAB = Neuropsychological Assessment Battery; GDS = Global Deficit Score.
1 Sensitivity indicates the proportion of stroke participants who are classified in the stroke group.
2 Specificity indicates the proportion of control participants who are classified in the control group.
3 Odds ratios indicate the odds of being classified as impaired for the stroke group divided by the odds of being classified as impaired for the control group at different cutoffs. Undefined odds ratios occur when the denominator of the odds ratio is zero (i.e., none of the control participants are classified as impaired).
4 Overall classification indicates the proportion of total participants that are correctly classified into either the control or stroke groups.
DISCUSSION
The current findings support the clinical utility of the NAB in detecting cognitive impairment in patients with a history of unilateral stroke. Consistent with our hypotheses, our chronic stroke sample performed significantly poorer on the NAB Total score, GDS and all NAB domain index scores compared with a healthy control group and all effect sizes were large by Cohen’s convention (Cohen, Reference Cohen1988). As expected, the stroke group also demonstrated significantly poorer performance on a composite motor score.
Consistent with our predictions and with findings in the literature that suggest summary scores from neuropsychological tests are sensitive to brain damage (Hom & Reitan, Reference Hom and Reitan1990; Iverson et al., Reference Iverson, Mendrek and Adams2004; McKay et al., Reference McKay, Wertheimer, Fichtenberg and Casey2008), the NAB Total score was sensitive to generalized cognitive deficits after unilateral stroke. A similar pattern of results was seen for the Attention and Executive domain scores, likely because these measures represent generalized cognitive functions (Hom & Reitan, Reference Hom and Reitan1990) that are dependent on both cerebral hemispheres. These two domains performed comparably to the NAB Total score in overall classification ability determined by AUC. Planned comparisons of AUCs further revealed that the Attention and Executive domains had greater classification utility than the Memory domain. These results are similar to those of Iverson et al. (Reference Iverson, Williamson, Ropacki and Reilly2007) who showed the greatest effects within these two index scores on the NAB Screening Module in a mixed neurological sample. These findings are also in agreement with numerous studies that have found that these domains are frequently impaired in samples status post-stroke or with vascular cognitive impairment (Hachinski et al., Reference Hachinski, Iadecola, Petersen, Breteler, Nyenhuis and Black2006; Sachdev et al., Reference Sachdev, Brodaty, Valenzuela, Lorentz, Looi and Wen2004; Stephens et al., Reference Stephens, Kenny, Rowan, Allan, Kalaria and Bradbury2004). Of note, working memory and speed of information processing are also frequently reported to be impaired in these samples, both of which are represented in the Attention and Executive domains in the NAB. Despite the differences in AUC seen with pairwise comparisons, all of our primary measures showed moderate diagnostic effectiveness based on AUC value (Fischer et al., Reference Fischer, Bachmann and Jaeschke2003).
Inconsistent with our hypothesis, the NAB Total score and the GDS showed similar classification properties, although the NAB Total score appeared to be less specific than the GDS when using ROC-derived “optimal” cutoffs. When comparing the GDS cutoff of 0.5 recommended by Heaton et al. (Reference Heaton, Miller, Taylor and Grant2004) with a lenient clinical cutoff of < 1 SD for the Total NAB, the GDS shows somewhat better sensitivity, but equal specificities. These results provide support for both approaches to calculating global scores, but suggest that GDS may be somewhat more useful for clinical purposes when trying to detect subtle cognitive impairment. These results also further extend the external validity of the GDS, demonstrating that this is a valid approach in a test battery with no overlap with tests used in prior studies (Carey et al., Reference Carey, Woods, Gonzalez, Conover, Marcotte and Grant2004; Gonzalez et al., Reference Gonzalez, Heaton, Moore, Letendre, Ellis and Wolfson2003; Heaton et al., Reference Heaton, Miller, Taylor and Grant2004). One clinical benefit of the GDS approach is that it can be calculated even if all primary scores are not available, although we did not directly test the continued validity of this approach in the presence of missing data. NAB Total score and the motor composite also showed comparable classification rates, suggesting that cognitive dysfunction is as sensitive to neurological dysfunction as motor impairment. Because 90.5% of our stroke sample had middle cerebral artery territory strokes, the comparison of motor and cognitive classification utility may be biased. Follow-up analyses showed that even among this sample with a high prevalence of motor deficits, summary scores from the NAB accounted for additional variance even when motor composite was included in the model. Although the improvement in classification with the addition of the NAB summary statistic is small and seems to suggest that the NAB does not add much beyond the motor composite, running the analyses with the NAB summary statistic in the first model and the motor composite in the second model yields similar results, suggesting that both variables account for important variance alone, and account for a statistically significant but not clinically impressive additional amount of variance beyond the other variable. More importantly, the comparison of the ability of motor and cognitive tests to classify groups is a secondary aim because it is very rare to use either measure alone to “find the lesion” now that neuroimaging techniques have made this aim rather obsolete. The ability of a neuropsychological test battery to detect cognitive deficits in a chronic stroke population is important because, unlike motor deficits, these cognitive sequelae often go undetected without neuropsychological testing and have been shown to have important prognostic and treatment implications (Jaillard et al., Reference Jaillard, Naegele, Trabucco-Miguel, LeBas and Hommel2009). In addition, our group has demonstrated that cognitive deficits as detected by the NAB may have equal or greater impact on performance-based measures of everyday functioning compared with motor deficits in a sample that overlaps with the present study (Sadek, Stricker, Adair, & Haaland, Reference Sadek, Stricker, Adair and Haaland2010; Stricker et al., Reference Stricker, Sadek, Leiphart, Stapp and Haaland2009). Similar to previous studies (Hom & Reitan, Reference Hom and Reitan1990; Jaillard et al., Reference Jaillard, Naegele, Trabucco-Miguel, LeBas and Hommel2009; Sachdev et al., Reference Sachdev, Brodaty, Valenzuela, Lorentz, Looi and Wen2004), these results show that neuropsychological assessment is an important aspect of post-stroke clinical care and suggests that the NAB may be a useful tool in this regard.
Qualitative inspection of the derived classification statistics raises several issues. First, derived optimal cutoffs from AUC analyses for our sample suggest surprisingly lenient cutoffs based on normative standards. Specifically, with the exception of Attention, all optimal cutoffs do not reach one standard deviation below the population mean, and the “optimal” cutoff for the Spatial domain is just above the population mean of 100. Inspection of the number of patients impaired at different clinical cutoffs suggests that with the exception of the Attention domain, nearly one-third to half of our stroke sample is performing above the 1 SD clinical cutoff, depending upon the measure in question. For the Attention domain, only one-fourth of the stroke sample is performing above the 1 SD cutoff, again suggesting that this domain may be particularly sensitive to generalized cognitive deficits status post-stroke. These data also demonstrate that a proportion of our sample is performing within normal limits on the NAB and on the motor composite. Therefore, this sample may underestimate the sensitivity of the NAB to cognitive impairment. A similar point may be made about results from the study by Iverson et al. (Reference Iverson, Williamson, Ropacki and Reilly2007) that showed surprisingly low levels of neuropsychological deficits in a mixed neurological sample on the screening version of the NAB. Although their sample had documented “neurological impairment,” similar to ours, neither sample was comprised exclusively of individuals shown to have cognitive impairment or a cognitive disorder based on an independent measure or diagnostic standards. Higher classification statistics may be found in more homogeneous samples such as studying patients with right or left unilateral damage separately or patients with vascular cognitive impairment or specific types of dementia.
Limitations
This study has several limitations. The sample size was relatively small, limiting the scope of our analyses. For example, left versus right hemisphere stroke comparisons were not performed due to significant differences in the sex composition across these groups. Furthermore, the distribution of most strokes was within the middle cerebral artery, preventing further exploration by different vascular distributions and possibly biasing our comparison of the clinical utility of motor versus cognitive measures. Although our sample size is limited, the time demands required for administration of the full NAB is substantial and no other published studies investigating the NAB to date have administered the entire test battery. The data presented here facilitates comparing results of individual patients to a chronic stroke population. Unfortunately, the screening battery was not administered thus preventing a comparison between the screening and full batteries.
Sample characteristics likely contributed to these findings. Because our sample is composed of patients with unilateral stroke, collapsing across these hemispheric groups may attenuate the sensitivity/specificity of the Language and Spatial domain scores in particular. The Memory domain score may have been similarly affected because eight of the ten measures comprising this domain score reflect verbal memory skills. Our group is continuing to collect data and plans to focus more on laterality in future work by comparing patterns of performance between individuals with left versus right hemisphere damage following stroke. Furthermore, our sample is not well characterized in terms of vascular risk factors or incidence of vascular cognitive impairment with or without dementia using other measures besides the NAB, and healthy control participants did not undergo neuroimaging. It remains possible that at least some of the current results may reflect neuropsychological changes associated with vascular risk factors that may be overrepresented in the stroke sample, in addition to changes from the documented stroke. Alternatively, it is possible that some individuals in our control group may have had a silent, undocumented stroke or small vessel ischemic changes that may attenuate differences across groups. However, only 3–11% of our control sample performed below a conservative one standard deviation cutoff across NAB Total and domain scores, which is below the 15% rate expected by chance alone.
Summary and Clinical Implications
The results of this study suggest that the NAB is a useful clinical tool that is valid for detection of cognitive deficits in patients with a history of focal, unilateral stroke, although lenient clinical cutoffs may be necessary to optimize sensitivity. Specifically, these results support the NAB’s use of the interpretive ranges suggested by Heaton et al. (Reference Heaton, Miller, Taylor and Grant2004) and could be extended by also adopting Heaton’s deficit score approach (GDS). The GDS is as useful as the NAB Total score for the detection of stroke and may have advantages when impairment is expected to be subtle. The Attention domain appears to be particularly sensitive in a chronic stroke population. Like most neuropsychological tests, the NAB also has certain limitations. The NAB does not include any measures of motor functioning, thus clinicians will likely need to administer additional measures of motor and sensory functions from other test batteries in samples such as ours where motor impairment may be equally as sensitive to neurological insult as cognitive measures.
ACKNOWLEDGMENTS
This work was supported by the Department of Veterans Affairs (Rehabilitation Research and Development Merit Review grant B4125R and Clinical Services Research and Development Merit Review grant). The authors thank Dr. Robert T. Knight for neuroimaging consultation. The authors report no conflicts of interest. Dr. Thomas Hammeke acted as the editor for this study to avoid a conflict of interest because the senior author, Dr. Haaland, is the current editor-in-chief of JINS. Information in this manuscript and the manuscript itself has never been published either electronically or in print.