Introduction
The Trakehner warm blood breed is one of the oldest horse breeds in the world. The first foundation of a herd book society in Trakehnen (East Prussia) was initiated by King Friedrich Wilhelm I and was documented for the first time in 1732 (von Stenglin, Reference von Stenglin1994).
After the Second World War, the new Trakehner Breeding Association was founded in Hamburg in 1947. The founders of the new Trakehner breed were a few rescued mares and stallions (von Velsen and Schulte, Reference von Velsen and Schulte1981). From 1947 to 1989, the Trakehner Breeding association was divided into nine local breeding societies. After the reunification of Germany in 1990, the number of local alliances increased to ten. The central administration of the whole Trakehner breed is located in Neumünster.
The Trakehner Horse breed has been a partially closed population since the year 1732. Presently, the Thoroughbreds, Arab Horse breeds, Shagya- and Anglo-Arabian are used as breeding animals with consent from the breeding committee of the Trakehner Breeding Association (Trakehner Verband, 2006). The progenies of these matings are further registered, and performances recorded, and evaluated in a manner similar to Trakehner Horses.
An important step in the analysis of the population structure of the Trakehner Horse breed is a calculation of the effective population size (Ne). The effective population size quantifies genetic drift and the rate of inbreeding in a population. It is defined as the number of individuals in an ideal population that would give rise to the same variance of gene frequencies or the same rate of inbreeding as observed in the actual breeding population (Falconer and Mackay, Reference Falconer and Mackay1996). In breeding populations where no regular pedigree recording exists, Ne can be calculated by an approximate approach from census data only. Under quite general assumptions, Ne can be estimated only based on the number of breeding males (Nm) and the number of breeding females (Nf) (Wright, Reference Wright1931):

The calculation of the effective population size becomes increasingly complicated in populations where selection paths differ in number of animals, length of the generation intervals and where generations overlap. If pedigree data are available, it is therefore advisable to estimate the effective population size from the increase in inbreeding coefficients per time unit (e.g. generation) calculated from these pedigrees, as suggested by Wright (Reference Wright1931) (2):

The effective population size has been used as a key parameter in designing strategies for the definition and conservation of endangered animal species (Bijma et al., Reference Bijma, van Arendonk and Woolliams2001). The Food and Agriculture Organization of the United Nations (FAO) classifies breeds into seven categories for defining their status of being endangered. The categorisation is based on the overall population size, the number of breeding females and the trend in population size, i.e. whether the population size is increasing, decreasing or is stable, respectively (FAO, 1998).
The Federal Ministry of Food, Agriculture and Consumer Protection (BLE) developed the National Programme for Animal Genetic Resources. The effective population size of the Trakehner Horse breed is assumed to be Ne = 668.7 and the Trakehner Horse breed is classified into the category ‘observation population’, accordingly (Federal Ministry of Food, Agriculture and Consumer Protection, 2003). The estimate for effective population size was determined using formula (1) assuming conditions of an ideal population.
Studies from Meuwissen and Woolliams (Reference Meuwissen and Woolliams1994) revealed a fundamental relationship between the effective population size and inbreeding depression and the genetic variances of fitness traits, respectively. They concluded that the critical size for Ne, i.e. the size below which the fitness of the population steadily decreases, lies between 50 and 100 animals.
In a closed population, the effective population size depends on the number of animals selected to be parents in each year, the variance of the family size and the average generation interval. Decreasing numbers of breeding animals in the Trakehner Horse breed (Trakehner Verband, 2005) underline the need to manage the breeding population carefully in order to minimise inbreeding. Therefore, breeding schemes should only be optimised with respect to genetic gain when the rate of inbreeding is restricted simultaneously. Modern software tools for the optimisation of breeding schemes predict selection response and the rate of inbreeding resulting from breeding programs (Rutten et al., Reference Rutten, Bijma, Woolliams and van Arendonk2002).
In a population, inbreeding increases on average with the increase of the average coancestry. As stated by Wray and Goddard (Reference Wray and Goddard1994), Brisbane and Gibson (Reference Brisbane and Gibson1995) and Meuwissen (Reference Meuwissen1997), inbreeding will be limited by reducing the increase of average coancestry. Meuwissen (Reference Meuwissen1997) developed a selection method that maximised the genetic level of the selected parents. This also restricts the average coancestry and hence the average inbreeding coefficient in the next generation. This specific selection strategy is called ‘optimum contribution selection’ (Sonesson and Meuwissen, Reference Sonesson and Meuwissen2000).
The aim of this study was to analyse the population structure of the Trakehner Horse breed in terms of generation interval (separately for each of the four selection paths), the effective population size with different methods, the inbreeding rate over a specific period of time and the genetic contributions of the two most important breeds (xx, ox) to the current Trakehner Horse breed.
Material and methods
Central pedigree
The central pedigree of the Trakehner Breeding association was available for the analysis, totalling 36 620 animals. The central pedigree was characterised demographically and only Trakehner horses born between 1994 and 2005 were considered.
Generation interval
The generation interval is defined as the average age of the parents at birth of their selected offspring (Falconer and Mackay, Reference Falconer and Mackay1996). It was estimated by considering selected animals with performance records from official mare and stallion licensing, respectively. For each cohort, the average age of parents at birth of these offspring was calculated using the information provided by the pedigree of the actual breeding population. A final estimate was obtained as an unweighted average over all birth years, and over each of the four paths of selection, as (Hill, Reference Hill1979)

Effective population size
The analysis was based on 13 793 pedigree records selected from the main pedigree by starting with the actual breeding population (n = 6746) and including ancestors backwards until birth years before 1950 were reached. Ancestors of Trakehner Horses that were not Trakehner themselves were treated as base animals, as well as ancestors with birth years before 1950.
The length and completeness of a pedigree have an effect on the outcome of the calculations of the effective population size (Cothran et al., Reference Cothran, MacCluer, Weitkamp, Pfennig and Boyce1984). The length of pedigree of the actual breeding population was up to 10 generations, with an average of 2.9 complete equivalent generations analysed by using the ENDOG v4.5 program (Gutiérrez and Goyache, Reference Gutiérrez and Goyache2005). The pedigree structure of the actual breeding population contains missing ancestors. To compensate for missing data, different methods for the estimation of Ne were used. In the first approach, calculations were based on the numerator-relationship-matrix (NRM) with no correction of missing ancestries, and in the second approach, calculations were based on the uncertain-parentage-matrix (UPM) that assigns breeding animals of defined cohorts with defined probabilities to be the parents of animals with missing ancestry.
In the UPM method, the missing ancestries were corrected by using known sires and dams within a time frame of 5 to 15 years before the birth of the animal, as true parents with equal probability. Suppose that the ith individual has a number s of males (coded m 1,…mj,…,ms) as potential sires with probabilities of being the true sire (p1,…pj,…,ps), and the number d of females (coded f1,…fk,…,fd) as potential dams with corresponding probabilities (q1,…qk,…,qd). The (n, i) element is the covariance between the ith individual and a non-direct descendent n of the UPM (Pérez-Enciso and Fernando, Reference Pérez-Enciso and Fernando1992):

where Fi is the inbreeding coefficient of the ith individual.
The annual effective population size (Na) was estimated by the increase in average year-wise inbreeding coefficients (Fx) and the average coancestries (fxy) by calculating

where  is the estimated regression coefficient resulting from the regression of ln(1−Ft) on years and Ft are year-wise averages of inbreeding coefficients or coancestries, respectively. An estimate for the generation effective population size was then calculated using (see the Appendix)

For the preparation and analysis of all data, the statistic software program R (R Development Core Team, 2004) was used.
The ‘hockeystick’ regression method
Analysing the rate of inbreeding by the average coancestries, the single linear regression might be not adequate, because an obvious change in the slope could not be considered. For the ‘hockeystick’ regression, two basis functions were defined, where c marks the division between the two groups (Faraway, 2002):

Bl (x) and Br (x) form a first-order spline basis with an intercept at c, which was derived by visual inspection to be 1990. The intercept of this model is the value of the response at the join. The increase of inbreeding was estimated with the help of the ‘hockeystick’ regression method for two main periods (1959 to 1990) and (1990 to 2002).
Population stratification and foreign gene contributions
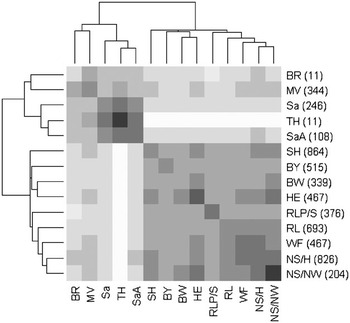
For analysing the population stratification of the Trakehner Horse breed, we allocated the mares of the actual breeding population to the several breeding societies (n = number of societies) on the basis of their local breeding code. We then estimated average coancestries within and between breeding societies using the same NRM as in the analysis of the effective population size. For the purpose of graphical representation (Figure 8), we used a customised version of the software package ‘heatmap’ (R Development Core Team, 2004).
For the calculation of genetic contributions of foreign breeds to the current breeding population, we calculated the matrix of gene contributions, sometimes also referred to as the design matrix of Mendelian sampling terms. By averaging off-diagonal elements between ancestors of the defined foreign breeds and the current population, we calculated the genetic contribution of that breed. Only gene contributions of Thoroughbreds (xx) and Arab Horse breeds (ox) were considered in those calculations, since these are the most important contributors to the current Trakehner Horse breed.
Results
Demographic structure and genealogical parameters
In the Trakehner Horse breed, 800 females per year are born on average with a decreasing tendency from 1994 to 2005. At the age of 3 years, 60% of the females are registered at a central mare conformation test and enter the breeding population. On average, about 29% of the mares in the conformation test reach 53 ‘overall points’, a sum of the seven selection traits. These mares meet the first condition of becoming a premium mare of the Trakehner breed. The second condition is finishing the performance test with a minimum rank of 7.5 or better. However, the conformation test for the mares cannot be considered a real selection step, as in general all females are accepted. Nevertheless, the conformation test is what differentiates a precious and normal breeding mare. The actual mare population consists of about 2400 active animals.
On average, 764 male foals were born every year, decreasing in numbers from 1994 to 2005. Two years after birth, on average 23% of these young stallions are presented and evaluated by the grading commission. Around 30% of these young stallions are selected and participate at the central stallion certification in Neumünster. From these, 30% are finally approved and certificated as breeding stallions judged by the official members of the grading commission.
The actual stallion population in the Trakehner Horse breed consists of around 248 stallions.
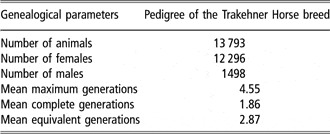
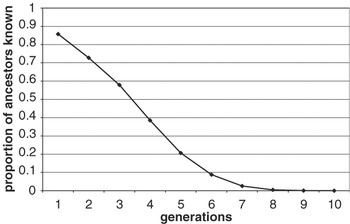
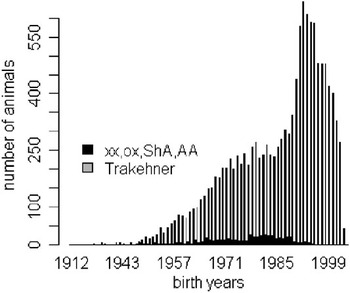
Main genealogical analyses were carried out using the ENDOG v4.5 program describing the genetic structure of the Trakehner Horse breed (Table 1) considering the pedigree of the actual breeding population. Additionally, the completeness of the pedigree for each horse has been measured by calculating the proportion of ancestors known in each ascending generation. Figure 1 describes the mean proportion of ancestors known in each ancestral generation. The number of Trakehner horses and reproductive animals from other breeds per year (xx = Thoroughbreds, ox = Arab Horse breed, ShA = Shagya-Arabian and AA = Anglo-Arabian) in the analysed studbook is shown in Figure 2. The actual breeding population was defined due to actual records of mares’ conformation tests and records from sires that were presented and evaluated at the central stallion certification in Neumünster. At central conformation tests, an average of 542 females were judged per year. About 50 sires/year were evaluated and 30% of these were finally proved and certificated as breeding animals.
Main genealogical parameters describing the pedigree used in the analysis of the Trakehner Horse breed

Average proportion of ancestors known by generation.

Number of Trakehner horses and reproductive animals from other breeds (xx = Thoroughbreds, ox = Arab Horse breed, ShA = Shagya-Arabian and AA = Anglo-Arabian) per birth year.

The year 2007 counts a total of 2296 inseminations in which 3.8% were Thoroughbreds and 1.1% were Arab Horse breeds (Annual Report of the Trakehner Breeding Association, 2008).
Generation interval
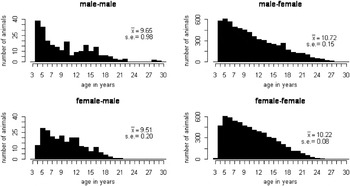
The estimates of the generation intervals and corresponding s.e. of mean are shown separately for each of the four selection paths in Figure 3. In the Trakehner Horse breed, the generation interval between stallions and their male and female offspring was longer than the corresponding intervals in mares. The shortest generation interval is observed in the selection of male offspring and the longest generation interval is calculated for the production of female breeding animals.
Distribution of the parents’ age at birth of offspring with performance records separately for each of the four paths of selection with their respective mean values and s.e.

The estimate of the average generation interval according to Formula 3 over all recorded years was calculated to be L = 10 ± 0.06 years.
Effective population size
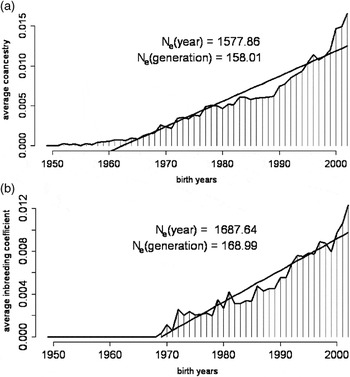
The effective population size (Ne) was estimated by the increase in average year-wise inbreeding coefficients and average coancestry. The estimate for the generation-wise effective population size was calculated by using the determined average generation interval of 10 years. The average increase of inbreeding analysed with the NRM method (1950 to 2002) is shown in Figure 4.
(a) Average coancestry calculated with the numerator-relationship-matrix (NRM) method for the years 1959 to 2002 and the results of the year-wise and generation-wise effective population size. (b) Average inbreeding coefficient calculated with the NRM method for the years 1969 to 2002 and results of the year-wise and generation-wise effective population size.

The increase of average coancestry is steadier than the increase of the average inbreeding coefficient in the next generation. The estimates of the generation-wise effective population size analysed by the increase of average coancestry were 158 effective animals and calculated using the increase of average inbreeding coefficient 169 effective animals, respectively. The increase of inbreeding evaluated with the UPM method (1950 to 2002) is shown in Figure 5.
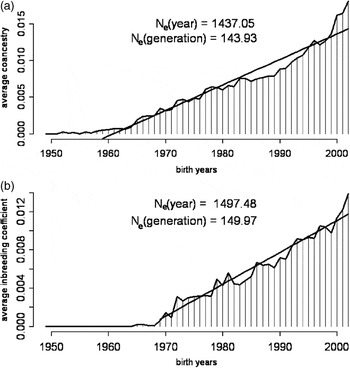
(a) Average coancestry calculated with the uncertain-parentage-matrix (UPM) method for the years 1959 to 2002 and results of the year-wise and generation-wise effective population size. (b) Average inbreeding coefficient calculated with the UPM method for the years 1969 to 2002 and results of the year-wise and generation-wise effective population size.

Estimates of the effective population size analysed with the average coancestry (Ne = 144) and the increase of inbreeding coefficient (Ne = 150) are nearly the same and varied only little using the UPM method. No major differences were found between the two method (NRM) and (UPM) with respect to the rate of increase in inbreeding, although the global levels by using the UPM method were higher.
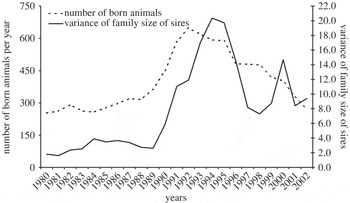
A closer inspection of the average coancestry indicates that the increase is higher from the year 1990 onwards compared to the time period 1959 to 1990. Therefore, a single linear regression coefficient over the whole observation period might not be adequate. Additionally, an increase of the variance of family size of sires (Figure 6) can be observed. This corresponds to the strong increase in the rate of inbreeding from the early 1990s onwards. A frequent use of specific stallions in the Trakehner Horse breed with a high number of progeny is observable in that time period.
Numbers of born animals per year and variance of family size of sires for the years 1980 to 2002.

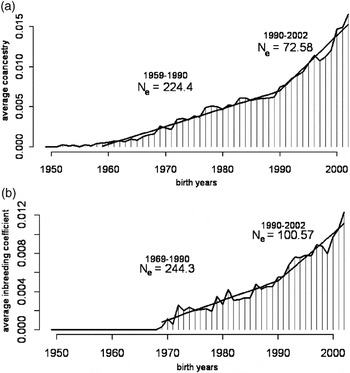
The stronger increase of average coancestry from the beginning of the 1990s is not completely reflected in the slope of the average inbreeding coefficient. This may be due to the time lag of one generation, up to the year 2000. A ‘hockeystick’ regression method was applied to estimate the effective population size from the coancestries. This was separated between the two periods and resulted in two adequate estimates for the effective population size (Figure 7a and b).
(a) Average coancestry calculated with the numerator-relationship-matrix (NRM) method (the ‘hockeystick’ regression method, 1959 to 2002) with an intercept in the year 1990. (b) Average inbreeding coefficient calculated with the NRM method (the ‘hockestick’ regression method, 1969 to 2002) with an intercept in the year 1990.

The generation-wise effective population size using coancestries of the first period, 1959 to 1990, is 224 and for the second period, 1990 onwards, it is 73 effective animals. The strong increment of average coancestry is equivalent to decreasing numbers of effective animals in the population.
Comparing the results of the ‘hockeystick’ regression method, the estimates of the effective population size from coancestries and from inbreeding coefficients (Ne = 224, 1959 to 1990 and Ne = 100, 1990 to 2002, respectively) now show a substantial difference that might be an indicator for a subdivided population (Figure 7a and b).
Population stratification
Based on that observation, we additionally analysed the average coancestry within and between the local breeding societies (East German states: BR = Brandenburg, MV = Mecklenburg-Vorpommern, Sa = Saxony, TH = Thuringia, SaA = Saxony-Anhalt; West German states: RLP/S = Rhineland-Palatinate/Saarland, BY = Bavaria, BW = Baden-Württemberg, HE = Hesse, SH = Schleswig-Holstein, RL = Rhineland, WF = Westphalia, NS/H = Lower Saxony/Hanover, NS/NW = Lower Saxony/North West). Figure 8 illustrates the genetic distances between the 14 local breeding societies. The dark nuances of the shades indicate a high, and the light nuances indicate a low value of average coancestry within and between the breeding societies. The figure reveals a genetically fragmented population with a separation directly corresponding to the former division of East and West Germany. A high genetic relationship exists between the breeding societies WF and NS/H. Genetic distances are also low between the next group RL, WF, NS/H and NS/NW. High genetic relationships within breeding societies were observable in TH, HE and NS/NW. These results provide additional evidence for a subdivided population.
Average coancestry within and between the 14 local breeding societies of the Trakehner Breeding association (number of animals).

Foreign gene contributions
The actual breeding population is influenced by Thoroughbreds and Arab Horse breeds. The average gene contribution of Thoroughbreds’ (xx) genes to the actual breeding population was calculated to be 19.5% based on the information provided by the central pedigree. The gene contribution of Arab Horse breed (ox) genes was calculated to be 0.89%. Considering only animals of the actual breeding population that actually are descendants of breeding animals of these two breeds, we calculated average gene contributions of 22.3% (xx) and 11.7% (ox).
Discussion
Generation interval and population structure
From a demographic point of view generation intervals computed for the Trakehner Horse breed are consistent with those reported for other races and riding horse breeds (Valera et al., Reference Valera, Molina, Gutiérrez, Gómez and Goyache2005). Moureaux et al. (Reference Moureaux, Verrier, Ricard and Mériaux1996) found an average generation interval of 9.7 years in Arab to 11.8 years in Trotteur Français. Other calculations reported for horse breeds such as Thoroughbred or Icelandic Toelter were 10.5 and 9.7 years, respectively (Langlois, Reference Langlois1980; Hugason et al., Reference Hugason, Arnason and Jónmundsson1985).
Large values of generation lengths in horses may not be solely biological supported by the fact that in many cases the intervals on the paternal side are generally larger than intervals on the maternal side. Longer generation intervals on the paternal side were also found by Moureaux et al. (Reference Moureaux, Verrier, Ricard and Mériaux1996) in some cases.
A more compelling reason for the long generation interval in the Trakehner Horse breed could be due to an absence of a clear-cut division between sporting career and breeding life. Some breeders prefer to send their young animals to sport and later into the breeding scheme, some horse holders breed only for recreational purposes while others use horses only for breeding. The long generation interval reduces genetic gain per time unit and is therefore a limiting factor in a breeding program (Kräußlich, Reference Kräußlich1994). Additionally, the long generation interval indicates that information about the performance results of progeny has a high importance in the selection process. To what extent this fact might influence the accuracy of selection is not yet clear.
The Trakehner Breeding Association does not solely consider the offspring for breeding, e.g. sires. All born fillies per cohort in the Trakehner Horse breed are regarded as potential breeding mares. Defining a female nucleus population with special qualifications and the condition to produce a foal in the first breeding year would decrease the average generation interval and therefore increase genetic gain per time unit.
In the male selection path, the selection intensity of becoming a member of the stallion book is higher than mares. Every male selection candidate has the opportunity of becoming a member of the stallion book, but not every candidate achieves the requirements of the grading commission to become a breeding stallion. Assuming three steps in the selection of stallions, the first step is likely a preselection of the breeder, because only 23% of the male foals are presented and evaluated by the commission. The private criteria of the breeders to preselect are still unknown. The second step is evaluated by the grading commission and monitored by the Federal Ministry of Food, Agriculture and Consumer Protection and consists of choosing stallions approved for breeding. The third step results from the horse holder’s choice to use these approved stallions. The criteria to choose one approved stallion are still unclear (Teegen et al., Reference Teegen, Edel and Thaller2008).
One assumes that modern insemination centres court the horse breeders and owners with offensive marketing strategies, so that stallions from these studs receive a better demand than others with rather the same quality.
Effective population size
The utilisation of two measures, one based on the average coancestry and one based on the inbreeding coefficient, analysed the population structure in an appropriate manner and helped to identify specific characteristics of the Trakehner Horse breed like population subdivision and changes in the breeding scheme.
For the estimation of the effective population size (Ne), additionally two different methods (the NRM and UPM methods) were applied. Using both methods together seemed to be a good general approach to analyse the effect of missing parentages and the effect of imports on the defined actual breeding population, although this approach revealed some limitations. In calculating the NRM, all matings with other breeds are regarded as gene flow out of the base (Pérez-Enciso, Reference Pérez-Enciso1995). Additionally, missing sires and dams are supposed to be unrelated to the defined actual breeding population (Pérez-Enciso and Fernando, Reference Pérez-Enciso and Fernando1992). This can affect the increase in inbreeding, and as a result, the estimated effective population size (Ne) might be overestimated. The estimates of Ne from this approach can be considered to be upper limits for the true but unknown values (Edel, 2006).
Pérez-Enciso and Fernando (Reference Pérez-Enciso and Fernando1992) commented that animals with unknown parents are very common in most breeding programs. Therefore, Caballero (Reference Caballero1994) suggested that estimations of Ne should account for missing parentages, e.g. by including probable parentages. For missing parentage in the UPM breeding animals, with defined probabilities can be assigned to be the parents of animals with missing ancestry. Missing pedigree data would decrease or even detach some relationships between animals and reduces the power of animal models in genetic evaluation. The effect of pedigree missing information depends on the rate of sire missing, the distribution of the pedigree between herds, the use of artificial insemination, the rate of dam missing and the depth of the pedigree (Nilforooshan et al., Reference Nilforooshan, Khazaeli and Edriss2008).
The approach, at least partially, compensates the effect of the depth of the pedigree. However, it is not strictly valid to interpret estimates analysed with the UPM method with probable parentage as lower limits, as suggested by Edel (2006). In our investigation, only minor differences were found between the results of Ne comparing the NRM and the UPM method. This might be due to the very low pedigree completeness with, on average, 2.9 equivalent generations. The UPM method applied here assumes that all known sires and dams within a certain time frame can be considered to be the true parent with equal probability. This is somewhat equivalent to the presumption of a binomial or the Poisson distributed family size that might not be given in the population. In fact, the observation that the variance of family size increases after 1990 is at least an indicator that this presumption underlying the UPM method, in our case, is not fully true. Additionally, the strong increase of the average coancestry in the beginning of the 1990s, and also the equivalent decreasing number of effective animals in the population, might also indicate a change in the breeding policy. Developments of reproductive techniques like the introduction of artificial insemination and the growing use of it in horse breeding might have contributed to the substantial increase in the rate of inbreeding also. A final conclusion may be that the increase is a combined effect, an artefact due to an increase in the pedigree depth on the one hand, and the consequence of a change of breeding policy with a growing use of artificial insemination affecting effective population size on the other. Nilforooshan et al. (Reference Nilforooshan, Khazaeli and Edriss2008) confirmed the assumption that the increase of average coancestry might be caused by the effect of artificial insemination and also by missing pedigree data.
In a large random mating population, one can expect that the average coancestry of a specific generation corresponds to the average inbreeding coefficient in the next generation (Caballero and Toro, Reference Caballero and Toro2000). A systematic deviation is therefore an indicator of non-random mating, e.g. assortative mating with respect to inbreeding or population subdivision.
Within both methods, no major differences were found between the results of Ne analysed with the average coancestry and average inbreeding coefficient. From these results alone, no evidence of a deviation from random mating is observable.
The closer inspection of the increase of the average coancestry over the whole period indicated that a single linear regression over the whole time period is not adequate. The steeper slope of the increase of average coancestry from 1990 onwards was modelled by the use of the ‘hockeystick’ regression resulting in two Ne estimates, one for each period. The difference of these two estimates within the two approaches (with respect to the average coancestry or the average inbreeding) again might be interpreted as a combined effect of growing pedigree completeness and a change of breeding policy. Comparing inbreeding and coancesties, the estimate of Ne = 224 (average coancestry – 1959 to 1990) and Ne = 100 (average inbreeding – 1990 to 2002) is now showing a deviation between ft and Ft +1, which indicates a deviation of random mating and possibly a subdivided population. The result that the Trakehner Horse breed is still a subdivided population is further supported by the results of our analyses of regionally clustered coancestries.
Population stratification and foreign gene contributions
Analysing additionally the average coancestry within and between the local breeding societies revealed that the population is genetically subdivided in the different breeding societies. Furthermore, the animals belonging to the former East German states could not compensate the increase of the inbreeding rate after reunification. Based on the result of effective population size, analysed by the average coancestry with the ‘hockeystick’ regression method (Ne = 73) one can assume that the actual effective population size is in fact lower because of the effect of the strong increase of average coancestry. But it is not yet observable in the average inbreeding coefficient due to the time lag of one generation. In a still subdivided population, the matings of some animals are more probable than with others. Thus, the average inbreeding coefficient of the next generation is higher than the average coancestry of the previous generation. We assume that the number of effective animals could be in a range of 50 to 60 animals.
Over the last few decades, a substantial contribution of Thoroughbreds to the actual breeding population was observed. Whereas the gene contribution of Arab Horse breed genes is comparatively low, the contribution of Thoroughbred genes is derived from the traditional point of view to breed mainly riding horses. Thoroughbreds, having good riding horse attributes, were used for the Trakehner warm blood breed in the past and in the future for improving conformation and performance traits. Some breeding objectives for Thoroughbreds are similar to the Trakehner breeding goal. Especially, the ‘type’ of Thoroughbreds can contribute to the Trakehner Horse breed.
A comparison of the discussed results and calculations from census data (Ne = 669) (Federal Ministry of Food, Agriculture and Consumer Protection (BLE), 2003) showed a large discrepancy. According to the assessment of the BLE (2003) for endangered breeds, e.g. if Ne is below 200, a conservation program should be launched as soon as possible.
An immediate action is advisable if the effective population size is below 50 and 100 animals in order to account for the decreasing trend of fitness of a population (Meuwissen and Woolliams, Reference Meuwissen and Woolliams1994). The achieved knowledge about reasons of the increase in inbreeding and of the population structure provide a good starting point to optimise the breeding scheme to reduce the rates of inbreeding maintaining genetic gains, as suggested by Nomura (Reference Nomura1999).
In practise, the implementation of the selection strategy ‘optimum contribution selection’, introduced by Meuwissen (Reference Meuwissen1997), might be an appropriate method for the Trakehner population. This will maximise the genetic level of selected animals while restricting their average coancestry and hence the future coefficient of inbreeding.
The ‘optimum contribution selection’ method would increase the genetic response by combined contributions of unrelated families, by avoiding extreme relationships of offspring and provide reduced inbreeding levels of the parents in the next generation (Sonesson and Meuwissen, Reference Sonesson and Meuwissen2000). Other consequences of the method are related to keeping the population size as big as possible, creating a balanced number of sires and dams, standardising family size, introducing within family selection and balancing genetic exchange (rotation of sires).
So far, the major progress in horse breeding is achieved by increasing selection intensities (e.g. by using artificial insemination). Selection itself is still based to a large extent on own (uncorrected) performance using mass selection and not on estimates of the total genetic merit. By increasing the accuracy of selection, it could be possible to reduce selection intensities without diminishing genetic progress.
Conclusion
The analysis of the population structure of the Trakehner breed identifies the specific characteristics of the Trakehner Horse breed. The decreasing number of breeding animals, the long generation interval, the genetically fragmented population, the increasing rate of inbreeding and the accumulation of coancestry indicate the need of a better monitoring system in order to increase the effective population size without reducing genetic gain for a sustainable breeding work.
The knowledge of all kinds of population structure gives an overview of the population and is the first step for developing optimal mating and selection strategies for the future. Modern software tools for the optimisation of breeding schemes should be implemented into the breeding program of horses in further analyses. Therefore, the validity and the reliability of these software tools should be tested for the Trakehner Horse breed.
Acknowledgements
This research project was supported by the H. Wilhelm Schaumann Foundation and the Trakehner Breeding Association. The authors would like to thank Mr. L. Dempfle for the helpful comments.
Appendix
The derivation of formula (6) is described in the following lines (L. Dempfle, personal communication).
The drift variance at a neutral locus per generation can be described by

with Ne being the effective population size of that population and q the allele frequency. Assume this population has a mean generation interval of L.
Analogously for a population with a generation interval of 1 year:

where Na indicates the effective population size in this population with a generation length of 1 year. In this last population in L years drift variance will accumulate to

Additionally, we have the following relation between qi and qi− 1:

leading to

Replacing the geometric sequence by its sum in the limit, we obtain

Equating expressions for both populations we get:

and so

For a sufficiently large Na, ignoring all higher order terms an approximation is Ne = Na/L.