INTRODUCTION
Entamoeba histolytica infects approximately 500 million people worldwide but the majority of the individuals remain asymptomatic and spontaneously clear the infection (Nand, Baweja and Anand, 1984; Walsh, 1986). In about 10% of the individuals, the trophozoites invade the bowel and cause amoebic colitis or hepatic abscesses. The course and final outcome of infection depends on a number of parasitic factors, including the virulence of the infecting strain and the host factors, which can alter the risk and severity of the invasive disease (Tamayo et al. 1991).
In recent years, several investigations have been conducted to understand the molecular basis of host parasite interactions (Ravdin, 1986, 1989; Reed, 1995). The virulence of amoeba has been found to be a multifactorial phenomenon governed by specific molecular interactions at the cellular and molecular level (Ravdin, 1989). These host–parasite interactions take place in a series of sequential steps, including adhesion and colonization of amoebae in the gut via surface-associated molecules. Adherence of the amoebic trophozoites is mediated mainly by a galactose (Gal) and N-acetyl-D-galactosamine (Gal/NAc)-specific lectin (Ravdin and Guerrant, 1981), a 260 kDa heterdimeric glycoprotein comprised of 170 and 35 kDa subunits. The 170 kDa heavy subunit is an immunodominant antigen recognized by the immune sera of >90% of patients with amoebic liver abscess worldwide (Petri et al. 1987). After adherence, there is disruption of mucosal barriers by amoebic toxins or cytotoxins/enzymes. This is followed by lysis of the epithelial and inflammatory cells by pore-forming proteins (Leippe et al. 1991), phospholipases (Long-Krug et al. 1985) and haemolysins (Jansson et al. 1994) leading to colonic ulcers and tissue invasion.
Little is known regarding the host signals that initiate an acute inflammatory response to E. histolytica. Evidence for the involvement of the immune system includes the inflammatory infiltrate found i.e. increased number of lymphocytes, macrophages and neutrophils in the inflamed mucosa and the presence of the granulomas (Martinez-Palomo et al. 1989).
The limitation and prevention of recurrent invasive amoebiasis requires the development of an effective cell-mediated immune response (Salata et al. 1987). In vitro studies have demonstrated that intestinal epithelial cells may play an active role in the host immune and inflammatory response via the secretion of an array of potent chemoattractants and pro-inflammatory cytokines, including IL-8, GRO-α, GMCSF, IL-1α and IL-6 (Eckmann et al. 1995).
The numerical difference between the occurrence of infection and expression of morbidity is based on the existence of 2 morphologically identical but distinct species of Entamoeba i.e. pathogenic E. histolytica and non-pathogenic E. dispar (Reed, Wessel and Davis, 1991). The two strains can be differentiated by restriction fragment analysis of a single gene (Tannich and Burchard, 1991), by typing with monoclonal antibodies to the surface antigens (Blakely, Sargeaunt and Reed, 1990), ribosomal RNA sequence analysis (Clark and Diamond, 1991), cDNA clones (Burch, Li and Reed, 1991), and PCR (Gomes et al. 1999). Moreover, distinct epitopes have been identified in galactose-inhibitable adherence protein (GIAP) antigens from pathogenic and non-pathogenic isotypes (Abd-Alla et al. 1993; Pillai, Kobayashi and Kain, 2001).
Both E. histolytica and E. dispar bind to colonic epithelial cells and colonize. However, only E. histolytica infection induces an inflammatory response and subsequent pathogenesis, clearly suggestive of differential interaction with the host. The major surface lectin of pathogenic Entamoeba has been implicated not only in initiation of adherence but in sustained activation of epithelial and immune-competent cells and even in the cytolysis of target cells as the final outcome. Therefore, comparison of the responses of the intestinal epithelial cells to lectin of the pathogenic and non-pathogenic strains would be a point of interest.
In humans infected with E. histolytica, the expression and role of the chemokine system has not been investigated in much detail. Presently, we have shown that the stimulation of intestinal epithelial cells (INT-407) with the lectin from the 2 strains, results in the differential induction of various chemokines and cytokines, important for manifestations of pathology/immunity to the disease. Our study also demonstrates that there was a preferential stimulation of immunoregulatory functions of the lymphocytes from amoebic liver abscess patients by the Gal/Gal NAc inhibitable adherence lectin from the pathogenic Entamoeba.
MATERIALS AND METHODS
Reagents
The following antibodies were used in these studies: human-anti IL-1β (R&D Systems Inc., USA), anti-IL-2, IL-6, IL-8 and IL-10 from Pharmingen, USA; anti-GROα (growth related oncogene), anti-RANTES (regulated on activation; normal T cells expressed and secreted), anti-MIP-1α (macrophage inflammatory protein), anti-MCP-1 (monocyte chemotactic protein-1) from Sigma Chemical Co., USA; anti-TNF-α and GMCSF (granulocyte macrophage colony stimulating factor) from Pharmingen, USA. For mRNA quantitiation studies, gene-specific cytokine and chemokine probes and calibrators were obtained from R&D Systems Inc., USA.
Amoebic cultures and isolation of 260 kDa lectin
The axenic strains of Entamoeba histolytica HM1-IMSS and E. dispar (obtained from Dr P. Das, NICED, Kolkata, India), were cultivated in TYI-S-33 medium at 37 °C (Diamond, Harlow and Cunnick, 1978). The medium was supplemented with 10% heat-inactivated horse serum, 100 U/ml of penicillin and 100 μg/ml of streptomycin. Mid-log phase (48–72 h) trophozoites were harvested and pelleted at 150 g for 5 min in 75 mM Tris (Sigma, St Louis, Mo) containing 65 mM NaCl (pH 7·2). The pellet was solubilized in 10 ml of 50 mM Tris, 150 mM NaCl containing 0·5% (v/v) Nonidet P-40 (Sigma, USA) and freshly added protease inhibitor cocktail (pH 8·3). The solubilized trophozoites were microfuged at 10000 g for 10 min and the supernatant fraction was applied to a glutaraldehyde-activated silica bead affinity column for purification (Petri and Schnaar, 1995).
Glutaraldehyde-activated silica beads (Boehringer, Mannheim, Indianapolis, USA) (1 g) were derivatized with p-aminophenyl-1-thio-B-D galactopyranoside (Sigma) in 0·1 M bicarbonate buffer, pH 8·0. The silica beads were washed in 50 mM Tris containing 200 mM NaCl, 10 mM CaCl2, pH 7·3 (column buffer) to remove unbound galactose before the application of solubilized trophozoites with the peristaltic pump overnight at 4 °C. The column was then extensively washed with solubilization buffer first with and then without Nonidet P-40. The bound amoebic lectin was eluted with 0·2 M acetic acid, pH 2·5, into test-tubes containing 1·5 M Tris, pH 8·3, to neutralize the acid rapidly (Petri et al. 1987).
The purity of the lectin preparations was checked on 10% SDS-PAGE (Laemmli, 1970). Lectin activity of the preparation was checked by haemagglutination of human type A erythrocytes. Purified lectin (4 μg) was layered over 2×10⁹ RBC's/ml in a 2-fold serial dilution in a 96-well plate (Costar Corp., USA). Haemagglutination was observed visually after 6–16 h at 4 °C. Additionally, we also determined the lectin activity by agglutination of the INT-407 cells (Petri and Schnaar, 1995). Briefly, 2×10⁶ INT-407 cells/ml were freshly seeded into 12-well polystyrene tissue-culture plates (Nunc, Germany) in RPMI-1640 medium with 10% FCS for 24 h at 37 °C and humidified 5% CO2 atmosphere. The monolayers were layered over with different concentrations of the purified Gal/Gal NAc adherence lectin from E. histolytica and E. dispar, separately i.e. 20, 15, 10 and 5 μg lectin, per well respectively. Phytohemagglutinin (PHA) at a concentration of 10 μg per well was also layered over the monolayers to serve as the positive control. An equal volume of phosphate-buffered saline (PBS, pH 7·2) was added to the control wells, instead of the Gal/Gal NAc lectin. The plates were sealed and incubated at 4 °C for 6–8 h to check the agglutination under the confocal microscope (Axioplan 2, 10×).
The effective lectin concentration of the lectin preparation was determined by incubating INT-407 cells with different concentrations of lectin preparations and determining the intracellular calcium concentrations (as detailed below for lymphocytes). In some cases, cells were pre-incubated with galactose (20 μg/ml) for 60 min, at 4 °C, in PBS, washed and stimulated.
Cytokine assay
The INT-407 cell line (human intestinal epithelial cell line obtained from National Centre for Cell Science, Pune, India) was grown in 25 cm2 plastic tissue-culture flasks in RPMI-1640 medium (Gibco, BRL, USA), supplemented with 10% heat-inactivated fetal calf serum and 100 U/ml penicillin and 100 μg/ml of streptomycin at 37 °C in a humidified 5% CO2 atmosphere. The cells were trypsinized after 70% confluency and adjusted to 2×10⁶ cells/ml, after checking the viability with 0·05% Trypan blue, for subsequent assays. The cytokine and chemokine expression was measured by 2 methods.
(1) Intracellular cytokine levels. The percentage of cytokine-secreting cells was determined on a flow-cytometer (Becton Dickinson, USA) and 1×10⁶ INT-407 cells/ml were seeded into 12-well polystyrene tissue-culture plates (Nunc, Germany) in RPMI-1640 medium. Monolayers were stimulated with 5·0 μg/ml of Gal/Gal NAc adherence lectin from E. histolytica and E. dispar separately for 48 h at 37 °C and humidified 5% CO2 atmosphere. Expression of a diverse array of chemokines and cytokines including IL-1β, IL-2, IL-6, IL-8, IL-10. TNF-α, GRO-α, GMCSF, MIP-1α, MCP-1 and RANTES was measured. Constitutive expression was also measured simultaneously in unstimulated cells. To process the cells for analysis on a flow cytometer, monensin (100 mM) was added to the cultures 6 h before harvesting. Cells were later washed in phosphate-buffered saline (PBS, pH 7·2) and then fixed with 4% paraformaldehyde for 30 min at 4 °C. The fixed cells were washed in PBS, the supernatant fraction was discarded and the cells were permeabilized with 0·1% saponin for 10 min at room temperature. The cells were then stained with FITC/ PE labelled human anti-cytokine or anti-chemokine monoclonal antibodies as listed above, for 2 h. The cells were washed twice and resuspended in PBS for flow cytometric analysis (Sander, Anderson and Anderson, 1991). The isotype controls were run alongside the tests.
(2) mRNA quantitation by colorimetric ELISA. Total cellular RNA was extracted from the unstimulated as well as stimulated INT-407 cells (48 h with 5 μg/ml lectin of both Entamoeba spp.) using an RNA isolation kit (Total RNA isolation kit from Pharmingen, Cat. no. 556224). The RNA concentration was measured at 260/280 nm on a spectrophotometer and the specified concentration of target RNA was hybridized with the gene-specific mRNA probes for the cytokines and chemokines (R&D Systems Inc., USA) exactly as per the manufacturer's instructions; in a hybridization microplate waterbath at 60 °C for 1 h. The hybridized product was transferred to a streptavidin plate. After 4 washings with wash buffer, anti-digoxigenin conjugate was added and incubated at 25 °C for 1 h under shaking conditions. After 6 washings, substrate was added, followed by amplifier solution and the plate was developed, and read at 462 nm. The mRNA levels of each cytokine and chemokine were measured in femtomol/ml from the calibrator curves drawn using the provided kits (R&D Systems Inc., USA). The choice of cytokine/chemokine specific mRNA probes was limited by their availability at the time of initiating the study.
Production of lectin-induced conditioned media (LCM)
Firstly, 1×10⁶ cells/ml were grown in monolayers in RPMI-1640 medium at 37 °C and humidified 5% CO2 in tissue culture plates. When the monolayers became confluent, the medium was replaced with fresh medium, and cells were stimulated with 5 μg/ml of E. histolytica or E. dispar, Gal/Gal NAc adherence lectin. After 48 h of incubation, the conditioned media were collected under sterile conditions, labelled as LCMs and stored at −20 °C after filtration through a 0·22 μm filter, until use. The cultures were pre-screened at 6, 12, 24, 48 and 72 h for maximum cytokine and chemokine production.
Effect of LCM on lymphocytes of ALA patients
Twenty uninfected individuals and 20 amoebic liver abscess (ALA) patients attending the Gastroenterology Out Patient Department (OPD) of Nehru Hospital, PGIMER, Chandigarh, were enrolled for the study. ALA patients were confirmed by history, radiological examination, diagnostic aspiration (where permitted by coagulation parameters), serological testing and response to treatment. Uninfected individuals had no history of infection and their stool examination did not reveal any ova or cysts. The amoebic serology was negative in these cases. Lymphocytes were isolated from 10 ml of heparinized blood by layering over a Ficoll-isopaque (Sigma, USA) density gradient. The total PBMCs were incubated for 2 h in RPMI-1640 medium at 37 °C and 5% CO2 in plastic Petri dishes. Lymphocytes were separated as the non-adherent cell population and 1×10⁶/ml were cultured separately in the presence or absence of 1 ml of lectin-conditioned medium (LCM) from pathogenic and non-pathogenic amoeba for 48 h in RPMI-1640 medium at 37 °C and 5% CO2 in 12-well tissue culture plates. Following the incubation, lymphocytes were recovered and, after washing in PBS, the following parameters were studied.
Intracellular calcium determination
A calcium calibration curve was prepared by labelling the lymphocytes from healthy individuals with 4 μM Fluo 3/AM (Molecular Probes, Eugene, Oregon, USA) in the presence of 2 μM Pluronic F-127 (Molecular Probes, USA) for 45 min at 37 °C, in the dark. Pluronic F-127 was used to facilitate Fluo 3/AM loading. After washing in RPMI medium without FCS, the cells were suspended in HEPES buffer pH 7·2 (with 1 mM CaCl2). Fmax i.e. saturating concentration of calcium and Fmin i.e. calcium insensitive fluorescence were measured by using the Ca2+ ionophore Bromo A 23187 (Molecular Probes, USA) and MnCl2 (2 mM) solution respectively. Cells were acquired on a flow cytometer and analysis was carried out on FL-1H and a time-plot. The results were expressed as mean fluorescence intensity of experiments performed in duplicate.
Ca2+ was quantitated as –

kd=400 nM (dissociation constant for Ca2+ bound to Fluo 3/AM (Kao, Harootunian and Tsien, 1989).
The lymphocytes from ALA patients and healthy controls were incubated in the presence or absence of LCM. The lymphocytes were then labelled with Fluo-3/AM (4 μM). After washing, the cells were suspended in HEPES buffer (with 1 mM CaCl2) and acquired on flow cytometer. Results were expressed as mean fluorescence intensity and Ca2+ levels were quantitated as nM from the calibration curve.
Proliferation assay
For this assay 1×10⁶ lymphocytes/ml were seeded into 12-well polystyrene tissue-culture plates (Nunc, Germany), in RPMI-1640 medium containing 100 μM bromodeoxyuridine in the presence or absence of LCM. After washing with PBS, the cells were fixed in 70% ethanol at 4 °C for 30 min and treated with 0·2 mg pepsin in HCl, suspended in PBS (with 0·5% BSA, 0·5% Tween-20) and further incubated with anti-bromodeoxyuridine monoclonal antibody (Sigma, USA) labelled with FITC. After 2 washings, cells were finally suspended in 500 μl of PBS containing propidium iodide and acquired on flow cytometer using CellQuest software (Dolbeare et al. 1983). The results were recorded as percentage proliferating cells.
Cytokine and chemokine secretion
Lymphocytes were studied for the expression of IL-2, IL-4, IL-6, IL-10 and RANTES by intracellular flow cytometric analysis. Simultaneously, mRNA levels were determined by mRNA hybridization assay as described earlier. The isotype controls were run alongside the tests.
Cytokine and chemokine receptor expression
The presence/upregulation of the receptors of the relevant cytokines and chemokines was studied. Lymphocytes were stained with fluorescein isothiocyanate/phycoerytherin-conjugated human anti-chemokine receptor monoclonal antibodies i.e. anti-CD126, an antibody to IL6 receptor, anti-CD132, an antibody to a common receptor for IL-2 and IL-4 and anti-CCR5, an antibody to common receptor for RANTES and MIP1-α. After incubation at room temperature for 30 min in the dark, cells were washed and resuspended in 500 μl of PBS. Flow cytometric analysis was performed using CellQuest software and results were presented as mean fluorescence intensity (MFI)±S.D. The choice of chemokine/cytokine receptors was limited by the availability of the commercially available antibodies at the time the study was initiated.
Chemotaxis
Three series of 3 wells each (3 mm in diameter and 3 mm apart) were punched in 2% agarose gel in 35 mm plastic Petri dishes. The inner wells were filled with 5 μl of RPMI-1640 to measure random spontaneous migration (C). The middle wells were filled with lymphocytes and outer wells with 5 μl of the standard chemoattractant (zymosan activated serum), and incubated at 37 °C in the presence of 5% CO2 and saturated humidity for 4–6 h (A). The gels were fixed with formal saline, stained with Giemsa and examined under an occular microscope to measure the distance traversed in mm. The data are presented as chemotactic index, which indicates the ratio of directed migration (C) to random migration (RPMI media) (Nelson, Quie and Simmons, 1973).
Statistical analysis
All tests were performed in duplicate and the results were expressed as mean±S.D. The individual results were analysed by using the paired Student's t- test. A probability value of P<0·05 was regarded as statistically significant.
RESULTS
Isolation and purification of Gal/Gal NAc lectin
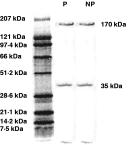
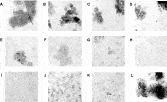
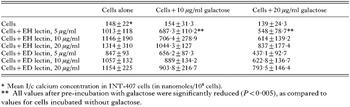
The purified lectin from E. histolytica and E. dispar strains appeared as 2 bands of 170 kDa and 35 kDa on 10% SDS-PAGE after silver staining, as shown in Fig. 1. The haemaagglutination titre was 1[ratio ]32 with E. histolytica lectin and 1[ratio ]16 with E. dispar lectin (data not shown). Figure 2 shows the agglutination of intestinal epithelial cells with Gal/Gal NAc lectin of Entamoeba histolytica and E. dispar. It can be clearly seen that 5 μg/ml of both the lectins agglutinated the epithelial cell line, as compared to the control wells. In a parallel experiment, INT 407 cells were similarly exposed to the lectins of both species and in some cases were pre-incubated with galactose. The results given in Table 1 showed that there was a tremendous increase in intracellular calcium concentrations of these cells after lectin stimulation of both the species but a 40–60% reduction was observed in case of pre-incubation with galactose. Clearly, 20 μg/ml of galactose had a more pronounced effect.

Fig. 1. SDS-PAGE (10%) of affinity-purified lectin preparations (heterodimer of 170 kDa and 35 kDa).

Fig. 2. Agglutination of intestinal epithelial cells with Gal/Gal NAc lectin of Entamoeba. The confocal images shown are, (A) 10 μg of PHA; (B, D, F and H) 20, 15, 10 and 5 μg of E.h. lectin respectively; (C, E, G and I) 20, 15, 10 and 5 μg of E.d. lectin respectively; (J, K, L) control cells.

Human intestinal cells secreted an array of chemoattractants and pro-inflammatory cytokines after stimulation with E. histolytica and E. dispar Gal/Gal NAc lectin
IL-1β, IL-2, IL-6, IL-8, MIP-1α, MCP-1, RANTES, GROα, GMCSF, TNF-α and the anti-inflammatory cytokine IL-10 were secreted. The intracellular cytokine/chemokine expression was determined by flow cytometer after 6, 24, 48, 72 h and 96 h of stimulation (data shown for 48 h only).
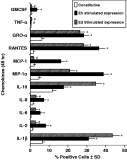
Our qualitative data (Fig. 3) indicates that the epithelial cells responded to E. histolytica lectin with an increased expression of an array of pro-inflammatory cytokines and chemokines i.e. RANTES, IL-6, MIP-1α, MCP-1, IL-2, IL-8, GMCSF and GROα as compared to E. dispar lectin. There was an approximately 21-fold increase in percentage RANTES-secreting cells after E. histolytica lectin stimulation as compared to the control (P<0·001). RANTES is a member of the C-C family of chemokines and is chemotactic for T cells, basophils and eosinophils. After interaction of INT-407 cells with E. dispar lectin, there was a 16-fold increase in RANTES-positive cells (P<0·001 as compared to the control). MIP-1α, another chemokine of the C-C family acts synergistically with RANTES and leads to neutrophil activation. E. histolytica lectin interaction resulted in a 8·58-fold increase in MIP-1α-secreting cells, whereas E. dispar lectin resulted in only 4·6-fold increase (P<0·001). MCP-1, yet another C-C chemokine, is chemotactic for monocytes and regulates the expression of cell surface antigens, adhesion molecules and cytokine production in monocytes. There were 16·3±1·4% MCP-1 positive cells after pathogenic lectin interaction as compared to the basal levels i.e. 2·11±0·3% (P<0·001), whereas with non-pathogenic lectin interaction, there were only 1·7±0·2% MCP-1 positive cells (P>0·05).

Fig. 3. Intracellular expression of cytokines and chemokines after stimulation of INT-407 cells with pathogenic and non-pathogenic lectin for 48 h. The results are presented as mean % positive cells±S.D. of triplicate experiments. * P<0·05 or less as compared to control; # P>0·05 or more as compared to control.
There was a 15·6-fold increase in the intracellular IL-6 expression in INT-407 cells after E. histolytica lectin stimulation and an 8·2-fold increase after E. dispar lectin interaction (P<0·05). The level of IL-2 was increased 6·6-fold after pathogenic lectin interaction (P<0·01), whereas with non-pathogenic lectin there was only a 2·13-fold increase (P<0·05). The increase in C-X-C chemokine, IL-8 secreting cells after E. histolytica Gal/Gal Nac adherence lectin interaction, was 5·2-fold as compared to 2·2-fold with E. dispar lectin (P<0·02).
GROα, another C-X-C chemokine and a chemoattractant for neutrophils, like IL-8, was found to be expressed by 28·4±3·9% cells after E. histolytica lectin stimulation and 23·4±2·2% after E. dispar lectin interaction as compared to basal levels i.e. 6·15±1·2% (P<0·01). There were 3·4±0·8% GMCSF positive cells with pathogenic lectin as compared to 0·60±0·06% with non-pathogenic lectin (P<0·05).
No significant change was observed in TNF-α levels. However, the expression of IL-1β was significantly higher in non-pathogenic lectin-stimulated cells i.e. 43·5±4·1% as compared to pathogenic lectin i.e. 31·0±3·0% (P<0·001) and basal levels i.e. 6·35±1·0% (P<0·001). The intracellullar expression of anti-inflammatory IL-10 was also found to be significantly higher with non-pathogenic lectin (34·7±2·1%) as compared to the pathogenic lectin-interacted cells 17·8±2·0% (P<0·001) and as compared to the constitutive level of 11·7±2·6% (P<0·001).
mRNA levels of various cytokines and chemokines
Gene-specific mRNA transcripts of all cytokines and chemokines were quantitated after 48 h stimulation of INT-407 monolayers with E. histolytica and E. dispar adherence lectin, using Quantikine mRNA hybridization assay kits.
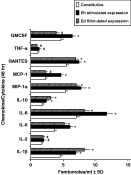
mRNA levels of all the pro-inflammatory chemokines i.e. IL-8, MIP-1α, MCP-1, RANTES were found to be significantly increased after E. histolytica lectin interaction with epithelial cells as compared to E. dispar and uninteracted control cells (Fig. 4). Maximum increase was observed in MCP-1 specific mRNA levels that showed a 2-fold increase (P<0·01) as compared to basal levels. A total of 11·8±2·1 femtomole/ml of IL-8-specific mRNA was detected in E. histolytica lectin-interacted cells in contrast to 8·3±1·2 femtomole/ml with E. dispar lectin (P<0·01) and 7·0±1·1 femtomole/ml in uninteracted cells. There was an approximately 1·7-fold increase in IL-6 specific mRNA levels with E. histolytica lectin as compared to basal levels (P<0·01).

Fig. 4. mRNA levels of cytokines and chemokines in INT-407 cells, after stimulation with pathogenic and non-pathogenic lectin for 48 h. The results are presented as mean femtomoles per ml±S.D. of triplicate experiments performed using mRNA hybridization assay. * P<0·05 or less as compared to control; # P>0·05 or more as compared to control.
Similarly, 7·83±1·6 fm/ml of MIP-1α-specific mRNA was quantitated in pathogenic lectin-interacted cells as compared to non-pathogenic lectin i.e. 7·1±1·1 fm/ml and 5·4±0·9 fm/ml in uninteracted cells (P<0·05). 7·5±1·2 fm/ml of RANTES specific mRNA was detected in pathogenic lectin interacted cells, 7·0±2·0 fm/ml with non-pathogenic lectin and 5·5±0·9 fm/ml in control cells (P<0·05). mRNA levels of TNF-α after E. histolytica lectin interaction were 1·29±0·9 fm/ml, after E. dispar lectin interaction, the levels were 0·99±0·1 fm/ml and 1·12±0·6 fm/ml in uninteracted cells (P>0·05). 6·6±9 fm/ml of GMCSF-specific mRNA was quantitated with E. histolytica lectin, compared to 4·0±1·1 fm/ml with E. dispar lectin (P<0·05) and 4·7±1·1 fm/ml basal levels. There was an increase in the IL-2 mRNA levels with E. histolytica lectin stimulation. However, as observed in FACS analysis, there were significantly high IL-1β mRNA levels after E. dispar lectin stimulation (8·3±1·4 fm/ml) as compared to E. histolytica lectin i.e. 6·9±1·2 fm/ml (P<0·01) and basal level i.e. 4·5±1·1 fm/ml (P<0·001).
The anti-inflammatory IL-10 mRNA level was also found to be significantly high with non-pathogenic lectin i.e. 3·0±0·9 fm/ml compared to the pathogenic lectin i.e. 2·4±0·6 fm/ml (P<0·05).
Differential stimulation of lymphocytes of amoebic liver abscess (ALA) patients by lectin-conditioned media (LCM)
Increased intracellular calcium in lymphocytes of ALA patients
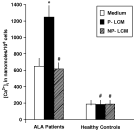
There was a significant increase (P<0·001) in the levels of intracellular calcium concentration of lymphocytes from ALA patients, after culturing in the presence of pathogenic LCM (1245·8 nM) as compared to the non-pathogenic LCM (615·6 nM) and in RPMI medium (644·9 nM) (Fig. 5). However, in the lymphocytes of healthy controls, the calcium levels were significantly lower (P<0·001) as compared to the lymphocytes of patients. No significant difference was observed in the calcium levels of lymphocytes of healthy controls in the presence or absence of LCM (P>0·05).

Fig. 5. Intracellular calcium levels in lymphocytes of amoebic liver abscess (ALA) patients (n=20) and healthy controls (n=20), after their interaction with the pathogenic (P) and non-pathogenic (NP), lectin-conditioned medium (LCM) for 48 h. The calcium levels were monitored by using Fluo-3/AM on a flow cytometer and presented as mean nanomoles per 106 cells±S.D. of triplicate experiments performed. * P<0·05 or less as compared to control; # P>0·05 or more as compared to control.
Lymphocytes showed enhanced proliferation
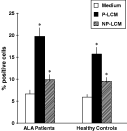
The proliferative potential of lymphocytes of ALA patients was significantly (P<0·01) increased in the presence of pathogenic LCM (19·87±5·4%) as compared to non-pathogenic LCM (9·8±3·1%) as well as medium alone (6·54±2·5%) (P<0·001) as shown in Fig. 6. The lymphocytes of healthy controls also showed an increase in proliferation (P<0·02), in pathogenic LCM (15·7±4·7%) as compared to non-pathogenic LCM (9·4±3·8%). Thus the pathogenic lectin-conditioned media with high levels of diverse pro-inflammatory cytokines and chemokines was able to activate the proliferation in lymphocytes of ALA patients.

Fig. 6. Proliferative response of lymphocytes of amoebic liver abscess (ALA) patients (n=20) and healthy controls (n=20), after their interaction with the pathogenic (P) and non-pathogenic (NP), lectin-conditioned medium (LCM) for 48 h. The proliferation data are given as the mean % positive cells±S.D. of 3 experiments. * P<0·05 or less as compared to control; # P>0·05 or more as compared to control.
High RANTES and IL-6 induced in patient's lymphocytes by LCM
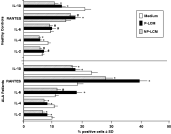
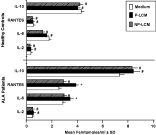
The bar diagram (Fig. 7) shows the intracellular expression of IL-2, IL-4, IL-6, IL-10 and RANTES in the activated lymphocytes (mean % cytokine positive cells±S.D.). There was a decline in the percentage of IL-2 positive lymphocytes after culturing in the presence of both pathogenic (7·89±2·03%) and non-pathogenic LCM (6·44±1·26%), as compared to the medium alone; i.e. 9·62±3·0% (P<0·01). For IL-4, there were 10·35±2·9% positive cells in the absence of LCM, 7·89±2·6% in P-LCM (P<0·05) and 6·94±1·99% in NP-LCM (P<0·02) in the case of ALA patients. The mean percentage of cells positive for pro-inflammatory IL-6, however, was found to be increased in the presence of P-LCM (18·09±4·0%) as compared to NP-LCM (11·35±3·2%) (P<0·01) and medium alone (10·74±3·1%) (P<0·01). Similarly, RANTES levels were increased after culturing the lymphocytes in both LCMs with a comparative, significant increase in P-LCM (39·64±4·6%) than NP-LCM (27·92±6·6%) (P<0·02) or medium alone (18·34±4·1%) (P<0·01).

Fig. 7. Intracellular cytokine and chemokine expression in the lymphocytes of ALA patients (n=20) and healthy controls (n=20) was determined, after co-culture with the pathogenic and non-pathogenic LCM for 48 h. The results are presented as mean % positive cells±S.D. of triplicate experiments. * P<0·05 or less as compared to control; # P>0·05 or more as compared to control.
The levels of anti-inflammatory IL-10, however, remained high in the lymphocytes cultured in the absence of LCM (23·32±3·6%) (P<0·02). The significantly low levels of these cytokines and chemokines in the case of healthy controls as compared to the ALA patients are also presented in the figure.
Cytokine and chemokine-specific mRNA transcript levels
These levels were quantified in femtomol/ml using the cytokine-specific mRNA probes (Fig. 8). No significant difference was observed in the case of IL-2 and IL-10 mRNA levels, when lymphocytes were cultured in the presence or absence of both pathogenic and non-pathogenic LCM (P>0·05). However, the mRNA levels of IL-6 were significantly (P<0·05) increased when cultured in pathogenic LCM (3·40±1·6 femtomoles/ml) as compared to medium alone (1·85±1·03 fm/ml). Similarly, mRNA levels of RANTES were high in pathogenic LCM (3·87±0·86 fm/ml) as compared to non-pathogenic LCM (2·93±1·8 fm/ml) and medium alone (2·55±0·91 fm/ml) (P<0·05). Similar studies in the case of lymphocytes of healthy controls did not reveal any significant difference in the mRNA levels of cytokines and chemokines in the presence or absence of LCM.

Fig. 8. The mRNA levels of cytokines and chemokines in the lymphocytes of ALA patients (n=20) and healthy controls (n=20) was determined, after culturing them in the pathogenic and non-pathogenic LCM for 48 h. The results are presented as mean femtomoles per ml±S.D. of experiments performed in triplicate using mRNA hybridization assay. * P<0·05 or less as compared to control; # P>0·05 or more as compared to control.
Cytokine and chemokine receptor activation/downregulation
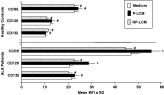
The expression of chemokine/cytokine receptors-CD126, CD132 and CCR5 was evaluated on the surface of lymphocytes from ALA patients and uninfected individuals (Fig. 9). The levels of CD126, an IL-6 receptor, when plotted as mean fluorescence intensity, revealed significantly high levels (P<0·05) in lymphocytes from ALA patients when cultured in P-LCM (28·7±4·0). Similarly, there was an increased expression of CCR5, a common receptor for MIP-1 and RANTES, in P-LCM (55·46±14·6) as compared to NP-LCM (44·44±9·6) (P<0·001) and medium alone (46·88±10·9) (P<0·02). No significant change (P>0·05) was recorded in the case of CD132, a common receptor for IL-2 and IL-4. The healthy control data showed comparative low levels (P<0·001).

Fig. 9. The surface expression of cytokine/chemokine receptors on the lymphocytes of ALA patients (n=20) and healthy controls (n=20) was determined, after culturing them in the pathogenic and non-pathogenic LCM for 48 h. The results are presented as mean fluorescence intensity±S.D. of triplicate experiments. * P<0·05 or less as compared to control; # P>0·05 or more as compared to control.
The activated lymphocytes expressed high chemotactic potential
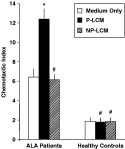
The chemotactic index of activated lymphocytes from ALA patients (measured as the ratio of migration distance traversed towards the standard chemoattractant and the spontaneous migration, through the agarose gel) was significantly enhanced (P<0·001) in P-LCM (12·1±2·8) as compared to NP-LCM (7·16±1·6) and medium alone (Fig. 10). The chemotactic index of lymphocytes of healthy controls was, however, significantly lower (P<0·001) than that of patients with no significant difference (P<0·05) in the levels, both with and without LCM.

Fig. 10. The chemotactic index (CI) of lymphocytes of amoebic liver abscess (ALA) patients (n=20) and healthy controls (n=20), after their interaction with the pathogenic (P) and non-pathogenic (NP), lectin-conditioned medium (LCM) for 48 h. The CI was measured as the ratio of the migration of lymphocytes towards the standard chemoattractant verses the spontaneous migration, through the agarose gel. The results are presented as mean CI±S.D. of triplicate experiments. * P<0·05 or less as compared to control; # P>0·05 or more as compared to control.
DISCUSSION
Recent studies have provided evidence that chemokine and/or chemokine receptors can be crucial mediators for inflammation and tissue injury in intestinal and hepatic inflammation. Chemokines, which are small, 8–11 kDa secreted proteins, may participate in immune and inflammatory responses through the chemoattraction and activation of leucocytes (Ajuebor and Swain, 2002). Parasite-specific immune responses also regulated by cytokines and chemokines, modulate and direct the expression of immunity, but may also contribute to infection induced pathogenesis and parasite persistence (Talvani et al. 2004). E. histolytica infection is associated with an acute inflammatory response (Chadee and Meervitch, 1984). However, it is still not clear how E. histolytica triggers a host inflammatory response and the host parasite factors that initiate this event have not been clearly identified.
Unlike previously assumed, epithelial cells do not merely act as a passive barrier, but as sensitive indicators of infection that initiates defence responses. Non-invasive as well as invasive organisms have been demonstrated to elicit production of chemoattractants (Savkovic, Koutsouris and Hecht, 1996). Epithelial cells have been found to release both chemokines and cytokines in a precise mixture that varies according to the origin or maturity of the cell. McCormick et al. (1993) showed that the application of S. typhimurium to the surface of T84 epithelial cell monolayers led to the production of one or more chemotactic factors that caused translocation of neutrophils across the monolayer. Chemokine secretion is related to epithelial cell signalling, but the precise nature of the signalling pathway is not defined. However, the initial signalling events ultimately lead to the activation and translocation of transcription factors that control the transcription of genes encoding the various chemokines and cytokines secreted by epithelial cells (Svanberg et al. 1996). It has been found that both the C-X-C and C-C members of the chemokine family of proteins as well as pro-inflammatory cytokines IL-1β, IL-6, TNF-α and cell growth factor GMCSF are released by epithelial cells after bacterial-enterocyte interaction (Yang et al. 1997). This mixture of cytokines and chemokines ensures that cells are not only called into epithelial/mucosal sites from circulation but are activated and sustained, once they reach this site.
The intestinal mucosa is the first line of defence against amoebic infection, and intestinal epithelial cells (IEC) play a role in mediating the host response to pathogen. Destruction of the extracellular matrix, and cytolysis of the host tissue are important aspects of the disease and leukocyte infiltration at the site is the hallmark of pathogenesis. Amoeba perhaps, evade the immune response by modulating the cytokine and chemokine production. E. histolytica trophozoites have been shown to increase the expression and secretion of chemokines and pro-inflammatory cytokines (Seydel et al. 1997) including IL-1, IL-8, IL-6, GRO-α and GMCSF in the stromal cells and epithelial cells (Eckmann et al. 1995). The literature points to the role of cytokines in the amoeba-induced inflammation, but the role of chemokines in the pathogenesis of amoebiasis has not been well recognized. The present study included a diverse array of chemokines and cytokines expressed by IEC when they interacted with the Gal/Gal NAc lectin of the pathogenic E. histolytica and non-pathogenic E. dispar. Although Gal/Gal NAc lectin is found in both E. histolytica and E. dispar, and there are shared epitopes between the lectins, there is only 77–85% DNA sequence identity between these molecules (Petri et al. 1987). The cysteine-rich region of the Gal/Gal NAc lectin heavy subunit is hidden at the surface of E. dispar (Pillai et al. 2001) and therefore can represent a putative target used by IEC to discriminate between pathogenic and non-pathogenic amoeba.
Our in vitro studies demonstrated that E. histolytica Gal/Gal NAc lectin stimulated and increased secretion of an array of chemoattractants and pro-inflammatory cytokines including, IL-2, IL-6, IL-8, MIP1-α, MCP-1, RANTES and GMCSF from the human IEC cell line. Increased cytokine secretion was paralleled by increased gene transcription and steady-state mRNA levels. The release of this particular combination of cytokines in vivo by epithelium would be an effective means of initiating a mucosal inflammatory response. These cytokines, particularly, IL-8, GRO-α and MCP-1 are potent chemoattractants for neutrophils and monocytes respectively. While GMCSF prolongs the survival of these cells and increases their response to other pro-inflammatory agonists, TNF can activate both types of cells and can stimulate further release of IL-8 and MCP-1 from them. The CC chemokines MCP-1 and MIP1-α attract monocytes and certain T cell subsets (Baggiolini, Dewbald and Moser, 1994). The local release of such a complex network of cytokines and chemokines could explain the histopathological finding of E. histolytica infection. The comparative low levels of these chemokines, pro-inflammatory cytokines and high levels of anti-inflammatory IL-10 in response to Gal/Gal NAc lectin of non-pathogenic E. dispar could explain the absence of an acute inflammatory response and the disease process. Higher IL-1β expression was observed in IEC when stimulated with Ed lectin at 48 h. However, according to the flow cytometric data, IL-1β expression (percent positive cells) declined at later time-intervals i.e. at 72 and 96 h and was taken over by Eh lectin. Further, the higher levels of anti-inflammatory IL-10 could be down-regulating the effects of high IL-1β levels in the case of Ed. IL-1β has also been found to catalyse the production of homologues of IL-10. Szczepanik et al. (2001) studied the IL-10 mediated downregulation of IL-1B in activated microglial cells. This downregulation is synergistically supported by the presence of IL-17 in lung epithelial cells (Numasaki et al. 2004). IL-10, in fact, has been reported to regulate type I and II IL-1B receptors on IL-1B activated mouse primary astrocytes (Pousset et al. 2001). Moreover, cytokines are known never to act alone, but function in concert with other cytokines and chemokines. So, the higher level of IL-1β alone in the case of Ed lectin may not have much effect. Whereas, in the case of Eh lectin, all pro-inflammatory cytokines are expressed at higher levels which may act in co-ordination with each other to lead to an inflammatory state. We speculate that both pathogenic and non-pathogenic amoeba induce a differential cytokine/chemokine production by epithelial cells, the key factor would still be the virulence determinants. So, while, both pathogenic and non-pathogenic organisms would attach to the epithelial cells and induce cytokines/chemokines for initiation of immune signalling, the other virulence factors associated primarily with pathogenic amoeba will be crucial in cellular interactions and outcome. Thus, these non-pathogenic amoeba (commensal) have the ability to induce a distinct cytokine/chemokine response and a discriminative signal to underlying immune-competent cells.
The cytokines and chemokines may thus provide a mechanism for initiation, amplification or containment of inflammation during the disease state, so it is important to study their balance at the initiation state.
Chemokine release is generally rapid, but an important heterogenity has been noted here. Among the C-C chemokines, MCP is released first, peaking at 2–4 hours after exposure to a bacterial stimulus, whereas RANTES release occurs later, peaking at 6–8 hours (Yang et al. 1997). Similarly, among the C-X-C chemokines, IL-8 and GRO-α and β secretion occurs early and ENA 78 occurs later. The advantage of such patterned chemokine release is not immediately evident. One possibility is that it relates to the fact that various C-X-C and C-C chemokines address different subpopulations of inflammatory cells so that the patterned release ensures an ordered entry of cells into the inflammatory site.
Alternatively, with Chlamydia, production of IL-1 was seen 2–4 days after infection. The IL-1α release induces the secretion of IL-8, GMCSF and IL-6 suggesting that Chlamydia organisms do not evoke a secretory response upon contact with epithelial cells but do so after cell entry (Rasmussen et al. 1977).
Eckmann et al. (1995) also reported the release of IL-1α by amoebic trophozoite-infected epithelial cell monolayers. As a result, there was stimulation of IL-8 secretion by uninfected epithelial cells. Same effects were noted in in vivo systems consisting of human intestinal tissues engrafted into the SCID mice (Seydel et al. 1997). These studies confirmed the in vitro results of cytokine response by E. histolytica.
The cocktail of cytokines and chemokines present in the lectin-conditioned medium can be extrapolated to assume that it simulated the in vivo environment for the lymphocytes of amoebic liver abscess patients. Such an environment (LCM of pathogenic lectin), led to further increase in expression and mRNA levels of pro-inflammatory IL-6 levels and of RANTES alongside their respective receptors in activated lymphocytes, in response to pathogenic Gal/Gal NAc lectin. The studies that assess the migration of lymphocytes of the patients, firmly established the role of chemokines in leucocyte recruitment. These inflammatory mediators preferentially increased the proliferation and intracellular calcium in the patient's lymphocytes selectively by pathogenic Entamoeba only. The parallel studies in uninfected individuals, however, did not record any significant noticeable change in any of the lymphocytic immune functions studied. As reported, the contact by an amoeba induced an irreversible rise in target cell (Ca2+)i which was found to be galactose sensitive. A comparative increase in (Ca2+)i in CHO cells was also observed with E. histolytica Gal/Gal NAc lectin (Ravdin et al. 1988). The increase is followed by cell death as indicated by morphology, determination of Fura-2 leakage and Trypan blue uptake (Ravdin, Croft and Guerrant, 1980; Ravdin and Guerrant, 1981).
In conclusion, our results suggest that there was an augmented expression of chemokines and pro-inflammatory cytokines by IECs in response to pathogenic Gal/Gal Nac lectin which could be a possible explanation for the acute inflammatory state. The results also highlight the possible participation of the chemokine system in modulation of the immunoregulatory functions of the lymphocytes in ALA patients. The local release of these chemokines might play a role in PMN infiltration during acute infection and in pathogenesis of amoebiasis. They can activate PMN functions and release of lytic enzymes. While PMN infiltration sets the centre stage, the lymphocytes and monocytes stimulated by chemokines may contribute to disease pathology by participating in cytotoxicity and amplification of lesion formation. Modulation of the chemokine network is perhaps a marker of virulence of the pathogenic E. histolytica. The study also points out that the chemokine agonists and antagonists targeted against chemokines and their receptors can have the potential to become therapeutically important in the treatment of amoebiasis, as directly targeting the production of cytokines and chemokines by IECs or blocking the receptors might alter the course of this invasive disease.