


Legislators in democratic contexts appear to reap personal benefits from their positions. In a detailed historical analysis of the British House of Commons, Eggers and Hainmueller (Reference Eggers and Hainmueller2009) show that members of the Conservative Party are able to use their political influence to obtain lucrative outside employment. Winning a seat effectively doubles a Member of Parliament's (MPs) wealth over the course of a lifetime, as compared to a group of candidates that narrowly lost their elections. Querubin and Snyder (2011) exploit a similar regression discontinuity approach to examine the accumulation of wealth among members of the U.S. House of Representatives in the middle of the nineteenth century, finding significant returns during the Civil War years. Heightened military spending, combined with decreased media oversight, offered sitting legislators a special opportunity for rent collection. As we might expect, businesses with political connections to individual legislators also benefit from the office. Roberts (Reference Roberts1990) shows that firms from Senator Henry Jackson’s state experienced an abnormal 1.6% drop in share price on the day of his unexpected death. In a cross-national study in 47 countries, Faccio (Reference Faccio2006) estimates that politically connected firms receive a cumulative abnormal return of 1.28% when their officers become members of parliament. These returns appear to be highest in places with rampant corruption.
Theories of authoritarian politics predict similar returns for authoritarian legislators, but for reasons having to do with regime stability. Co-optation theory states that autocrats create legislative institutions to co-opt would-be opposition into the policy process (Gandhi Reference Gandhi2008; Gandhi and Przeworski Reference Gandhi and Przeworski2006, Reference Gandhi and Przeworski2007; Malesky and Schuler Reference Malesky and Schuler2010), giving key actors limited policy influence and access to rents (Lust-Okar Reference Lust-Okar2006). Across several works, Boix and Svolik argue that parliaments are institutions of power-sharing, helping autocrats credibly commit to distributing resources to the rest of the ruling clique (Boix and Svolik Reference Boix and Svolik2013; Svolik Reference Svolik2009, Reference Svolik2012). Selectorate theory holds that authoritarian regimes allocate private rents to the small group of supporters that keep them in office. Although regime transitions are usually brokered behind closed doors, autocrats may still buy off members of parliament, who bestow formal legitimacy (Bueno de Mesquita et al. Reference Bueno de Mesquita, Smith, Silverson and Morrow2003, Reference Bueno de Mesquita, Smith, Silverson and Morrow2008).Footnote 1
While these theories differ in their depictions of authoritarian politics, they all point to legislative institutions as places of action, places where rents and influence are distributed to foster the cooperation of key actors. We might also expect rents to be especially high given the governance characteristics of most autocracies—a lack of electoral accountability, high levels of corruption, and weak regulatory environments (Faccio Reference Faccio2006; Ferraz and Finan 2011). To date, there is little hard evidence in this regard. Recent macro-level work suggests that parliaments are associated with growth and regime stability (Gandhi and Przeworski Reference Gandhi and Przeworski2007; Gandhi Reference Gandhi2008; Wright Reference Wright2008), but it remains unclear whether authoritarian parliaments actually bring tangible benefits to their members.
Common perceptions of these “rubber stamp” institutions would suggest that opportunities for rent-seeking behavior are minimal, giving reason to doubt the theoretical consensus. In China, for example, journalists describe the annual two-week meeting of the National People’s Congress (NPC) as a “tightly controlled event featuring much pageantry and precious little drama” (“What Makes a Rubber Stamp,” 2012). To date, no single law or nomination before the full NPC plenary session has ever been voted down. Hu Xiaoyan, an NPC deputy and migrant worker from Guangdong, famously commented, “As a parliamentary representative, I don’t have any real power” (Bristow Reference Bristow2009). Deputies are effectively unpaid and have no personal staff. Party authorities routinely discipline deputies for corrupt activities, who are instructed to represent the interests of the people, and not themselves (O’Brien Reference O’Brien1994). At first glance, these observations do not seem indicative of an institution that is a meaningful forum of rent distribution.
This leaves us with two competing expectations. A regime’s need to purchase support, coupled with high levels of corruption and a general lack of electoral accountability, suggest that legislators can accrue substantial personal benefits. The general weakness of authoritarian legislative institutions, combined with regime disciplinary controls, would suggest that the returns are minimal. This article aims to adjudicate these expectations and answer two related questions. Are there “returns to office” in authoritarian parliaments? If so, how exactly do representatives and their affiliates obtain benefits, given that these institutions are so highly constrained?
I address these questions with new data on the backgrounds, behaviors, and financial connections of the nearly 3000 deputies to China’s NPC. China presents an interesting case given the country’s growing importance, and a challenging case for the theories above given that the NPC is commonly dismissed as meaningless. Empirically, certain institutional features allow me to estimate the personal benefits of membership for a subset of deputies. Unlike representatives in most national parliaments, NPC deputies fulfill their duties on a part-time basis and have full careers in other sectors, an institutional feature aimed at keeping the representatives close with their constituents. The NPC Deputy Database (NPCDD), gathered by the author in 2011–2012, shows that approximately 500 deputies in the 11th NPC (2008–2012) can be considered chairmen, CEOs, or leaders of various companies.Footnote 2 Within this group, around 50 deputies were CEOs of publicly listed firms that first gained representation in the 11th NPC. The goal will be to discern whether having a CEO in the NPC brings financial rewards to these companies.
This design places the study between two growing bodies of empirical research—one that estimates the personal financial benefits of holding political office (Eggers and Hainmueller Reference Eggers and Hainmueller2009; Lenz and Lim Reference Lenz and Lim2009; Querubin and Snyder 2011), and another that measures the value of political connections for firms (Faccio Reference Faccio2006; Ferguson and Voth Reference Ferguson and Voth2008; Fisman Reference Fisman2001; Goldman, Rocholl, and So Reference Goldman, Rocholl and So2009; Jayachandran Reference Jayachandran2006; Johnson and Mitton Reference Johnson and Mitton2003; Roberts Reference Roberts1990). Although I measure the performance of firms associated with the NPC, the deputies are themselves the CEOs, and presumably gain personal “returns to office” from their firms’ successes.
The main empirical concern is that NPC membership is not randomly assigned. Firms that gain NPC seats may simply have better financial prospects to begin with, for any number of reasons. To gain traction over the problem and address selection concerns, I employ an entropy weighted fixed effect design (Hainmueller Reference Hainmueller2012). A standard fixed effects model accounts for time-invariant confounders and aggregate level shocks but is vulnerable to departures from the parallel trends assumption. To make a more plausible counterfactual group, entropy balancing is used to construct a weighted portfolio of Chinese companies that matches the companies with NPC representation on relevant financial characteristics just prior to the 11th NPC. The “NPC portfolio” and weighted “non-NPC portfolio” have the same mean operating profit margin and return on assets over the 2005–2007 period, as well as balanced distributions across industries and other financial metrics. Any performance differences that emerge in the 11th NPC session (2008–2012) are suggestive of a causal effect, although we should always remain cautious in making this inference from observational data.
The evidence suggests that a seat in the NPC may be worth an additional 1.5 percentage points in returns and an additional 3 to 4 percentage points in operating profit margin in a given year. Interviews with Chinese financial experts confirm the plausibility of these estimates (Personal Interview BJ22213; Personal Interview BJ28213a; Personal Interview BJ28213b; Personal Interview BJ28213c; Personal Interview BJ1313; Personal Interview BJ2313a; Personal Interview BJ2313b), which are robust across a number of different specifications and estimation strategies. Interestingly, estimates from interacted models suggest that the benefits are greatest for smaller, private firms, and negligible for larger state-owned enterprises (SOEs).
With these findings in mind, the discussion section investigates how NPC seats contribute to financial gain. Although existing theories focus on sharing formal policy influence (Boix and Svolik Reference Boix and Svolik2013; Gandhi Reference Gandhi2008; Gandhi and Przeworski Reference Gandhi and Przeworski2007; Malesky and Schuler Reference Malesky and Schuler2010; Svolik Reference Svolik2012), the evidence suggests that rents in China’s NPC arise primarily through other mechanisms. Deputies do influence policy through the introduction of opinions and motions, but they are constrained in their ability to directly lobby on behalf of their firms due to growing representational norms in the body. Instead, the primary benefit of NPC membership seems to be a “reputation boost.” The office itself acts like a signal to outsiders, engendering positive perceptions that foster business development and investment. Additional quantitative analysis shows that NPC firms experience a 3 to 4 RMB increase in stock price in the month following their membership announcement, meaning that the “returns to office” begin to take effect even before deputies actually take office. Interviews with market analysts confirm the importance of this signaling mechanism to company perceptions (Personal Interview BJ2313; Personal Interview BJ1313; Personal Interview BJ2313a; Personal Interview BJ1313b).
The article seeks to make three main contributions. First, it joins a growing body of research and provides the first estimates of the value of political connections and “returns to office” for members of an authoritarian legislative institution, as well as the first such estimates for any political institution in China.Footnote 3 In the authoritarian setting, existing work has focused on connections to the ruling leader or ruling party, which seem to be worth a substantial amount. Ferguson and Voth (Reference Ferguson and Voth2008) show that stocks of firms affiliated with the Nazi party outperformed those of unconnected firms by 5 to 8 percent during the regime’s rise in 1933. In Indonesia, Fisman (Reference Fisman2001) conducts an event study of negative news rumors about Suharto’s health from 1995–1997, and finds that firms closely tied to the president experienced worse returns during these episodes. It is difficult to directly compare the results across studies given differences in measurement, but my findings confirm that even ties to so-called “rubber stamp” legislative institutions can be quite valuable.
Second, the findings lend support to the intuitions of several prominent theories of authoritarian politics (Boix and Svolik Reference Boix and Svolik2013; Bueno de Mesquita et al. Reference Bueno de Mesquita, Smith, Silverson and Morrow2003; Gandhi Reference Gandhi2008; Svolik Reference Svolik2009, Reference Svolik2012). Despite their relatively small policymaking role, NPC deputies manage to accumulate benefits in the form of improved performance for their respective businesses. This accords with the predictions of co-optation, power-sharing, and to a degree, selectorate theory (Boix and Svolik Reference Boix and Svolik2013; Bueno de Mesquita et al. Reference Bueno de Mesquita, Smith, Silverson and Morrow2003; Gandhi Reference Gandhi2008; Svolik Reference Svolik2009, Reference Svolik2012). The microlevel finding also buttresses macrolevel evidence on the importance of studying and understanding the role of these institutions (Gandhi Reference Gandhi2008; Gandhi and Przeworski Reference Gandhi and Przeworski2007; Wright Reference Wright2008). Future research can potentially replicate and extend this type of analysis in other authoritarian settings.
Third, the research design demonstrates how entropy balancing can be used in conjunction with panel data to create more plausible counterfactuals. In employing a fixed effect or difference-in-differences framework, analysts must defend the validity of the parallel trends assumption. This assumption is impossible to test, but it appears less plausible when the treatment and control groups follow different trajectories in the pre-treatment period, or when they have vastly different underlying characteristics. Entropy balancing offers the analyst a means of ensuring balance across relevant covariates, as well as the dependent variable, in the pretreatment period (Hainmueller Reference Hainmueller2012). This preprocessing technique has the potential to yield more convincing estimates than standard approaches.
The remainder of the article is structured as follows. The first section provides background information on China’s National People’s Congress and the role of NPC deputies. After briefly outlining the data collection for the project, I summarize the research design and present different estimates for the effect of NPC representation on financial performance. The discussion section evaluates possible mechanisms with additional qualitative and quantitative analysis. The article concludes with a note on future research directions in the study of authoritarian parliaments.
BACKGROUND INFORMATION
China’s National People’s Congress sits atop the country’s formal state structure. Nominally, the body has sweeping powers, including the authority to amend the constitution and oversee its enforcement; to enact and amend basic laws; to approve budgets and work reports; and to appoint members of key state organs including the president. The full congress, which has nearly 3000 members, meets only once per year in March for a period of two or three weeks. The NPC Standing Committee, a more professionalized body comprised of around 170 members, meets throughout the year and has effectively the same powers as the NPC itself, although certain laws and appointments require the approval of the full plenary session (Jiang Reference Jiang2003; O’Brien Reference O’Brien1988, Reference O’Brien1990).
Despite its broad formal role, the NPC is largely a subservient institution in the sense that most relevant political and policy decisions are made either in the State Council or high-level CCP bodies (Tanner Reference Tanner1998). By the time a bill is placed before the NPC, the major content has already been decided and members are expected to simply vote it through. Deputies are also given little time to review bills and do not know the agenda until right before plenary sessions begin (Personal Interview BJ32713b). This trend has earned the NPC the familiar “rubber stamp” moniker among many critics.
Adding to this reputation is the fact that deputies lack a true electoral connection with the citizenry. NPC deputies are chosen every five years by deputies serving at the provincial level. There are people’s congresses at five administrative levels: national, provincial, prefectural, county, and township. Representatives at the county level and below are elected directly by the people, and higher level deputies are elected by the congresses below. At all levels, candidates usually receive nomination from the relevant CCP authorities, although there has been an increase in “independent candidates” in recent years. Still, strict limits on the ratio of candidates to seats (110 candidates for every 100 seats at the national level) effectively allow CCP authorities to pick and choose representatives (Jiang Reference Jiang2003; O’Brien Reference O’Brien1988, Reference O’Brien1990).
Deputies are nominated according to hard quotas and selection norms along four dimensions: geography, ethnicity, gender, and party affiliation. Each province is allocated seats in proportion to its population, ranging from 19 representatives for Hainan to 180 representatives for Shandong. Each one of the 55 recognized minority groups also receives at least one seat, which leads to a slight overrepresentation of minorities as a whole. Article 6 of the Electoral Law also stipulates that there should be “an appropriate number of women deputies, and the proportion thereof shall be raised gradually.” Other attributes are given softer protection. Deputies are selected from different age groups, religious groups, professions, and economic sectors. This “deliberately arranges for a balance of various social sectors and interests,” as Jiang (Reference Jiang2003) describes.
Of course, there is very little balance in the institution politically. Members of the eight nominally democratic opposition parties, as well as unaffiliated citizens, are allotted a portion of seats, but the CCP guarantees that it holds a 70–75% majority. The party holds a similar proportion for every congress all the way down to the township level.
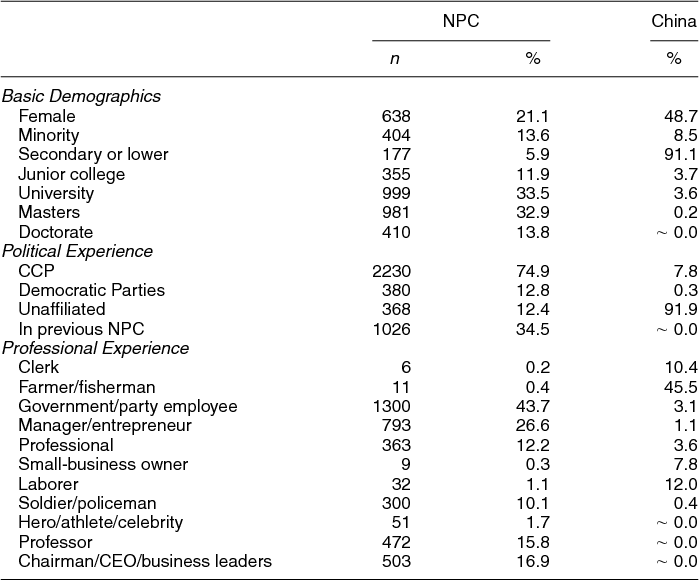
The net result of the quota system, and other selection pressures, is a parliament that is quasi-representative in some respects, but woefully unrepresentative in others (Truex Reference Truex2014). Table 1 compares the compositions of the NPC and Chinese population using data from the NPC Deputy Database (NPCDD).Footnote 4 Certain groups are starkly overrepresented in the selection process—CCP members, men, government officials, professors, CEOs/businesspeople, and soldiers/policemen. Conversely, farmers and workers hold only a few token seats, mostly because they are considered underqualified for the deputy role.
Who’s Who in China’s National People’s Congress

Notes: NPC figures drawn from author’s database. China statistics drawn from the CIA World Factbook and the 2008 China Survey, a nationally representative sample.
For the purposes of this article, the most important trend of note is that CCP authorities increasingly choose members of the business class. Of the 2987 deputies in the NPC, the data show that 503 can be identified as CEOs or leaders of companies of some shape or form. This reflects Jiang Zemin’s call for the CCP to represent “the advanced productive forces” and accords with recent efforts to create “red capitalists” and co-opt the business class (Dickson Reference Dickson2008; Kennedy Reference Kennedy2008). The following sections explore whether a seat in the congress brings tangible benefits to these business types.
DATA
The data presented here are part of an ongoing effort at analyzing the backgrounds and behaviors of China’s highest legislators (Truex Reference Truex2014). The analysis involves the use of two datasets: the NPC Deputy Database (NPCDD) and the COMPUSTAT financial database. The NPCDD was compiled by the author from publicly available sources in Chinese in 2011 and 2012. The COMPUSTAT database is a commonly used financial database made available by Wharton Research Data Services.
The NPCDD contains personal background and behavioral information for all 2987 NPC members in the 11th Congress (2008–2012). While the official Chinese version of the NPC website contains some basic information on the deputies (age, gender, party membership, etc.), a richer set of variables was collected using Baidu Encyclopedia, China’s version of Wikipedia. Like Wikipedia, Baidu contains short profiles of noteworthy individuals, and roughly 80% of members had detailed information on the site. In instances where the information was not detailed enough, additional internet searches of newspapers and other websites were conducted until the missing information could be collected.Footnote 5
For the analysis in this article, the NPCDD was helpful in identifying those NPC deputies with ties to large businesses. Additional information was gathered on the work histories of the 503 CEO deputies, including any major positions held at companies over the last twenty years, as well as basic information on the companies themselves. Many are small companies or township or village enterprises (TVEs) for which there are no financial data available, but a portion are publicly listed on the Shanghai or Shenzhen exchanges.
Once these NPC companies were identified, this NPC representation indicator was merged with the COMPUSTAT financial data from 2005 to 2010 for all publicly listed Chinese companies. The COMPUSTAT database contains reliable financial information derived from quarterly and annual accounting statements. China’s domestic accounting standards, while generally less stringent than international standards, still require companies to report the core financial metrics needed for the analysis: total assets, total liabilities, net income, total revenue, the cost of goods sold, outstanding shares, and many others.
The analysis will exclude companies with CEOs that held office in the 10th NPC, as we are seeking to identify the effects of gaining representation and should therefore exclude pre-treated observations. These companies have no empirical counterfactual group. I will also exclude companies with any one of the following characteristics: incomplete or incomparable financial data across the 2005–2010 period; headquarters located outside mainland China; not listed on the Shanghai or Shenzhen exchanges; and extreme outliers (more than five standard deviations away from the sample mean) on certain financial characteristics. This leaves a total of 997 companies, 48 of which gained CEO representation in the NPC for the first time in 2008.
RESEARCH DESIGN AND QUANTITATIVE ANALYSIS
The article attempts to estimate the causal effect of gaining NPC membership on firms’ financial performance. The main threat to this inference, of course, is that membership is anything but randomly assigned. As one NPC staffer commented, “The firms in the NPC are big and famous. They provide a lot of benefits to the local economy” (Personal Interview NH002). China scholars have also demonstrated that political connections play a role in promotion throughout the party-government hierarchy (Shih, Adolph, and Liu Reference Shih, Adolph and Liu2012), and the NPC is no exception in this regard. A number of other firm characteristics—industry, state ownership, age—might also confound the relationship between NPC membership and firm performance. This selection problem poses a serious concern for any causal claim; perhaps the NPC seat is meaningless, but the NPC companies just have better financial prospects to begin with.
To address these confounding concerns, I employ an entropy weighted fixed effects design that exploits within-firm variation over time. The standard fixed effect model is as follows:
 \begin{equation}
Y_{it} = \alpha + \beta NPC_{it} + \eta _i + \theta _t + \epsilon _{it}.
\end{equation}
Here, i indexes each firm and t indexes each year; Yit represents the financial performance metrics of interest; η i are firm fixed effect parameters; θ t are year fixed effects; and ε it is the error term. Our coefficient of interest is β, the effect of NPC membership on financial performance. The analysis includes yearly data from 2005 through 2010, with the “NPC treatment” taking effect for 48 companies in 2008. I also estimate a model with a narrower three-year time window, 2007–2009, to address additional selection concerns discussed below.
As mentioned in the Introduction, researchers employing this sort of difference-in-differences thinking must argue that in the absence of the treatment, the average change in the outcome variable would be equal across both groups. This “parallel trends” assumption often appears problematic. Indeed, for this analysis, the raw data would not make for a particularly convincing counterfactual. The 48 firms that enter the NPC in 2008 prove to be in a more stable, profitable financial trajectory than the 949 that do not.
To create a more comparable control group, I employ Hainmueller’s (Reference Hainmueller2012) entropy balancing, an alternative to standard matching techniques for preprocessing data in observational studies with binary treatment variables. In using entropy balancing, the analyst first specifies a set of moment conditions that she would like to hold across the treatment and control groups. The algorithm then searches for weights for different observations in the control group to satisfy these moment conditions. In the analysis here, the goal is to achieve full balance on financial variables in the period prior to the 11th NPC, 2005–2007. The 949 companies without NPC representation will be weighted to achieve these conditions. This procedure guarantees that the treatment and control groups not only show parallel financial trends in the pretreatment period, but identical trends. They will also be balanced on a number of other important covariates: stock price, revenue, outstanding shares, firm age, state ownership, industry, debt ratio, and taxes paid.Footnote 6
The weighted fixed effect approach addresses several possible inferential issues. The firm fixed effect parameters η i account for any immeasurable firm characteristics that are constant over the analysis period—the business acumen of the CEO, the location of the firm, among others. The year fixed effects θ t remove the influence of any system level influences that are changing over time. The effects of the global recession, fluctuations in exchange rates, and other aggregate shocks are captured in this way. The entropy weighting technique lends more plausibility to the assumptions underlying this model, balancing the treatment and control groups on a rich set of historical financial performance indicators.
Thus far, I have been reticent about the possible confounding influence of political connections. If we observe a difference in performance in our “NPC portfolio” and our “non-NPC portfolio,” it may simply be because the companies that gained NPC representation have better political connections, and these connections are responsible for their performance. Given the politicized nature of China’s business environment, this alternative explanation is probably the most credible, and therefore the most pressing to address.
Recent innovative studies in Chinese politics have attempted to quantify political connections. Shih, Adolph, and Liu (Reference Shih, Adolph and Liu2012) measure connections with rich biographical data, assuming that individuals working/studying in the same place at the same time become connected to each other. Unfortunately, the detailed biographical information necessary for this location-based approach is not available for the CEOs of the 997 firms in the analysis, nor would it really capture the complexities of firm-level connections.
Rather than construct some weaker measure of connections or abandon the inquiry entirely, I attempt to account for the unobservable connections confounder through the entropy weighted fixed effects framework. Recall that the model includes firm fixed effects η i , which account for any time-invariant confounders, and year fixed effects θ t , which account for aggregate shocks. The remaining threat to inference is a factor that is changing over the analysis period, covarying with a firm’s entry into the NPC in 2008, and that is causally prior to NPC membership.Footnote 7
Political connections are not immutable, of course, but if we restrict the analysis to a short enough time period, they may be relatively constant. In other words, the benefit of a firm’s stock of connections would be captured in its firm-specific intercept. To that end, I initially run the analysis over 2005–2010, and then restrict the inquiry to a tight three-year window just before and after the 11th NPC took office in 2008 (2007–2009).Footnote 8 The estimates do not change appreciably. As a further test, and to probe the external perceptions mechanism, I replicate the weighted fixed effect analysis with weekly stock data and restrict the time period to the months surrounding the change in NPC membership in 2008. NPC firms experience a 3 to 4 RMB boost in their stock price following their membership announcement, and it is highly unlikely that changes in political connections could confound this relationship given the short time window.
The entropy weighted design may have some additional power to address the connections issue. In the final analysis, I balance the treatment and control groups on a rich set of financial covariates, including pretreatment values of the dependent variable. In a way, this indirectly controls for factors that are associated with performance.Footnote 9 In the Online Appendix, I demonstrate that balancing the NPC and non-NPC portfolios on 2007 levels of revenue, operating profit margin, returns, and stock price brings marked improvements in balance on excluded but observable covariates that are associated with performance: debt ratio, state-ownership, firm age, outstanding shares, and 2005–2006 revenue, margins, and returns. If microlevel unobservable political connections are indeed associated with performance, conditioning on previous performance may help further temper any confounding influence.
Key Variables
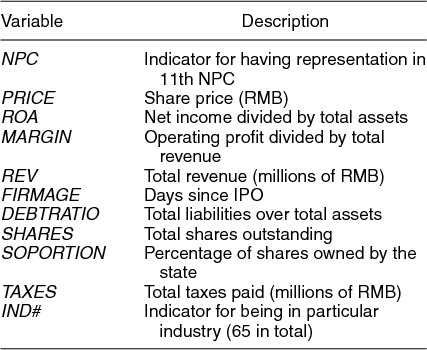
The analysis employs two key financial performance metrics as dependent variables: returns on assets (ROA) and operating profit margin (MARGIN) (see Table 2). ROA is the most basic measure of how profitable a company is relative to its invested capital. It is calculated by dividing net income by total assets, with larger values indicating that a company derives more earnings for the assets it controls. Operating profit margin, which is operating profit divided by total revenue (or sales), measures the proportion of revenue left after variable costs (wages, raw materials, etc.) are accounted for. It excludes interest income and tax payments. Both margins and returns are driven by industry characteristics and how well a firm manages its pricing and expenses.Footnote 10
Variable Definitions

Notes: All financial variables drawn from the COMPUSTAT database and measured on December 31st of the given year. All data converted into RMB using exchange rates from that date. The detailed list of industry indicators is available upon request.
To create a more plausible control counterfactual, the two portfolios will be balanced across the following financial factors for December 2007, the period directly before entry into the 11th NPC: industry (IND#), time since the initial public offering (FIRMAGE), debt ratio (DEBTRATIO), current shares outstanding (SHARES), share price (PRICE), taxes paid (TAXES), and the percentage of shares owned by the state (SOPORTION).Footnote 11 The balancing model also includes historical values from 2005 to 2007 for the two dependent variables of interest, ROA and MARGIN, as well as total revenue (REV). With these variables included, the two portfolios will have comparable financial standing directly prior to the 11th NPC, as well as identical financial trajectories over the few years prior.
Analysis and Results
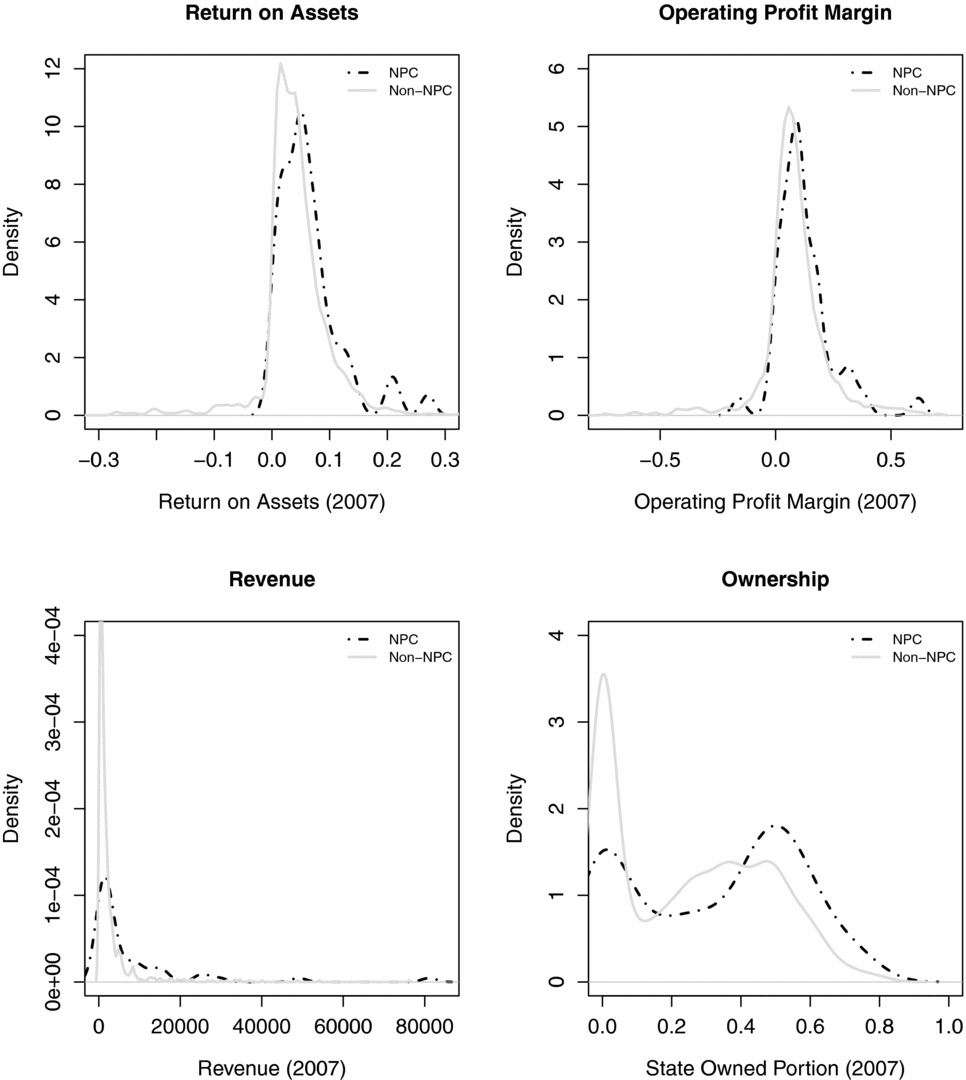
Before moving to the entropy balancing procedure, it is necessary to assess how different firms gain membership in the NPC in the first place. Figure 1 shows kernel density estimates comparing the NPC and non-NPC portfolio across key financial indicators at the end of 2007, just before entry into the 11th Congress. There is a tendency for provincial level congresses to choose CEOs from firms that are performing well. The NPC companies tend to have higher returns, operating profit margins, and revenue. Almost all have positive returns and profit margins. When estimating the effect of NPC membership, it will be necessary to account for the fact that the NPC firms are stronger performers to begin with, which could potentially confound the inference.
Understanding NPC Selection Processes

Figure 1 also shows that NPC firms are tilted towards state ownership. In the NPC portfolio, about 29% of firms have more than half their shares owned by the state, compared with about 16% in the control group.
Despite these differences, it is important to emphasize that there is considerable overlap in the covariate densities, which facilitates the balancing procedure. There are plenty of prosperous firms not in the NPC, and plenty of smaller firms that do have representation. It is precisely this overlap that makes entropy balancing possible, and conditioning on these covariates will remove these possible sources of bias.
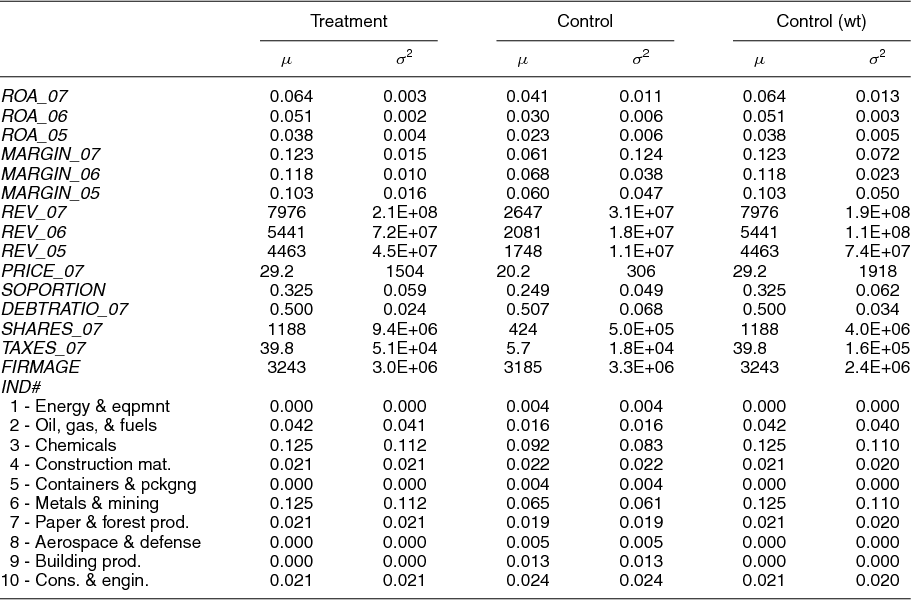
The results of the full balancing procedure are shown in Table 3. The NPC portfolio contains 48 companies altogether. Again, as the unbalanced data show, on average these firms tend to have more revenue and higher returns than their 949 non-NPC counterparts, as well as more outstanding shares and a greater portion of shares owned by the state. We also observe imbalances in the industries represented. Over 12% of firms in the NPC come from the Chemicals (IND3) and Metals and Mining (IND6) industries, while the unbalanced non-NPC firms have only 9.1% and 6.2% in these industries, respectively. Similar imbalances occur across the 55 industry indicators not depicted in the table.
Results of Entropy Balancing

Notes: Table shows results of entropy balancing across the NPC Portfolio (Treatment) and non-NPC Portfolio (Control). Industry indicators 11 through 65 not depicted in the interest of space (IND11–IND65). Treatment group has n = 48. The unweighted control group has n = 939, and the sum of the control weights equals 48.
The Control (wt) column shows the relevant sample moments for the weighted non-NPC portfolio. Entropy balancing has achieved the desired result. The weighted control group has identical average values across all the relevant covariates, and nearly identical variances.Footnote 12 The sum of the weights equals 48, the number of firms in the NPC portfolio.
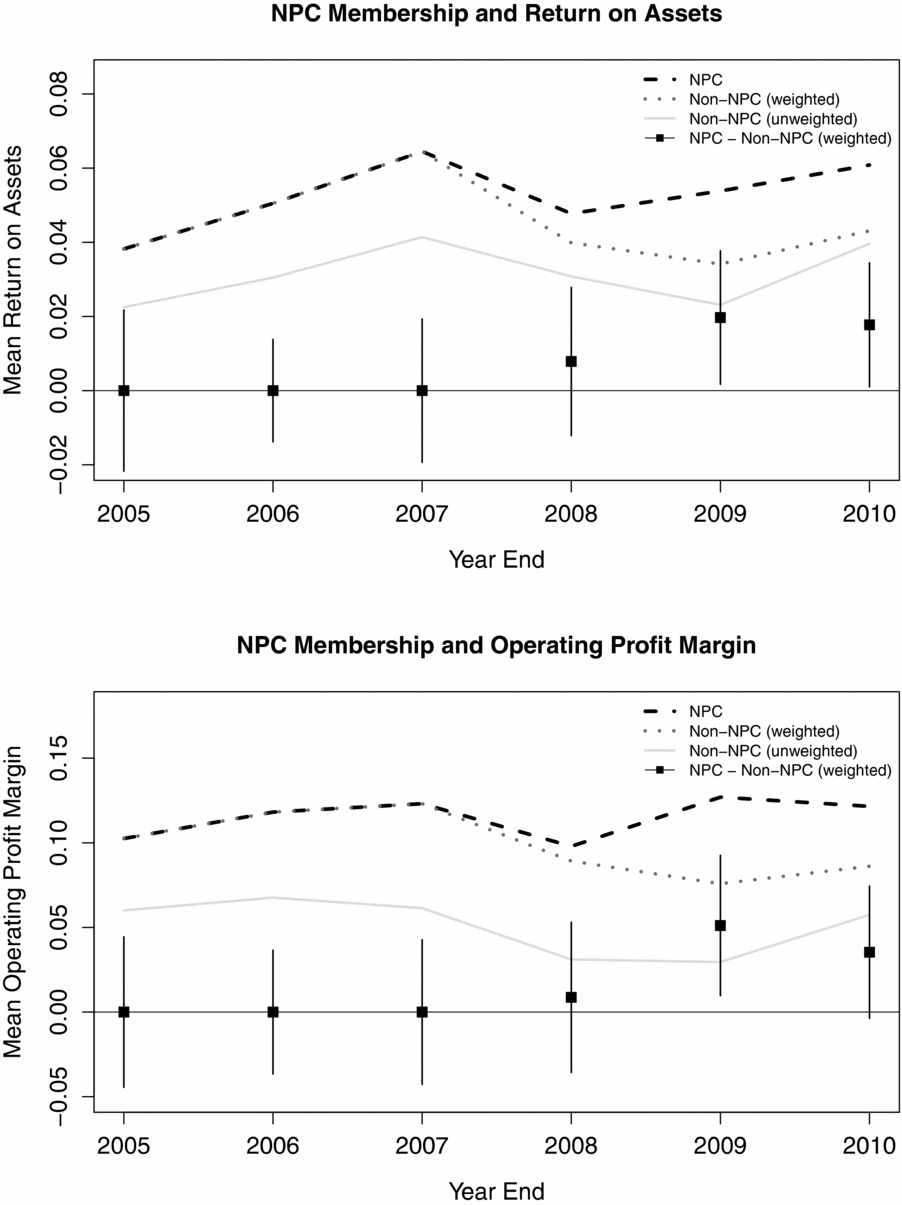
With the two portfolios balanced in the pretreatment period (2005–2007), we can now investigate the effects of NPC membership on firm performance. Figure 2 shows this visually, depicting average ROA and MARGIN for the two portfolios over the full six-year analysis period. The solid line depicts the entire unweighted non-NPC group as a reference point. The successful entropy balancing procedure ensures that the treatment and control groups behave identically from 2005–2007, shown by the overlapping dashed and dotted lines. Once the 11th NPC takes office in 2008, however, the portfolios diverge substantially. The NPC portfolio maintained an ROA of around 5% despite the global financial crisis. The weighted non-NPC portfolio plunged to nearly 3% before slowly recovering. Similarly, operating profit margin remained relatively constant at around 10% to 11% for the NPC portfolio, but fell to 7% in the counterfactual group. These performance differences continue through 2009 and 2010.
Effects of NPC Membership on Key Financial Indicators

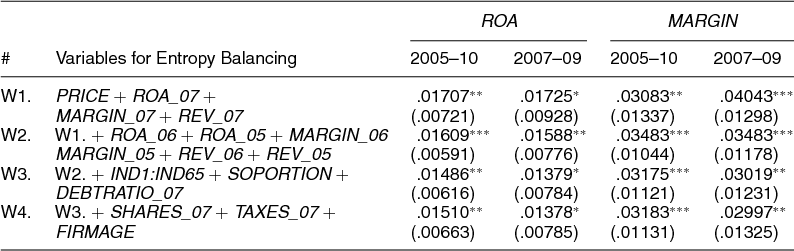
The figure suggests that NPC representation is associated with better performance, and this intuition is confirmed with more formal hypothesis testing. Table 4 presents estimates of the NPC effect for different fixed effect models. The table explores robustness across a narrow three-year (2007–2009) time window and a wider six-year analysis period (2005–2010), as well as four different entropy balancing models that include different firm level covariates. We should have the most confidence in the specifications with the richest balancing model (W4), as these models do the most to account for possible confounding influences. Collectively, the analysis suggests that a seat in the NPC is worth an additional 1.5 percentage points in returns and a 3 to 4 percentage point boost in operating profit margin in a given year. The estimates are relatively consistent across the different balancing models and time windows. This is likely because conditioning on pretreatment performance in 2007 (ROA_07, MARGIN_07, REV_07, PRICE_07) improves balance on the other confounders, as shown in the Online Appendix. All estimates reject the two-sided null hypothesis of no effect at conventional levels of statistical significance.Footnote 13
Fixed Effect Estimates and Robustness Checks

Notes: Table shows results of entropy weighted fixed effect regressions of different financial indicators on the NPC representation indicator. The table explores robustness across four different balancing models and two different analysis periods. Robust standard errors clustered at the firm level are shown in parentheses. W4 is the “baseline specification” referred to throughout the article. * p < 0.10 ** p < 0.05 *** p < 0.01.
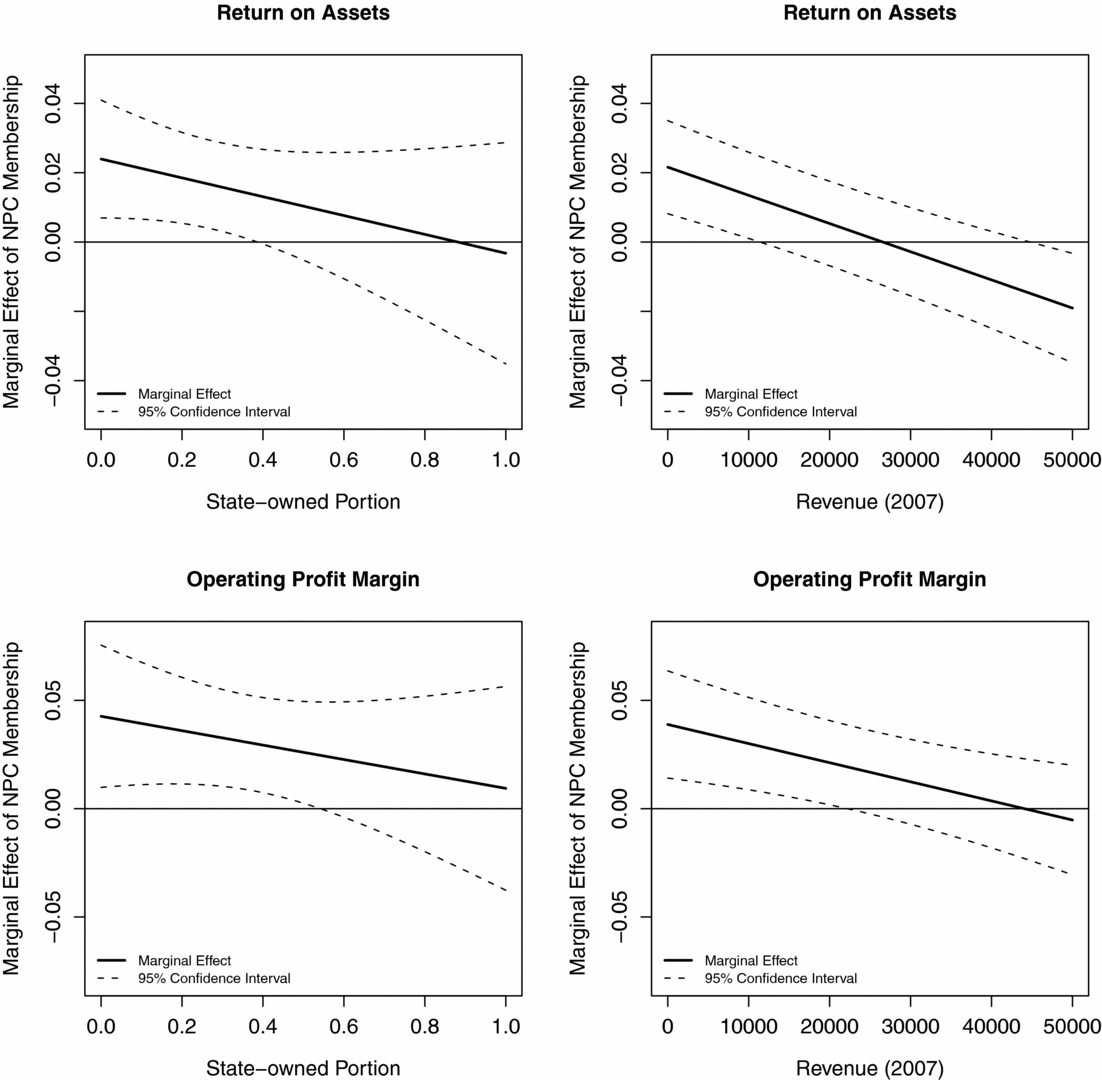
Do certain types of firms and deputies benefit more from the office? Figure 3 explores possible heterogenous treatment effects and presents estimates from models that interact the NPC indicator with firm-level covariates: state-ownership (SOPORTION), and revenue (REV_07).Footnote 14 For a firm with no shares owned by the state, the marginal effect of NPC membership on ROA is about 2.4 percentage points, and 4.3 points for MARGIN. For firms with greater than 50% shares state owned, the effect appears negligible. We observe a similar conditional relationship for revenue, with the benefits of membership decreasing substantially with firm size. The “returns to office” appear greatest for smaller, private firms. These findings will prove intuitive after we consider possible underlying mechanisms.
Conditioning Effect on State-ownership and Revenue

EVALUATING POSSIBLE MECHANISMS
The remaining task is to consider possible mechanisms through which represented companies reap financial gain. It is beyond the scope of the article to offer a comprehensive evaluation of different mechanisms, but this section provides some simple “eyeball tests” for two possibilities: formal policy influence and positive external perceptions. Interviews also point to two other likely mechanisms which are more difficult to test empirically: access to information and preferential treatment. The evidence suggests that the returns to office may stem in part from all of these sources, although interestingly, formal policy influence may prove the least salient.
Formal Policy Influence
The first possible mechanism is that CEO deputies use their seats to advance policies that favor their firms. While voting on legislation remains largely a formality, deputies are beginning to exert real influence through the opinions and motions process (Truex Reference Truex2014). Motions are short policy proposals, often calling for a new piece of legislation, that require the signatures of 30 or more deputies. Deputies may also individually file formal opinions, which tend to be shorter and less developed. These proposals are then submitted to different NPC working committees and can eventually become bills, or they may be incorporated into policies in more informal means by various ministries and agencies. Contrary to popular belief, deputy motions and opinions are taken quite seriously by the central government and can affect policy change (Jiang Reference Jiang2003, 344; Personal Interview NH001; Personal Interview NH002).Footnote 15 Many advocacy organizations, companies, and activists now lobby NPC deputies to put forth opinions and motions on their behalf (Deng and Kennedy Reference Deng and Kennedy2010). This form of interest articulation has grown increasingly important over time, with over 9,000 proposals in 2011 alone.
When prompted with the “returns to office” finding, one NPC staff member pointed to this process as the most plausible mechanism. “It isn’t that having a deputy in the NPC means the company will just directly get benefits. But the deputies can help their company and industry indirectly when they give motions and opinions” (Personal Interview NH002). For the staff member to be right, and for the formal policy influence mechanism to hold, we should observe that CEO deputies propose opinions and motions in 2008, 2009, and 2010 that differentially benefit their firms.
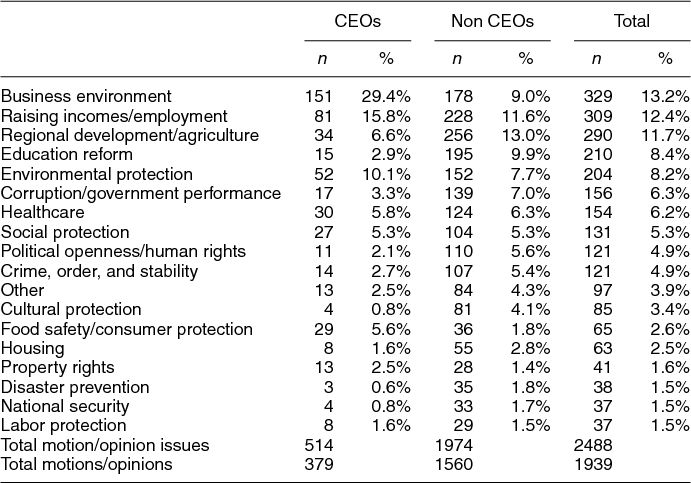
There is no information released at the national level on the results of different proposals, but we can observe whether CEO deputies raise opinions and motions consistent with the interests of their firms. In addition to data on deputy personal backgrounds, I collected data on all publicly available opinions, motions, and policy-relevant press comments from 2008 to 2010, totaling 1939 proposals in all.Footnote 16 A close analysis of this Opinion Motion Database gives mixed evidence for the formal policy influence mechanism. On one hand, CEO deputies do show a different set of priorities and seem to focus their energy on economic issues. Table 5 shows the descriptive differences between CEO and non-CEO deputy opinions and motions. Around 29.4% of all CEO deputy proposals deal with improving the business environment and regulatory conditions, while non-CEO deputies raise proposals primarily aimed at increasing regional development (13.0% of proposals), raising incomes and employment (11.6% of proposals), and education reform (9.9% of proposals).
Policy Proposals in the 11th NPC by Profession (2008–2012)

Notes: Table shows the motion and opinion issues raised by CEO and non-CEO deputies. The number of issues raised exceeds the number of total motions/opinions because some cover multiple issues. The data are drawn from the Opinion Motion Database, which was gathered by the author using Chinese newspaper sources in 2012.
On the other hand, CEO deputies may be constrained in what they can accomplish through this channel. Deputies are discouraged from lobbying for their own firms with their proposals, and none of the opinions and motions in the database are centered around firm-level issues (Truex Reference Truex2014). Instead, many deputies use their positions to comment on regulations for their specific industry. For example, Deputy Zhong Faping, who also serves as Chairman of Hunan Corun New Energy Co. Ltd., proposed an opinion to increase financial and policy support for the production of energy-efficient vehicles. Ma Yuanzhu, president of Emei Shan Tourism Company, made several suggestions to improve policy support for the tourism industry. Recall that the entropy balancing procedure includes industry indicators, and so proposals that aim to benefit the entire industry cannot really account for the findings.
Financial experts are also somewhat skeptical that deputies could use their formal policy influence to get that kind of return (Personal Interview BJ22213; Personal Interview BJ1313).
If the CEO of the company is the NPC member, he can have some say. For example, he can make a proposal to say that the government should develop the solar industry, but whether the government actually follows the idea is another thing. But at least, you have a chance to say it, and this is still important. But you can’t expect too much (Personal Interview BJ1313).
Before entirely dismissing the formal policy influence mechanism, we should note that while CEO proposals typically cover industry-wide issues, it appears that some construct their suggestions in such a way as to differentially benefit their own firms. Deputy Zhong’s proposal above calls for subsidies for energy-efficient vehicles, but he fails to mention that his company specializes in the advanced batteries used in such vehicles. In 2008, CEO deputy Sun Piaoyang called for a revision of the drug bidding system, which at the time was characterized by fierce competition among producers of low quality generic drugs. Rather than simply choose the lowest bidder, Sun suggested that hospitals should weigh both quality and price when conducting drug procurement. In line with the ideas of this proposal, drug procurement standards have recently been revised, encouraging hospitals to purchase premium medicines. Sun’s company, Jiangsu Hengrui Medicine Co., Ltd., is known for producing innovative but pricier drugs, and so it stands to differentially gain from these procurement reforms. Sun’s other main proposal suggests lengthening the patent protection period for innovative drugs. This would also benefit Jiangsu Hengrui, which tends to spend more on research and development than other Chinese firms.
To summarize, there is some limited evidence that deputies attempt to use formal policy channels to benefit their own firms, but it is unlikely that these opinions and motions are wholly responsible for the returns to office, especially given the short time frame under consideration. Other mechanisms—positive external perceptions, access to information, and preferential treatment—may be more important to company performance.
Positive External Perceptions
A second possibility is that gaining NPC membership acts as a signal to outsiders, demonstrating that a firm is well run, has achieved a certain level of status, and has connections to government officials. This “reputation boost” in turns fosters investment, business relationships, and general confidence in the firm.
One observable implication of the external perceptions mechanism is that stock prices should move in reaction to news about NPC membership. If outsiders really do take NPC membership as a positive signal, firms that gain NPC membership should experience better stock performance in the period immediately following the announcement of this information.Footnote 17 This type of event study has been used in previous research to measure the financial benefits of political connections (Ferguson and Voth Reference Ferguson and Voth2008; Fisman Reference Fisman2001; Goldman, Rocholl, and So Reference Goldman, Rocholl and So2009).
While the full membership of the 11th NPC was formally announced by the state-owned media in a Xinhua news article on February 29, 2008, the truth is that the revelation of new membership occurs over a longer period of approximately six to eight weeks. As discussed above, NPC deputies are elected by people’s congresses at the provincial level, which meet at varying times in January and February before the national-level meeting in March. Some provinces reveal their election results immediately, some delay, and occasionally candidate lists are accessible beforehand. In short, there is no one single moment where the full NPC membership list becomes suddenly known, but a longer two-month period where the information is gradually revealed. Some traders may also seek inside information on this sort of political matter (Personal Interview BJ28213a). Because it is unclear when exactly observers learn about NPC membership, the safest approach is to compare performance in the “no information” period—just prior to around January 4, 2008—to the “full information” period—following February 29, 2008.
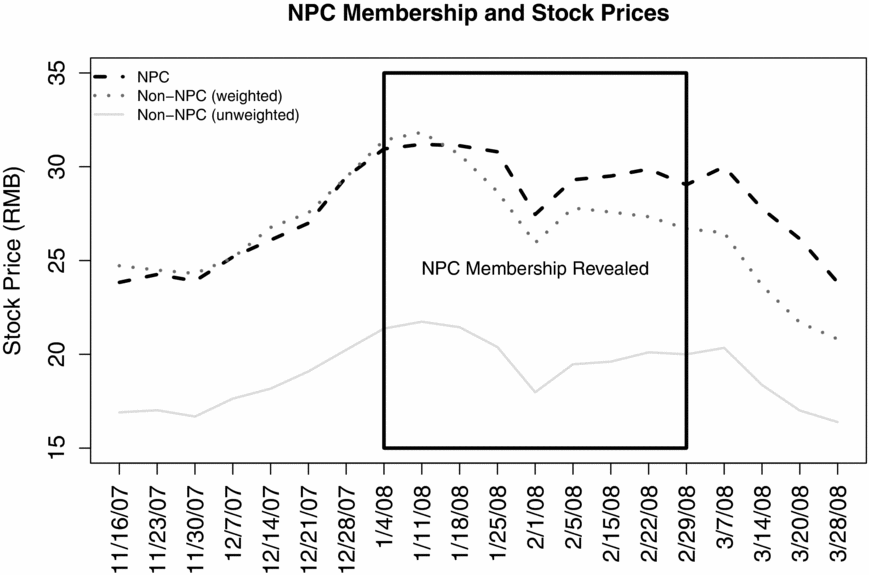
Figure 4 provides a visual test of the plausibility of the external perceptions mechanism. It shows the average stock prices (in RMB) for the NPC portfolio and non-NPC portfolio over short time window, the few weeks before and after NPC membership was revealed (shown within the dark rectangle). As before, the entropy weighting procedure creates a more plausible counterfactual and ensures the two groups exhibit comparable performance prior to the NPC treatment.
Testing the External Perceptions Mechanism

The figure offers some evidence in favor of the mechanism. In the period just prior to membership revelation, the NPC portfolio and non-NPC portfolio both had average stock prices of about 29.5 RMB per share. By the beginning of March, the average price dropped to 26.47 RMB per share for non-NPC firms, while the NPC firms maintained a price of 30.00 RMB. Two weeks later, the price difference neared 4.5 RMB. A formal weighted fixed effect analysis, similar to that conducted on the MARGIN and ROA measures, suggests that the NPC treatment brings a boost in share PRICE ranging from 3 to 4 RMB, depending on the balancing model and window of time included.Footnote 18 This effect is statistically significant at conventional levels.
Studies in other authoritarian contexts have shown that investors react to shifts in political connections (Ferguson and Voth Reference Ferguson and Voth2008; Fisman Reference Fisman2001). In the Chinese setting, the Shanghai and Shenzhen markets are known as being particularly speculative, with investors responding drastically to small pieces of news. In a survey of 2,741 Chinese investors in 2009, the China Securities Investor Protection Fund Corporation found that 68% of investors hold their stocks for less than three months. More than 80.81% follow the strategy of simply buying rising stocks and selling falling stocks, a behavioral pattern that tends to fuel price changes emanating from actual financial information (Comprehensive Survey 2009). Even if only a small subset of knowledgeable investors make the connection between NPC membership and firm performance, herd behavior among the millions of others could drive the price differences we observe.
Interviews with financial analysts confirm the intuition of the external perceptions mechanism.Footnote 19 NPC membership is a positive signal about a company and its leadership (Personal Interview BJ2313; Personal Interview BJ1313; Personal Interview BJ2313a). “In China if you are working for the NPC, it means your company is stable and good,” one financial analyst describes. “It means you have a very good background. This means good fortune for the investors, and so they will be interested in NPC companies” (Personal Interview BJ28213b). Beyond investors, NPC membership may send a positive message to potential business partners. One entrepreneur describes, “If people know you are NPC deputy, they would like to do business with you. So that’s very good for business to expand. . . People trust you. People know you have this kind of position. So they trust you. Trust is very important for business.” (Personal Interview BJ28213a).
Market analysts pay attention to NPC membership announcements, especially if a deputy and his/her company is newly selected to the congress (Personal Interview BJ28213a). One analyst went as far as to claim that NPC companies always succeed, at least in the short period after announcement.
Because you know that the stock price, it has some important relationship with the political system. In China, the share index and share price is tightly related to politics. I mean, if the CEO is the NPC member, their share price will rise in the period after. At least, at least, it won’t fall down. This is a guarantee (Personal Interview BJ1313b).
Empirically, this guarantee is not strictly true, but it illustrates how NPC membership is a strong signal to would-be investors and business partners. Together, these impressions give further support to the plausibility of the external perceptions mechanism.
Additional Mechanisms
NPC membership may offer additional benefits in the form of access to information and preferential treatment.
NPC deputies are at the center of government policymaking, and even if they cannot lobby directly for their own firms, they have an advantage in understanding government priorities and the likely direction of future policy changes. Most draft laws circulate between the NPC, the State Council, and relevant government ministries for months before they are finally made publicly available. “NPC companies have the first sense and understanding of national policies’ formulation and execution,” explains one businessperson. “They can quickly adjust their management and business practices” (Personal Interview BJ2313a). This early access may prove less relevant as transparency improves, but NPC companies will likely always have some form of an “insider’s advantage” in terms of information (Personal Interview BJ28213a).
A final advantage is that NPC companies may enjoy preferential treatment and government protection as a result of their heightened status. NPC membership signals that a firm is supported by the government, and many financial analysts express the view that membership in the NPC makes it easier to get access to credit (Personal Interview BJ2313b; Personal Interview BJ1313; Personal Interview BJ28213b; Personal Interview BJ28213a; Personal Interview BJ22213).
For an enterprise to be an NPC member, it means the government has supported you, and the bank will be very glad to lend money to you. If the CEO is the NPC member, it is much easier to get a loan from the national bank. If you are just a private company by yourself, it is very difficult. They will refuse you, or they will check on you all the time (Personal Interview BJ1313).
Similarly, NPC companies may have some protection from corruption investigations and unfavorable regulations (Personal Interview BJ1313; Personal Interview BJ2313a; Personal Interview BJ2313b; Personal Interview BJ28213b; Personal Interview BJ28213b).
For example, if the government thinks the pollution in an area is bad, they may want some enterprise to shut down its factory, but if the CEO is NPC member, he can say that his company is important to the economy and that he is important, and he can stop this. If you don’t have an NPC seat, the government will just shut it down (Personal Interview BJ1313).
It is difficult to measure this sort of preferential treatment directly, but it is likely that it is a relevant underlying mechanism behind the “returns to office.”
To summarize, my analysis suggests that the financial benefits of NPC membership come through several mechanisms. Although the NPC does allow for limited policy influence and insider information, the status symbol of NPC membership may be more helpful for business. One local business school professor describes, “What you say in the NPC does not really matter. It matters that you are an NPC member. This is the most important” (Personal Interview BJ1313). NPC membership is a positive signal that encourages investment and fosters business relationships and offers protection.
The fact that the general NPC effect proves conditional on firm size and ownership seems consistent with the mechanisms posed here. As shown above, smaller, private firms appear to benefit most from the NPC seat. Larger firms and SOEs already have relatively strong external perceptions of their brand, benefit from insider information and protection, and possess channels of influence in the Chinese political-business nexus. If the mechanisms here are correct, NPC membership should be more meaningful for smaller lesser-known firms, which is precisely what we observe empirically.
DISCUSSION
The analysis above suggests there are measurable returns to office for companies that gain seats in China’s National People’s Congress. Interviews with entrepreneurs, business professionals, and financial experts confirm the plausibility of these estimates (Personal Interview BJ22213; Personal Interview BJ28213a; Personal Interview BJ28213b; Personal Interview BJ28213c; Personal Interview BJ1313; Personal Interview BJ2313a; Personal Interview BJ2313b). When prompted with the idea that an NPC seat brings as much as a two percentage point increase in returns, one financial analyst remarked, “I do believe that. I think it’s more than two percentage points” (Personal Interview BJ28213a).
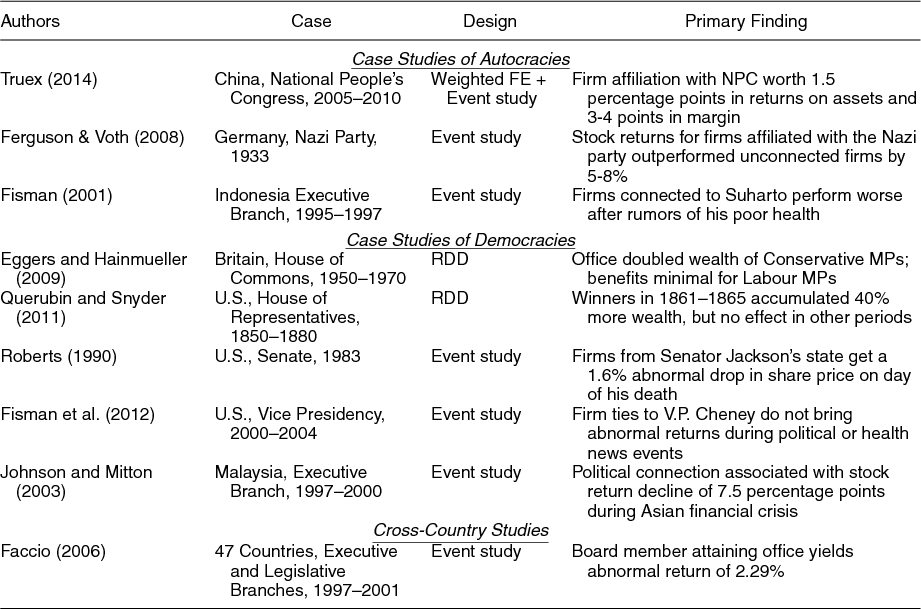
Table 6 helps contextualize the findings relative to other published studies, which have been conducted in both authoritarian and democratic cases. The two prominent studies by Eggers and Hainmueller (Reference Eggers and Hainmueller2009) and Querubin and Snyder (2011) examine the wealth of individual legislators using a regression discontinuity design, which exploits quasi-random assignment around the cutoff of electoral victory. Other studies have examined the effect of key political events on stock market prices and returns (Roberts Reference Roberts1990; Fisman Reference Fisman2001; Faccio Reference Faccio2006; Johnson and Mitton Reference Johnson and Mitton2003; Ferguson and Voth Reference Ferguson and Voth2008; Fisman et al. 2012). In her study of politically connected firms across 47 countries, Faccio (Reference Faccio2006) examines the stock returns of companies that gain a political relationship, either through a businessperson gaining office or a politician joining the firm.Footnote 20 Using event study techniques, she finds that new connections to MPs bring a cumulative abnormal return of 1.28 percent over the five-day period of the announcement.
Related Studies on Political Connections and Financial Returns

Just how high are the “returns to office” for NPC members? Among the NPC firms, the standard deviation for
 $ROA\_07$
was about .055, and the mean was .064. An effect size of .014 to .017 translates to an improvement of about one-fourth to one-third of a standard deviation. The improvement in operating profit margin is roughly the same. The standard deviation for
 $MARGIN\_07$
among the 48 NPC firms is .123, so the effect of .030 to .040 is also about one-fourth to one-third of a standard deviation. The roughly 3 RMB difference in stock price between the two portfolios represents a 10% difference in performance over the two-month period when membership was announced, as the average price was about 30 RMB in late December 2007. Because of differences in measurement and estimation, it is difficult to assess whether connections to the NPC are more or less valuable than connections elsewhere, but the analysis suggests they are certainly nontrivial.
CONCLUSION
Several prominent theories of authoritarian politics assume that parliaments allow for the distribution of rents to actors critical to regime stability (Boix and Svolik Reference Boix and Svolik2013; Bueno de Mesquita et al. Reference Bueno de Mesquita, Smith, Silverson and Morrow2003; Gandhi Reference Gandhi2008; Gandhi and Przeworski Reference Gandhi and Przeworski2006, Reference Gandhi and Przeworski2007; Lust-Okar Reference Lust-Okar2006; Magaloni 2008; Malesky and Schuler Reference Malesky and Schuler2010; Svolik Reference Svolik2009, Reference Svolik2012). This article tests for this possibility using original data on the backgrounds and behaviors of deputies to China’s National People’s Congress, an institution widely dismissed as a meaningless “rubber stamp.” It suggests there are real “returns to office” for companies whose CEOs gain membership in the body. Interestingly, these returns may be greatest for smaller, private firms, and seem to come primarily through external perceptions and the “reputation boost” of the position. Deputies need not be corrupt or narrowly self-interested—although some certainly are—to receive benefits from their offices.
Of course, we should be careful in generalizing too far from the analysis, which is limited to CEO deputies in the 11th NPC. It is difficult to assess whether the “returns to office” have increased or decreased over time, whether non-CEO deputies enjoy similar benefits, and whether the results extend to other authoritarian systems.
With respect to the second issue, my hypothesis is that the benefits of NPC membership are likely heterogenous, and driven by personal background. According to NPC Deputy Database, about 50 deputies can be considered heroes, athletes, or celebrities of some kind. Another 163 are members or alternates of the CCP Central Committee, and 22 of those are Politburo members. The social status of these types already exceeds that of an NPC deputy, and so it is unlikely that the office brings much in the way of increased positive external perceptions, in the same way that an NPC seat does not do much for larger, prominent firms. The rest of the deputies are lower status, scattered across an array of industries and professions. Among them are schoolteachers, farmers, migrant workers, professors, low ranking officials, factory owners, and small entrepreneurs. For these types, NPC seats may bring real advantages, perhaps exceeding those gained by the 48 CEOs studied here. As the Chinese system continues to grow more transparent, it may be possible to replicate and extend this analysis for non-CEO deputies, and even other political institutions.
In terms of validity beyond the Chinese case, my expectation would be that similar results hold in other authoritarian regimes. As discussed in the Introduction, the NPC is considered quite weak in terms of influence in the Chinese system, and is a challenging case for rent distribution theories for that reason. Parliaments in other systems have more substantial policymaking authority, and this may give connected firms increased influence and prestige. Again, the replication and extension of this research design could be helpful in developing this comparative perspective.
If seats in so-called “rubber stamp” authoritarian parliaments are indeed valuable, future research should continue to explore the microdynamics of these institutions (Malesky and Schuler Reference Malesky and Schuler2010; Malesky, Schuler, and Tran Reference Malesky, Schuler and Tran2012; Manion Reference Manion2011; Truex Reference Truex2014). Do parliaments in nondemocracies afford anything in the way of popular representation? What motivates legislator behavior in the absence of free and fair elections? Are rents part of larger incentive systems? Through what mechanisms do parliaments contribute to growth and stability? If the analysis here inspires future research on this important set of questions, it will have achieved its purpose.
Online materials
To view online material for this article, please visit http://pantheon.yale.edu/˜rot3/





Comments
No Comments have been published for this article.