

There has been a dearth of political science research on public opinion toward higher education. Articles on this subject occasionally appear in education-focused publication outlets (Kelderman Reference Kelderman2023; Smith Reference Smith2023), drawing on reports issued by various polling organizations (Jones Reference Jones2025; Ray Reference Ray2024). But it remains difficult to find a concise summary of contemporary views on higher education, and there are vanishingly few research articles or books that delve more deeply into the dynamics of public opinion (for an exception, see Gavazzi and Gee Reference Gavazzi and Gee2021). There has been far greater public scrutiny and discussion of K–12 educational policy than higher education in past decades, which may help to explain why public support for higher education has generated little research attention (Clinton and Grissom Reference Clinton and Grissom2015; Frankenberg and Jacobsen Reference Frankenberg and Jacobsen2011; Hochschild and Scott Reference Hochschild and Scott1998; McClellan et al. Reference McClellan, Kilibarda, Sinozich and Shapiro2018).
The salience of higher education policy increased rapidly, however, during the second Trump administration, which has cut funding for higher education programs and projects that focus on diversity, equity, and inclusion (DEI) and has accused some universities of failing to combat antisemitism on campus, amplifying a long-standing conservative critique of higher education (Buckley [Reference Buckley1951] 1977). This raises important questions about where the public stands on the value, cost, societal contributions, and potential problems at American colleges and universities.
The higher education sector is thriving in some respects but also faces real challenges. Students continue to enroll in universities and colleges and those who attain a higher degree continue to earn more than those without a college degree (Scherer and King Reference Scherer and King2025). The economic value of a degree has slowly declined, yet remains valuable, especially for female graduates (Zhang, Liu, and Hu Reference Zhang, Liu and Hu2024). At the same time, however, the sector is confronted by long-standing and more recent problems. Americans have complained for years about the high cost of college tuition. In a 2011 national Pew poll, 75% of respondents said that college was too expensive for most Americans (Taylor et al. Reference Taylor, Parker, Richard Fry, Wang, Velasco and Dockterman2011; see also Lumina Foundation and Gallup 2013). Concerns about political bias and balance on campus is a more recent issue, with leaders at institutions such as Columbia University and Harvard University acknowledging the existence of antisemitism. These problems are now paired with a vocal Republican and conservative critique of higher education.
To take stock of American views on higher education, we review the last 10 to 15 years of public opinion data on higher education, drawing on cross-sectional national polls conducted by major polling organizations such as Gallup, Pew, and New America’s annual Varying Degrees survey. One of the underlying puzzles in the public opinion data we review is the tension between declining public confidence in the sector, on the one hand, and the continued popularity of college and the desirability of a college degree, on the other. We first review and summarize familiar evidence of a downturn in general public support for higher education over the last decade, which is driven by increasingly negative evaluations of higher education among Republicans. We then complicate that picture by providing far less familiar evidence of minimal partisan disagreement about the value of a college degree, its positive contribution to a strong US workforce, and the importance of university-based scientific and medical research. The absence of partisan polarization on the perceived value of higher education’s products is striking given the highly polarized nature of contemporary American politics, providing unfamiliar but valuable insight into Americans’ views of the sector.
Politicizing Higher Education
In his first bid for presidential office in 2016, Donald Trump raised concerns about the cost of higher education, a concern shared by many Americans. He discussed student debt relief, suggested that universities cut tuition, and threatened wealthy private universities with the loss of their tax-exempt status if they failed to lower student costs (Jaschik Reference Jaschik2016). Trump made little headway in his first term, however, on his higher education agenda. He enacted a travel ban on students from specific world regions but did little else (Braaten Reference Braaten2017). Trump has pursued his agenda more actively in his second term and has expanded it to incorporate conservative concerns about political bias on college campuses. Since the beginning of 2025, the Trump administration has worked to eliminate DEI programs on university and college campuses, banned federal funding for such programs, issued lists of forbidden diversity-related terms in federal research grant applications, and refused access to and attempted to deport specific subsets of international students (Chronicle Staff Reference Staff2025). The administration has tackled the existence of antisemitism on various Ivy League, private, and state university campuses and has tied federal funding to its eradication (Chronicle Staff Reference Staff2025). It also encouraged Congress to increase tax rates on wealthy university endowments in the One Big Beautiful Bill Act, signed into law in July 2025.
The second Trump administration’s complaints about higher education were fueled less by concerns about the cost of higher education, voiced more frequently in Trump’s first term, than by concerns about “woke” behavior on college campuses. Trump’s concerns about campus bias were far more pointed in 2025 than previously, and his higher education agenda has been mirrored by actions at the state level. Under Republican governor Ron DeSantis, Florida has banned public institutions from funding DEI programs, restricted course content, and placed limits on faculty tenure (Bryant and Appleby Reference Bryant and Appleby2025; Kumar Reference Kumar2022).
The actions of state governments and the Trump administration reflect a long-standing conservative critique of higher education that began in 1951 with William F. Buckley’s publication of God and Man at Yale (Chamberlain Reference Chamberlain2006), a critique that has gained momentum in the ensuing decades. The Reagan administration cut federal funding for higher education in the 1980s (Kandimalla Reference Kandimalla2023). Affirmative action was challenged and ultimately overturned in 2023 by the Supreme Court in Students for Fair Admissions v. Harvard (Pilar Reference Pilar2023). Moreover, conservative organizations such as the Heritage Foundation, American Enterprise Institute, and Turning Point USA have actively challenged ideological imbalances on college and university campuses, promoting the creation of “Western civilization” centers at several state universities (Quinn Reference Quinn2024; Younger Reference Younger2025).
As higher education has come under close political scrutiny, there is ample evidence of its past and continued success. Higher education is widely regarded as an engine of economic mobility in the United States (Chetty et al. Reference Chetty, Friedman, Saez, Turner and Yagan2017), a reality reflected in increasing rates of college attendance over time. According to the US Census Bureau, the percentage of adult Americans aged 25 and older with a college degree increased from a low of 8% in 1960 to a high of 38% in 2021 and 2022. The number of college freshmen is projected to grow over the next year or so (Welding and Bryant Reference Welding and Bryant2025), indicating continued interest in obtaining a higher degree, although the absolute number will decline after that because of changing college-aged cohort sizes (Knox Reference Knox2024).
How does the popularity of college and the desirability of a college degree square with ongoing problems in the sector and accusations of political bias and restricted campus speech? We review recent polls on higher education to underscore a clear paradox in Americans’ attitudes. There is a continued belief in the value of a higher degree and admiration for its medical and research accomplishments, combined with declining trust in higher education institutions and widespread concerns about their cost, accessibility, and potential political bias. Throughout this review, we analyze American public opinion in its entirety and also examine areas in which Republicans and Democrats agree and disagree on higher education’s virtues and vices to identify where the Republican critique of the sector may have dampened Republicans’ (and perhaps Democrats’) support, potentially polarizing and souring public sentiment.
Public Opinion on Higher Education
There is ample evidence in past polling reports of a decline in general support for higher education, especially among Republicans (Jones Reference Jones2025), providing a fascinating context in which to study how an issue becomes politically polarized. We examine public opinion on a diverse set of questions, going beyond broad evaluations to describe public support for, and partisan polarization (or its absence) in, different facets of higher education. We present well-known evidence of partisan polarization, but also delve more deeply into public opinion to illuminate areas of higher education in which partisan polarization is modest or absent. In this way, we hope to provide a more complex and complete picture of the public’s stance.
We examine data from cross-sectional national polls on higher education that begin around the time of the first Trump administration (and in a few cases even earlier), recruit high-quality samples, and have tracked similar aspects of public opinion over time. We examine partisan viewpoints on numerous aspects of higher education. Data are presented separately for Democrats and Republicans when their differences are especially marked. On other aspects of public opinion, characterized by partisan consensus, we depict aggregate American opinion and relegate evidence of muted or nonexistent partisan differences to tables included in the online appendix. We focus primarily on the differences and similarities in attitudes between Democrats and Republicans, and pay less explicit attention to political independents, because partisans are most likely to hold polarized attitudes in response to Trump administration rhetoric.Footnote 1 We briefly summarize trends in the views of political independents in a separate section toward the end of our poll review.Footnote 2
We provide descriptive evidence on public opinion toward higher education based on a series of cross-sectional polls and make clear at the outset that we do not have panel data to verify change over time at the individual level. We also cannot rule out cohort replacement as an explanation for the observed poll trends—which could be driven by more pessimistic attitudes among the youngest adults, for example—although we address that possibility for several of the New America polls for which we have the underlying data. We are also unable to test causal claims concerning the origin of trends in public opinion over time, but we hope our description of opinion trends stimulates future research along these lines.
Data Sources
We rely on several data sources to draw a picture of American public opinion. Since 2017, New America has funded Varying Degrees, an annual cross-sectional survey of Americans’ attitudes toward higher education that is one of the broader, more comprehensive, and more consistent national surveys on higher education. The data are based on a probability sampling frame (Ipsos random-digit dialing telephone frame; NORC’s Amerispeak online panel), and some but not all questions have been asked since 2017. In addition, we include annual cross-sectional data from better-known polling organizations such as Gallup, Pew, and media organizations that have partnered with them (e.g., Associated Press). We also include several polls sponsored by the Association of American Universities (AAU). Information on each poll—including sponsor, report and data links, data collection agency, dates, and sampling frame—are included in table A1 in the online appendix. We do not have the original datasets for all polls, but have data for the New America series and estimate the significance of partisan differences for those data, which is noted in relevant appendix tables. The data and code for statistical tests are archived in the Harvard Dataverse (Huddy and Yilmazturk Reference Huddy and Yilmazturk2026). All data are weighted to match national demographic benchmarks.
Overall Evaluations of Higher Education
Public Confidence
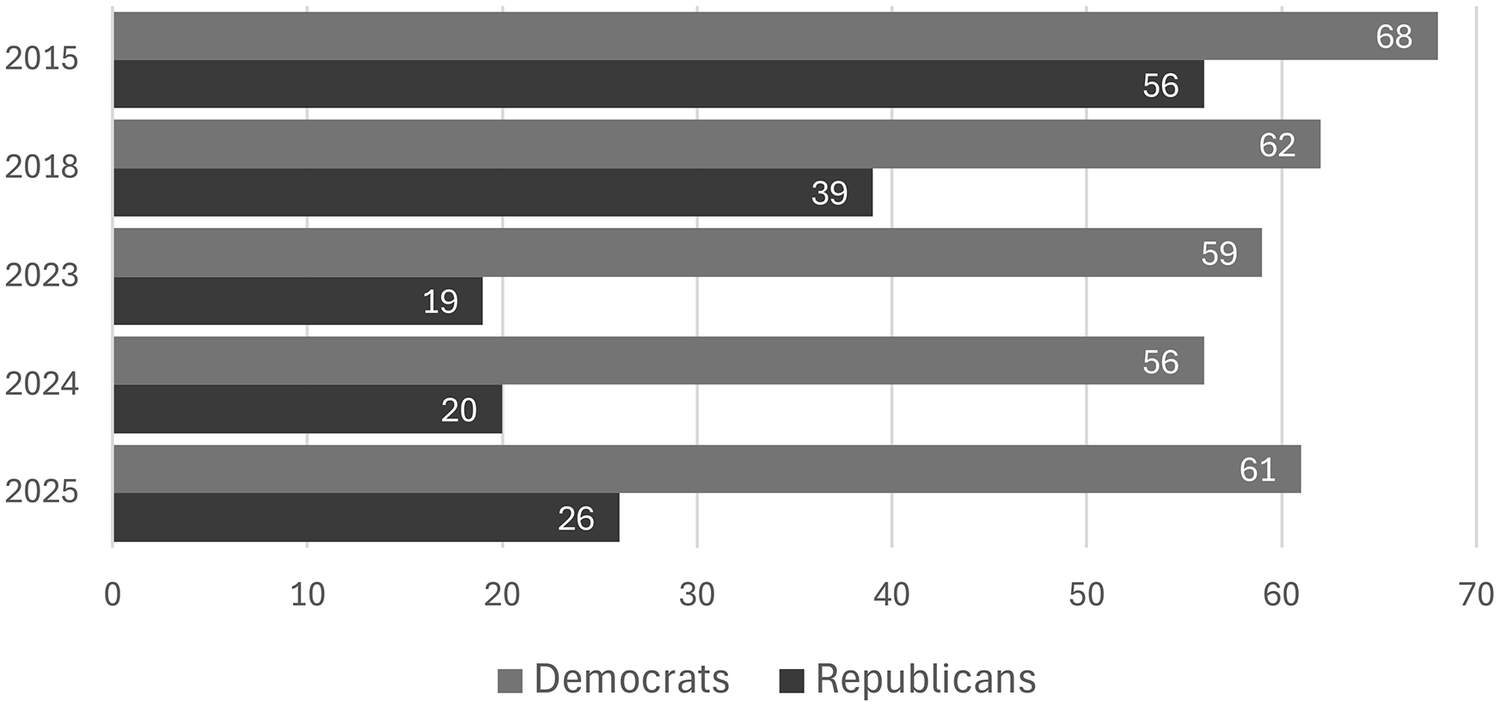
We begin by examining Americans’ broad evaluation of higher education. Gallup has tracked public confidence in higher education since 2015, repeating the question in 2018, 2023, 2024, and 2025. During this period, there has been a clear decline in the percentage of Americans who have a great deal or quite a lot of confidence in higher education (from 57% in 2015 to 42% in 2025) (Brenan Reference Brenan2023; Jones Reference Jones2024; Reference Jones2025). This decline has been far more precipitous among Republicans than Democrats, however, consistent with the influence of conservative and Republican critiques of higher education that have escalated in the Trump era. Among Republicans, support declined from 56% who expressed a great deal or quite a lot of confidence in higher education in 2015, when partisan differences in confidence were modest in size, to 26% in 2025, when partisan differences were much larger, resulting in a partisan gap of 30 percentage points in 2025 (see figure 1).
Percentage of Americans with a Great Deal or Quite a Lot of Confidence in Higher Education
Sources: Brenan (Reference Brenan2023); Gallup (2015); Jones (Reference Jones2024; Reference Jones2025); Saad (Reference Saad2018).

Figure 1 Long description
The bar chart tracks the percentage of Americans reporting “a great deal” or “quite a lot” of confidence in higher education. Confidence declines overall from about 57% in 2015 to about 42% in 2025. Republican confidence falls most dramatically, from roughly the mid-50% range in 2015 to about 26% in 2025. Democratic confidence remains substantially higher throughout the period, producing a partisan gap of approximately 30 percentage points by 2025. The figure illustrates increasing partisan polarization in confidence toward higher education.
Interestingly, the Trump administration may have generated a mild backlash among all Americans in the first part of 2025, when confidence increased by six percentage points among Republicans, five points among Democrats, and by six points overall (see appendix table A2 for information on political independents). Levels of confidence varied with institution type in Gallup data collected in 2024 and 2025 (but not earlier), and were roughly 10 percentage points higher for community colleges and two-year colleges and universities than they were for four-year institutions. Nonetheless, Republican confidence in two- and four-year institutions increased noticeably between 2024 and 2025, from 15% who said they had a lot or quite a lot of confidence in four-year colleges in 2024 to 36% in 2025 (see appendix table A3). Of course, it is important to note that the partisan divide in confidence in four-year colleges and universities remained vast in 2025 (26% among Republicans versus 66% among Democrats; see appendix table A3).
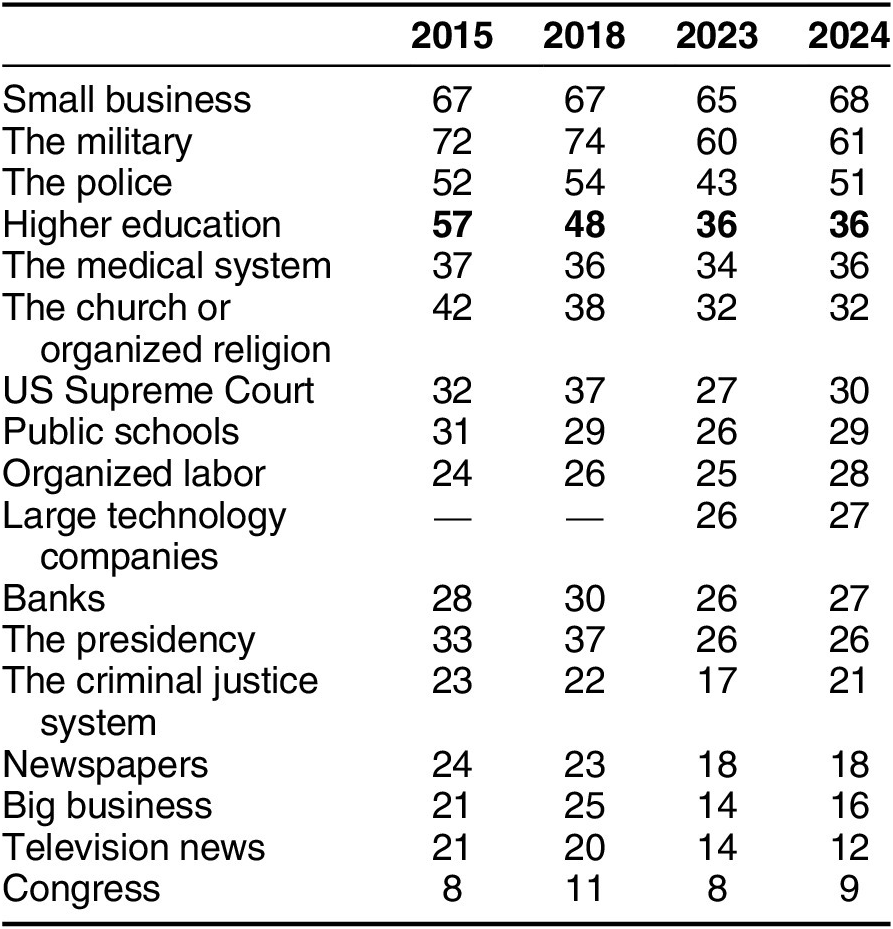
The erosion of public confidence in higher education over time is more pronounced than the decline in confidence in other American institutions, as seen in Gallup data collected over the last 10 years and shown in table 1. In 2015, higher education was one of four major institutions in which a majority of the public expressed a great deal or quite a lot of confidence. In 2024, a majority of the public still expressed confidence in the other three institutions—small business, the military, and the police, albeit with some erosion of confidence in the military. In contrast, confidence in higher education plummeted from 57% in 2015 to 36% in 2024, indicating a decline of 37% from its initial value. As seen in figure 1, that decline can be attributed to a steep decrease in confidence among Republicans. There was also a sizable drop in confidence in television news, newspapers, the church, and big business. Confidence in television news dropped most dramatically in terms of initial levels of support (by nine points, or 43% of its initial value of 21%). Higher education was right behind television news, with both dropping by a larger percentage of their initial support than other institutions.
Confidence in American Institutions

Table 1. Long description
The table reports the percentage of Americans expressing a great deal or quite a lot of confidence in institutions including small business, the military, police, higher education, the medical system, religion, the Supreme Court, public schools, labor unions, banks, the presidency, newspapers, television news, big business, and Congress. Small business, the military, and police receive the highest ratings. Higher education declines from 57% in 2015 to 36% in 2024, one of the largest drops among the institutions shown. Confidence in television news, newspapers, religion, and big business also declines. Congress receives the lowest confidence ratings throughout.
Sources: Brenan (Reference Brenan2023); Gallup (2015); Jones (Reference Jones2024); Saad (Reference Saad2018).
Note: The exact question wording is as follows: “How much confidence do you, yourself, have in each one—a great deal, quite a lot, some, or very little?” Figures represent the percentage of respondents who say they have a great deal or quite a lot of confidence in each institution.
In 2024 and 2025, Gallup asked Americans who lacked confidence in higher education to explain why. The most common reasons focused on inadequate workforce preparation (e.g., wrong focus), expense, and the pursuit of political agendas in the classroom. In 2024, costs and wrong focus were the most frequently mentioned. In 2025, this had been surpassed by concerns that higher education had become politically skewed (see appendix table A4). As we note in later sections of this article, affordability is a long-standing public concern that crosses partisan boundaries whereas political bias is a greater concern among Republicans than among Democrats.
Positive or Negative Effect on the Nation
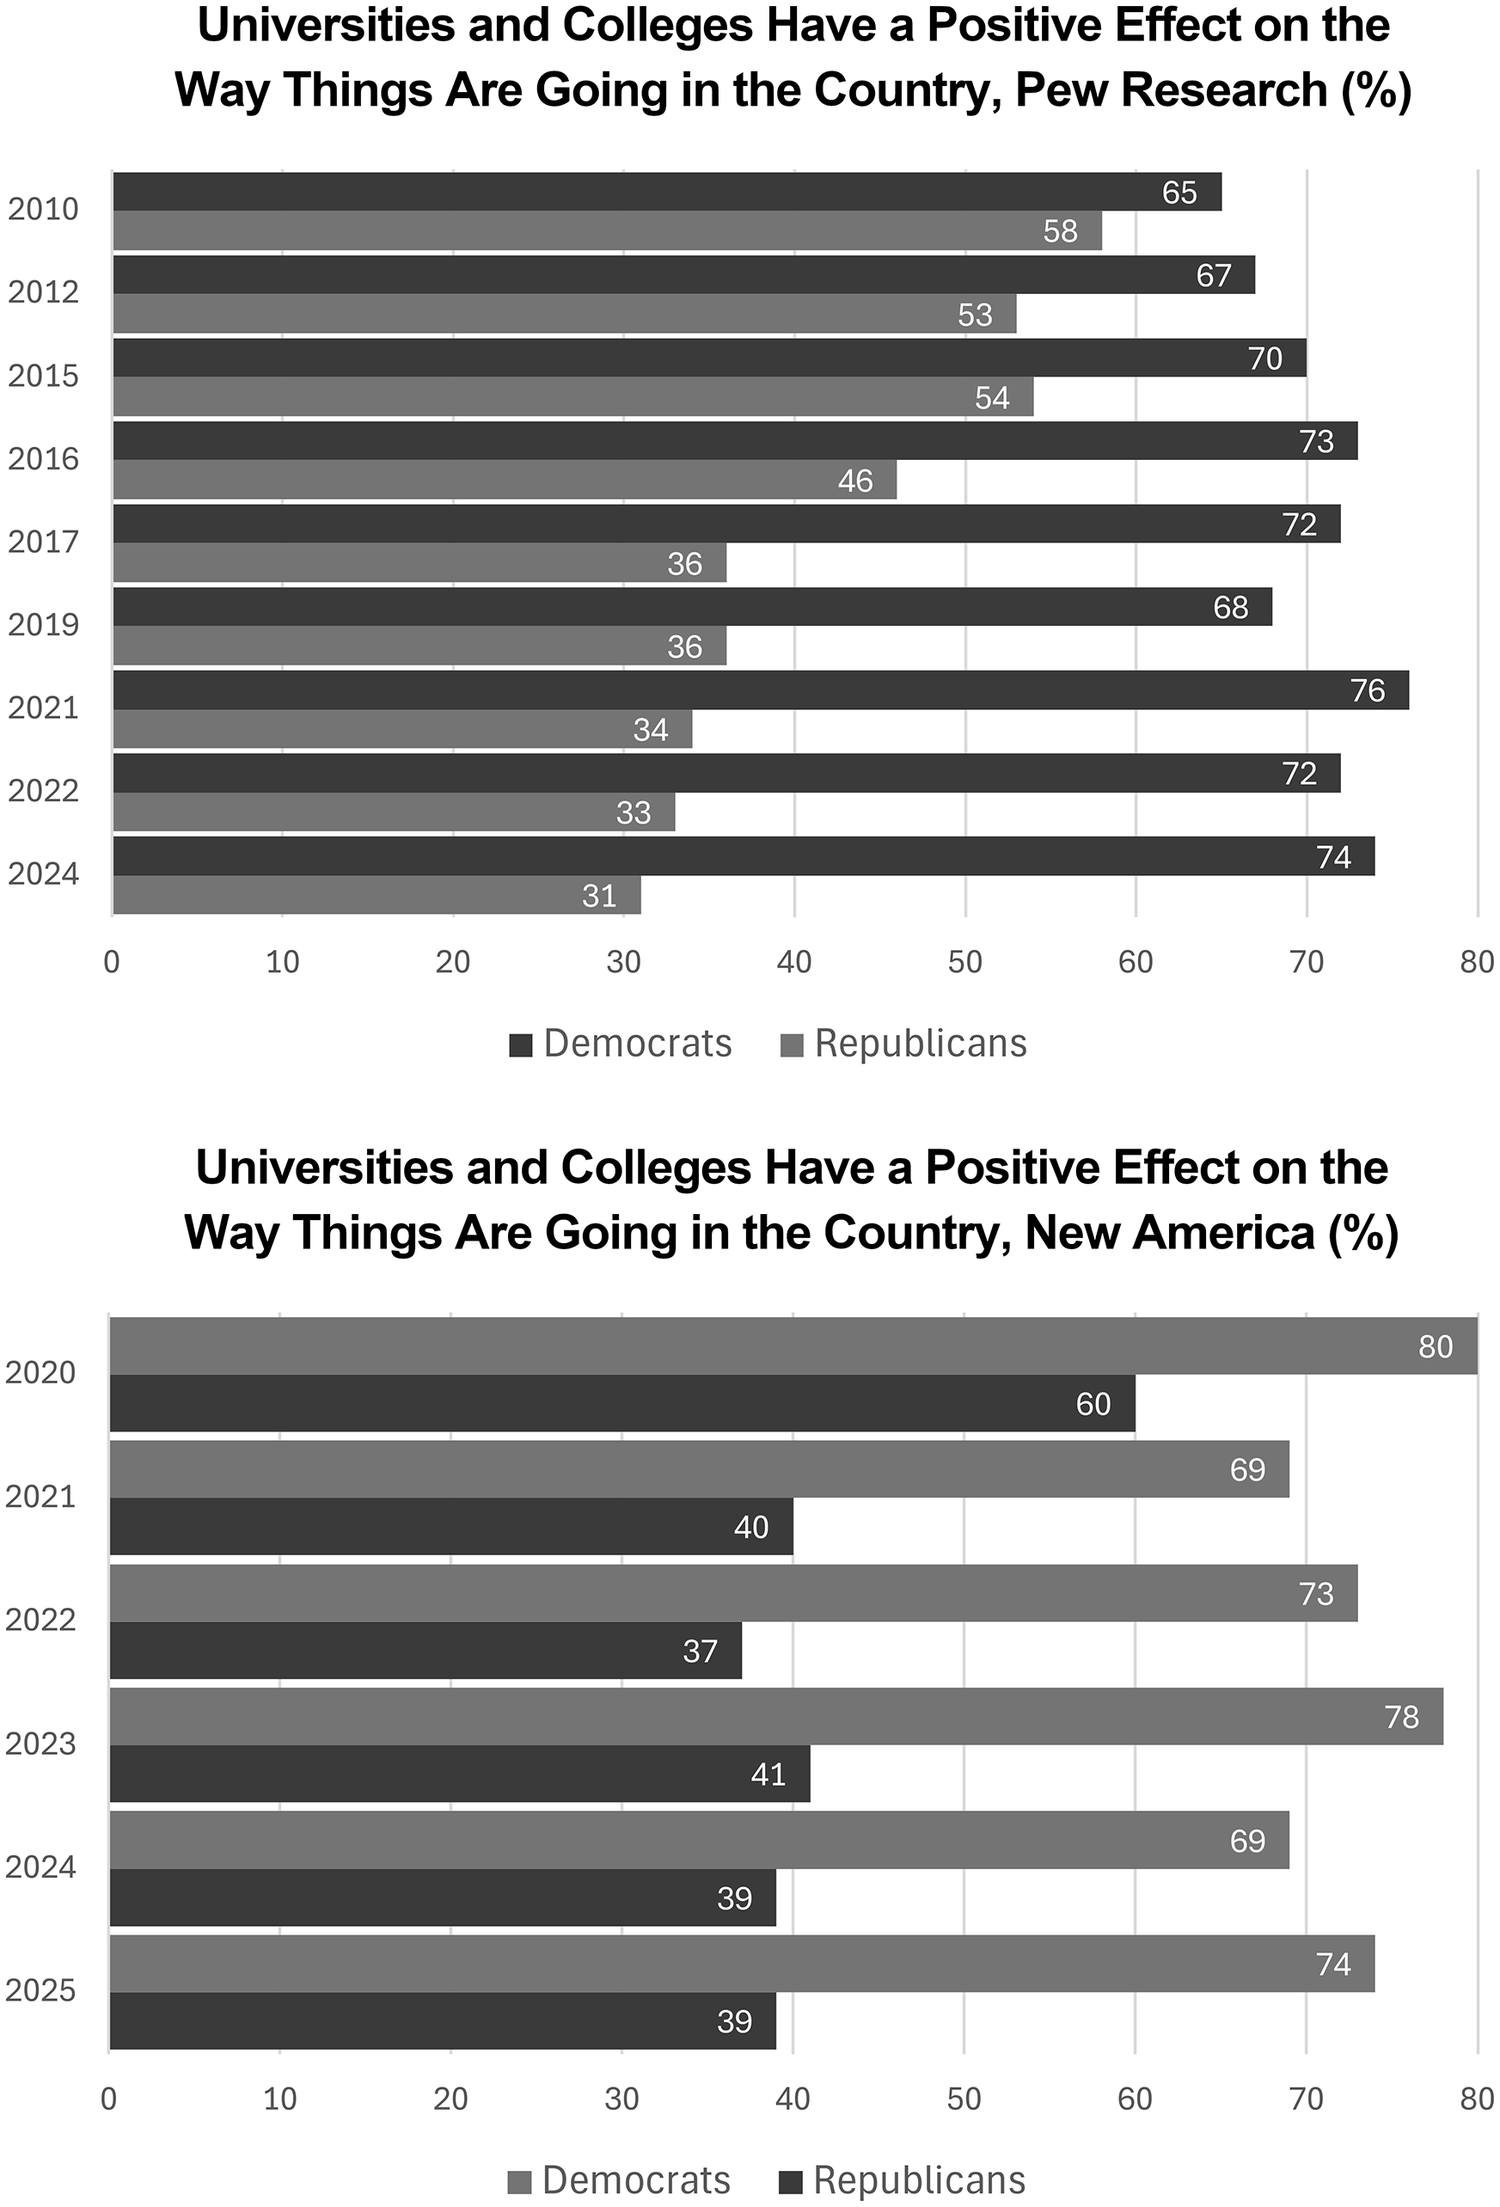
Pew began asking Americans in 2010 whether they thought “colleges and universities are having a positive or negative effect on the way things are going in the country,” and has repeated this question on a regular basis since then. In 2010, 61% of Americans (58% of Republicans and 65% of Democrats) thought higher education was having a positive effect on the country, a number that had decreased slightly to 53% in 2024 (see appendix table A5). The modest decline in positive assessment masks a far more dramatic decline in Republican ratings, however. In 2010, 58% of Republicans viewed the effects of higher education positively, differing little from Democrats (65% held a similar positive view), but Republican ratings dropped below 50% in 2016 and have continued to decline. In 2024, fewer than a third of Republicans rated higher education as having a positive national effect compared with two-thirds (74%) of Democrats. As seen in the top panel of figure 2, the partisan gap in positive views of higher education increased markedly in 2016 and has continued to grow, rising to a difference of 43 percentage points in 2024. Figure 2 also makes clear that positive Republican ratings declined most dramatically from 2015 onward, suggesting that much of the decline in Republican ratings for higher education has occurred during the Trump era.
Positive Effects on the Country
Sources: Cheche, Nguyen, and Sawyer (Reference Cheche, Nguyen and Sawyer2025); Dunn and Cerda (Reference Dunn and Cerda2022); Fishman et al. (Reference Fishman, Johnson, Nguyen and Romo-González2021); Fishman, Nguyen, and Cheche (Reference Fishman, Nguyen and Cheche2023); Fishman, Nguyen, and Woodhouse (Reference Fishman, Nguyen and Woodhouse2022); Francisco, Fishman, and Nguyen (Reference Francisco, Fishman and Nguyen2020); Green (Reference Green2021); Keeter et al. (Reference Keeter, Hatley, Kennedy and Lau2017); Nguyen, Fishman, and Cheche (Reference Nguyen, Fishman and Cheche2024); Pew Research Center (2010; 2012; 2015; 2017; 2019;2020; Reference Fry, Braga and Parker2024).

Figure 2 Long description
The figure contains two panels. The top panel uses Pew data from 2010–2024 and the bottom panel uses New America data from 2020–2025. Both show declining Republican assessments of higher education’s positive impact on the country, while Democratic assessments remain substantially higher. Republican ratings fall below 50% around 2016 and continue downward. By the most recent years, Democrats are much more likely than Republicans to say colleges and universities have a positive effect on the nation. The figure emphasizes growing partisan polarization.
New America’s Varying Degrees surveys include the same question asked by Pew, concerning the positive and negative effects of colleges and universities on the country. The New America series starts in 2020, recording an unusually high level of overall support (69% of Americans in New America’s survey compared with 57% in Pew’s). By 2021, the New America and Pew series converge, documenting comparable levels of support among all respondents (58% in New America, 57% in Pew) and among Republicans (40% in New America, 34% in Pew) (see appendix table A6). Data in the New America survey series thus confirm the growing decline in Republican support for higher education during the early 2020s. On balance, more Americans rated the effects of higher education as positive (55%) than negative (44%) in 2025 (see appendix table A6), but this finding is driven by continued positive ratings given by Democrats and political independents.
It is difficult to confirm that American opinion actually changed over time because of the cross-sectional nature of the data. One alternative explanation is that younger cohorts have more negative attitudes toward higher education, shifting aggregate opinion downward. We were able to test and reject this hypothesis in a limited fashion using the New America data, which reveal a broad-based downward shift in Republican attitudes between 2020 and 2025 among all birth cohorts. The Republican cohort that came of age between 2020 and 2025 was slightly more positive than older cohorts in 2025 (50% positive versus 39% positive for all Republicans), and the percentage who rated higher education positively dropped among all 2020 birth cohorts between 2020 and 2025. For example, 76% of Republicans aged 20–29 in 2020 rated the effects of higher education positively compared with 44% in 2025; a similar decline is observed among the oldest cohort aged 70 and older in 2020, among whom positive ratings declined from 56% in 2020 to 35% in 2025.
Going in the Right or Wrong Direction
In 2018 and 2020, Pew asked Americans whether higher education was heading in the right or wrong direction. Over half of all Americans thought it was heading in the wrong direction at both time points (61% in 2018 and 56% in 2020). Democrats were more positive than Republicans, but leaned toward believing it was heading in the wrong direction in 2018 (52% picking “wrong direction” versus 46% picking “right direction”) and were evenly divided in 2020 (49% versus 49%) (see appendix table A7). Respondents who said higher education was going in the wrong direction in 2018 were asked whether several factors played a major, minor, or no role in determining their position. The most common major reason was the high cost of tuition (84%), followed by a failure to provide students with workplace skills (65%), being overly concerned about protecting students from offensive views (54%) and professors being overly political (50%) (see appendix table A8).
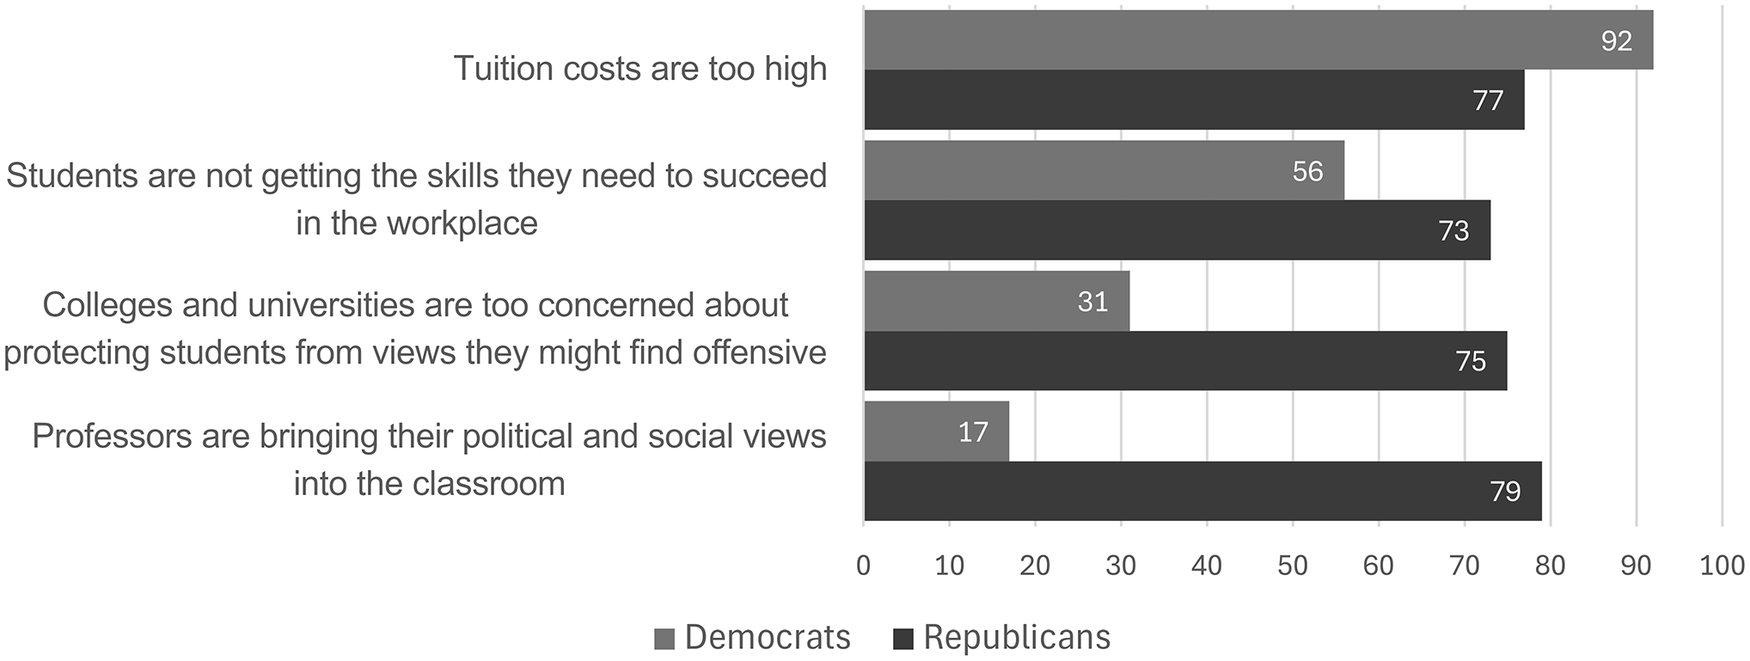
There are some partisan similarities and clear partisan differences in the explanations provided for higher education’s perceived wrong turn in the Pew data (see figure 3). Both Democrats (92%) and Republicans (77%) viewed the high cost of tuition as a major reason for their negative assessment, a long-standing concern for Americans. Most Democrats (56%) and Republicans (73%) agreed that the failure to give students needed workplace skills is also a major issue. Partisans diverged widely, however, in their concern about political bias on campus. Over three-quarters of Republicans said that professors bringing their political and social views into the classroom (79%) and the protection of students from views they might find offensive (75%) were the major reasons for their dissatisfaction with higher education. In contrast, a minority of Democrats identified either as a major reason for their negative assessment of higher education.

Figure 3 Long description
The chart compares partisan responses to several possible explanations for dissatisfaction with higher education. Both Democrats and Republicans identify high tuition costs as a major reason. Both groups also cite inadequate workforce preparation. Republicans are far more likely than Democrats to identify professors bringing political views into the classroom and excessive protection from offensive viewpoints as major problems. The figure shows that concerns about affordability are bipartisan, while concerns about political bias are highly polarized.
Greater Republican discontent over the political direction being taken by higher education is consistent with recent conservative and Republican political rhetoric, and a likely product of elite influence. The increased salience of that message in recent years may help to explain plummeting Republican support and growing partisan polarization surrounding higher education.
Political Bias on Campus
We turn to examine more closely perceived political bias on college campuses as a potential explanation for Republicans’ negative evaluation of higher education—one of the reasons commonly given by Republicans, but not Democrats, to explain their negative ratings of higher education in the 2018 Pew and 2024 and 2025 Gallup polls. Conservatives have complained about the existence of liberal bias on campus for some time, and this concern has been amplified by the second Trump administration, which has accused Columbia, Harvard, and other major universities of turning a blind eye to antisemitism.
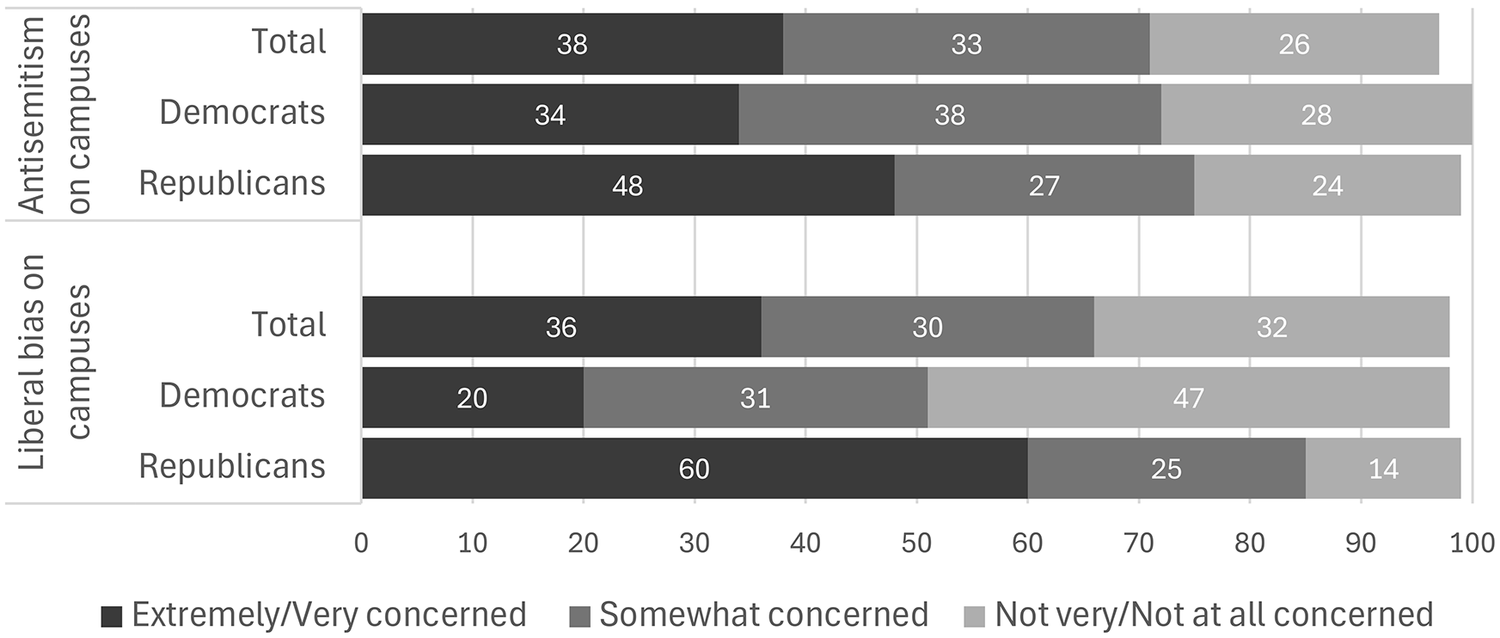
Most Americans express some concern about the existence of liberal bias in higher education when explicitly asked about it, although Republicans express far more concern than Democrats. Associated Press partnered with NORC to conduct a national poll on these issues in May 2025 (AP-NORC 2025). Roughly a third of Americans (36%) said that they were extremely or very concerned about liberal bias, another 33% said they were somewhat concerned, and 32% said they were not at all concerned, resulting in a total of 69% of Americans who expressed some concern. Levels of concern were much higher among Republicans than Democrats, however. Sixty percent of Republicans were highly concerned about liberal bias on campus compared with 20% of Democrats, resulting in a 40 percentage-point partisan difference (see figure 4).

Figure 4 Long description
The figure compares concern about liberal bias and antisemitism among Americans, Republicans, and Democrats. Roughly two-thirds of Americans express at least some concern about each issue. Republicans are substantially more likely than Democrats to be highly concerned about liberal bias, while partisan differences are smaller regarding antisemitism. The figure highlights a roughly 40-point partisan gap in concern about liberal bias.
Seventy-one percent of Americans were concerned about antisemitism on campus and roughly the same percentage were concerned about liberal bias, as seen in figure 4. But this masks the far greater degree of partisan polarization surrounding liberal bias. Fewer Republicans were extremely or very concerned about antisemitism (48%) than those with the same degree of concern about liberal bias (60%), while for Democrats the pattern was reversed (34% versus 20%) (see also appendix table A9).
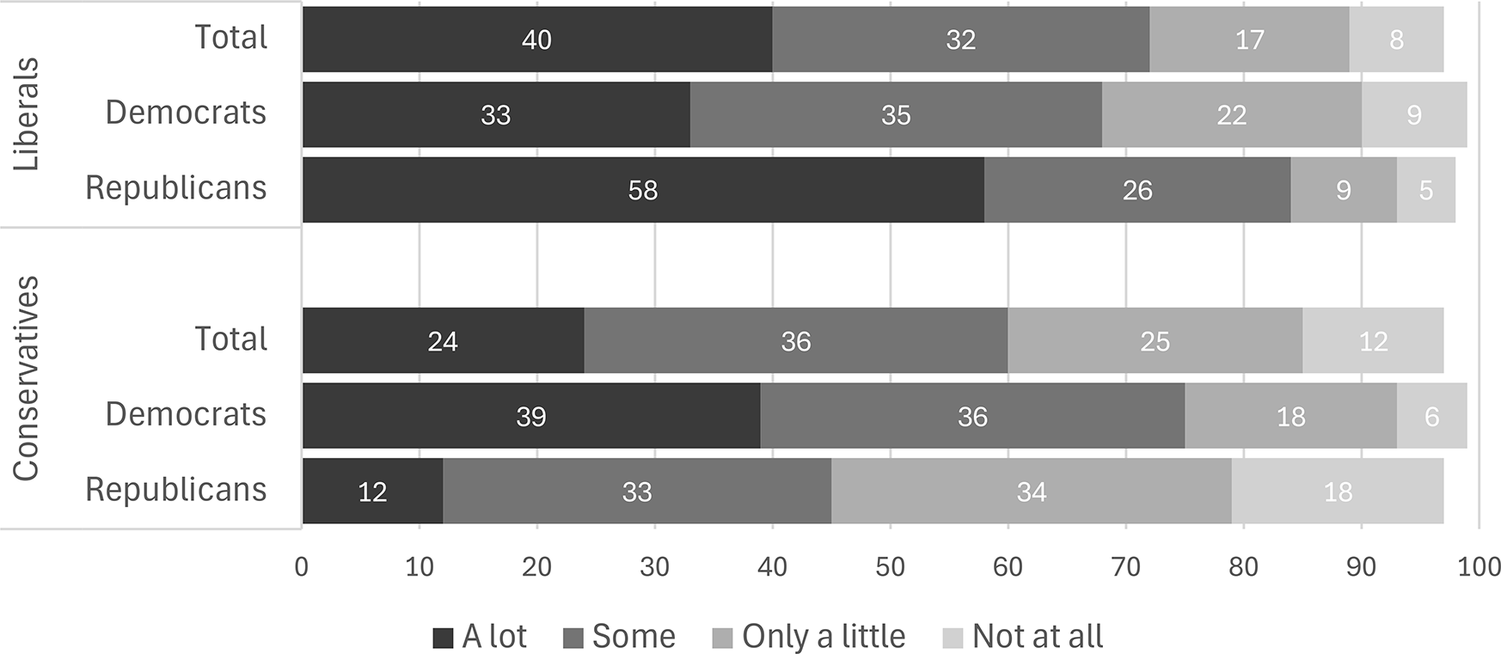
Most Americans said that there was a lot or some freedom of speech on college campuses for both liberals (72%) and conservatives (69%) but once again aggregate opinion masks widely divergent partisan views, especially on freedom of speech for conservatives. A far greater percentage of Republicans (52%) than Democrats (24%) thought conservatives experienced restrictions to their freedom of speech (i.e., they believed conservatives could speak freely only a little or not at all), whereas only 45% of Republicans but 75% of Democrats thought conservatives had a lot or some freedom of speech. Both Republicans and Democrats thought free speech was widely available for liberals (figure 5; see also appendix table A9).
Extent to Which Liberals and Conservatives Can Speak Freely on Campus (%)
Source: AP-NORC (2025).

Figure 5 Long description
Most respondents believe liberals have considerable freedom of speech on campus. Opinions diverge more sharply regarding conservatives. Republicans are much more likely than Democrats to say conservatives face restricted speech, while Democrats are more likely to believe conservatives enjoy substantial freedom of expression. The figure illustrates partisan disagreement over campus climate and speech.
In 2023, the AAU asked whether “America’s leading research universities have a strong liberal bias.” Most Americans (57%) thought the existence of liberal bias at research universities was true or believable, but this perception was far more common among Republicans (78%) than Democrats (39%) (see appendix table A10).Footnote 3 In the same poll, Americans were asked to rate the veracity and/or believability of the following statement: “America’s leading research universities’ focus on political issues distracts from their educational mission.” Findings parallel those for strong liberal bias. Seventy-three percent of Republicans thought this was true or at least believable compared with 38% of Democrats, generating a partisan gap of 35 percentage points (see appendix table A11).Footnote 4
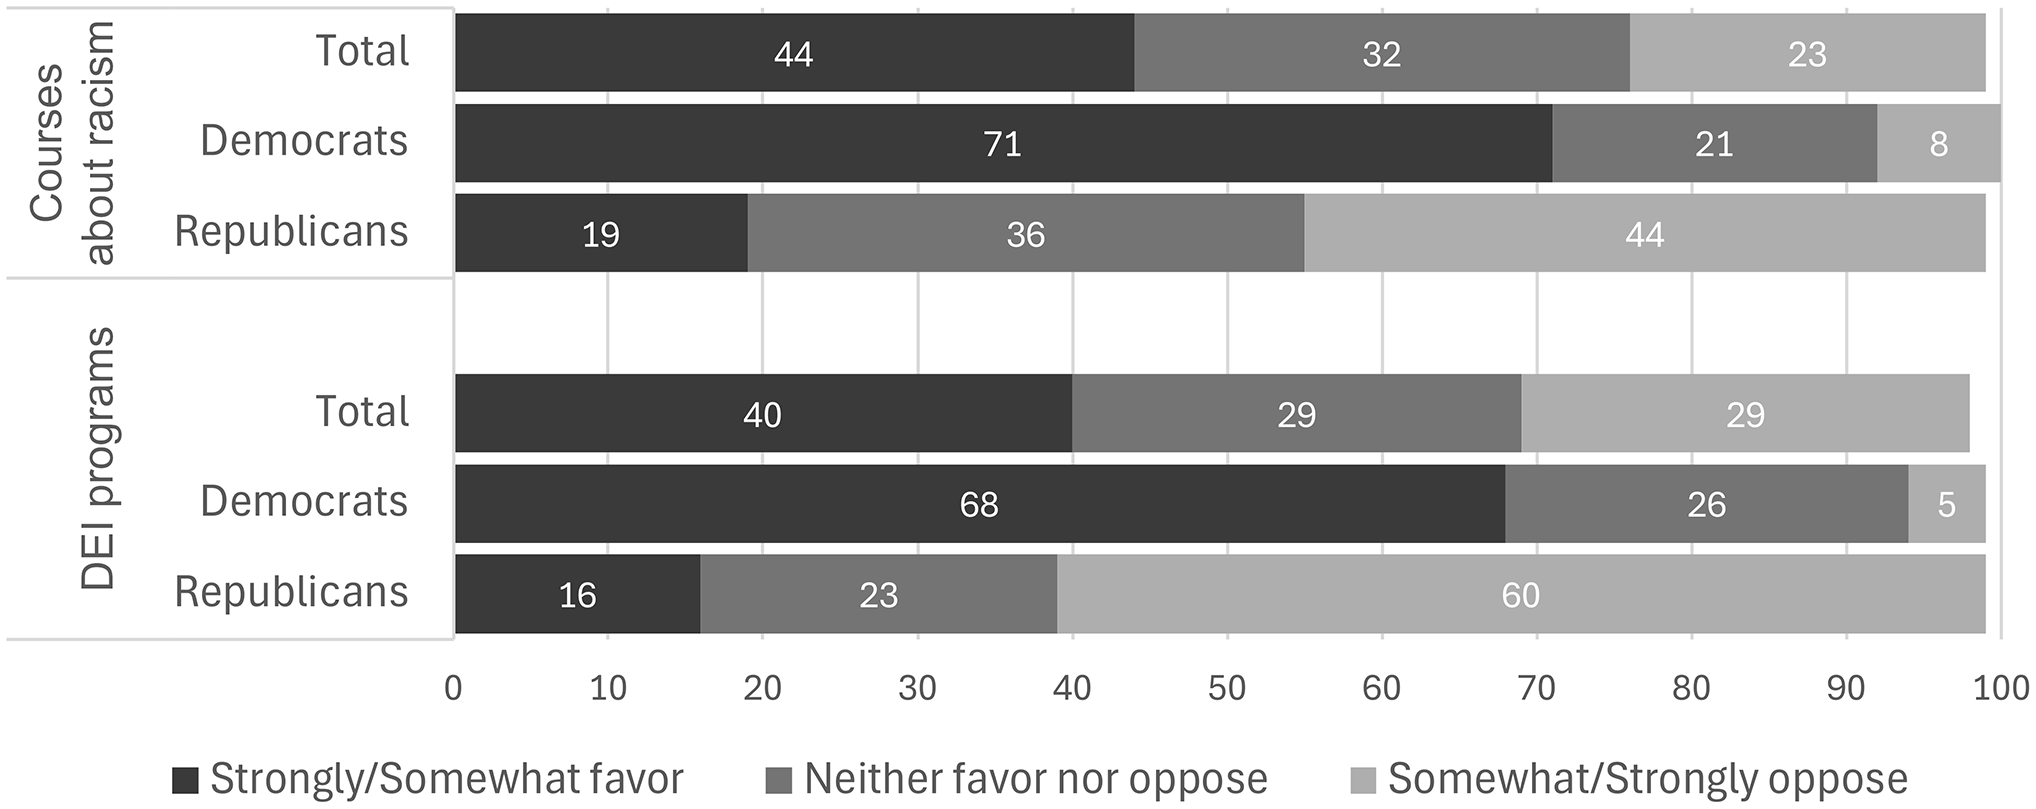
The AP-NORC poll also assessed Americans’ support for diversity-related activities on college and university campuses. Once again, public opinion is characterized by strongly polarized partisan views: 60% of Republicans opposed DEI programs whereas 68% of Democrats favored them, reflecting a 52% percentage-point gap in favorability, rivaling or exceeding the very large partisan differences observed earlier in general evaluations of higher education (figure 6; see also appendix table A9). There is a similarly large partisan gap in support for courses on racism at colleges and universities. Nineteen percent of Republicans favored and 44% opposed courses on racism compared with 68% of Democrats who favored and 5% who opposed, generating a partisan favorability gap of 49 percentage points.
Extent to Which Respondents Favor or Oppose Specific Courses or Programs (%)
Source: AP/NORC (2025).

Figure 6 Long description
The figure compares Democratic and Republican attitudes toward diversity, equity, and inclusion programs and courses on racism. Democrats are much more likely to support both initiatives, while Republicans are more likely to oppose them. Partisan gaps approach 50 percentage points, making these among the most polarized issues discussed in the paper.
In sum, Americans are starkly polarized along partisan lines over the perceived existence of political bias on campus, their levels of concern about it, its perceived ability to detract from higher education’s mission, and their support for programs and courses that focus on diversity and racial matters. These differences are large, ranging from 28 percentage points on the existence of free-speech restrictions for conservatives, to roughly 40 percentage points on the existence of political bias and Americans’ degree of concern about it, to a whopping 50 percentage points on support for DEI and race-related courses. These differences are not unexpected given the second Trump administration’s accusations of political bias within higher education, but it is worth reiterating the magnitude of these differences here, which rival those observed for overall evaluations. We cannot show that the Republican critique of bias within higher education is responsible for declining evaluations of the sector overall because questions about political bias have only been included in very recent polls.
Intermediate Stance of Political Independents
We have said little so far about political independents and their stance on political bias or overall evaluations of higher education. Their views fall somewhere between those of Democrats and Republicans, but tend to be closer to those of Republicans than Democrats. This may not be surprising given the salience of Republican rhetoric concerning problems in higher education. As an example, 48% of independents expressed a lot or quite a lot of confidence in higher education in 2015. This dropped to 35% in 2024 in the Gallup data, placing them slightly closer to Republicans than Democrats (see appendix table A2). A similar pattern is observed in the percentage who agreed that universities have a positive effect on the country in the New America data between 2020 and 2025 (see appendix table A6). It was more difficult to detect a clear pattern in their views on political bias. On some questions, such as concern about liberal bias on campus, they held views that were closer to those of Democrats (see appendix table A9). On other issues, such as support for DEI programs, their views were more similar to those of Republicans (see appendix table A9).
The Affordability and Accessibility of a College Degree
We turn next to present and discuss less expected findings, which show minimal change over time in Americans’ views concerning higher education’s specific aspects and products, and which exhibit modest partisan differences at the most.
As noted, Americans have expressed long-standing concerns about the cost of higher education. We begin by documenting this persistent concern, which is shared across partisan lines. The cost of attending public and private universities has skyrocketed over the last 25 years, driven by several factors: disinvestment from the sector by state and federal government, an increase in expenditures per student (on instruction, housing, and amenities), and an increase in regulatory demands (Cooper Reference Cooper2019). Americans are well aware of the increasing cost of a college degree and are far from sanguine about its high price tag.
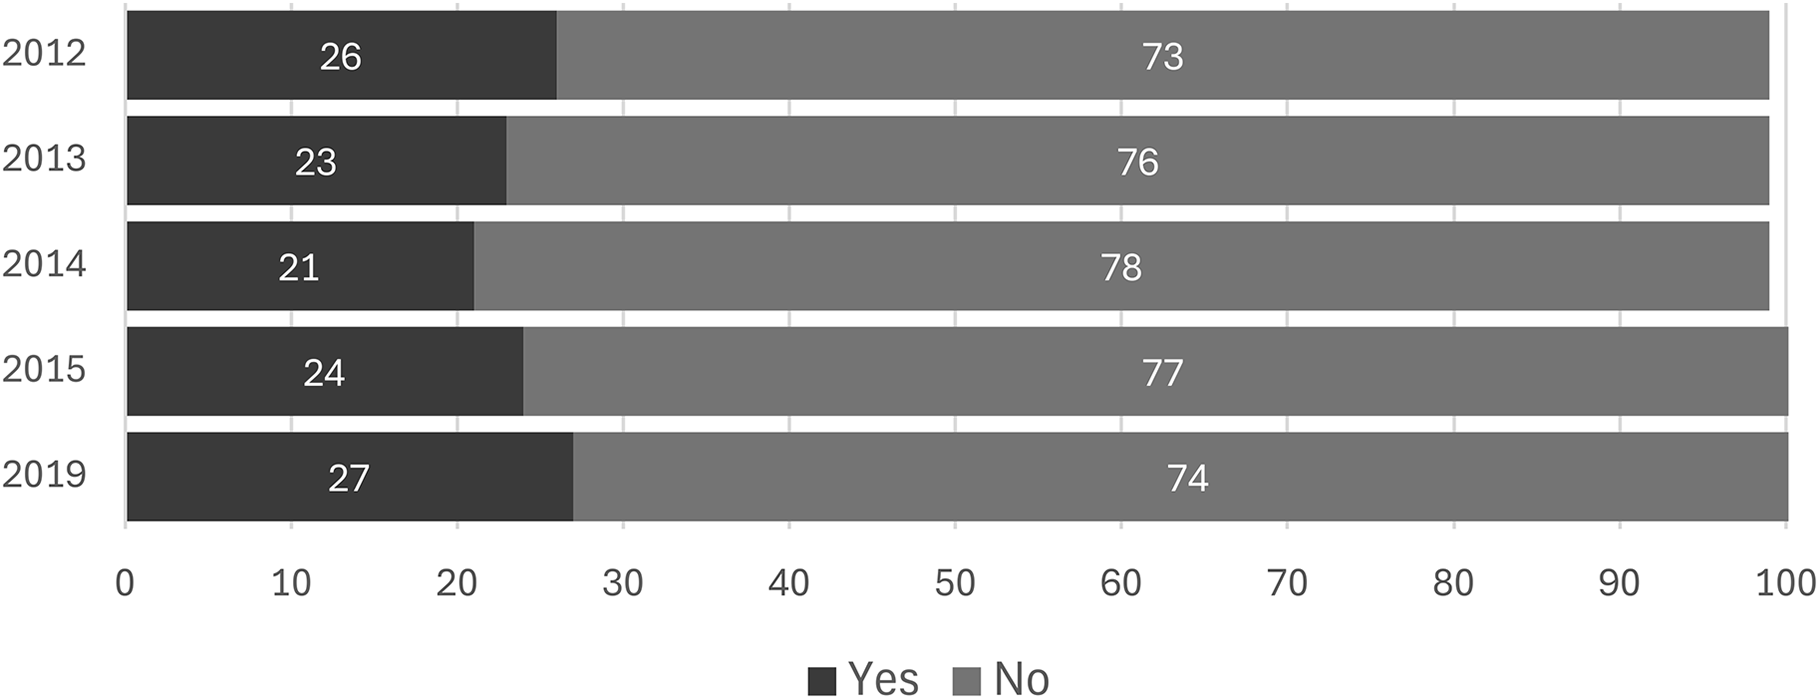
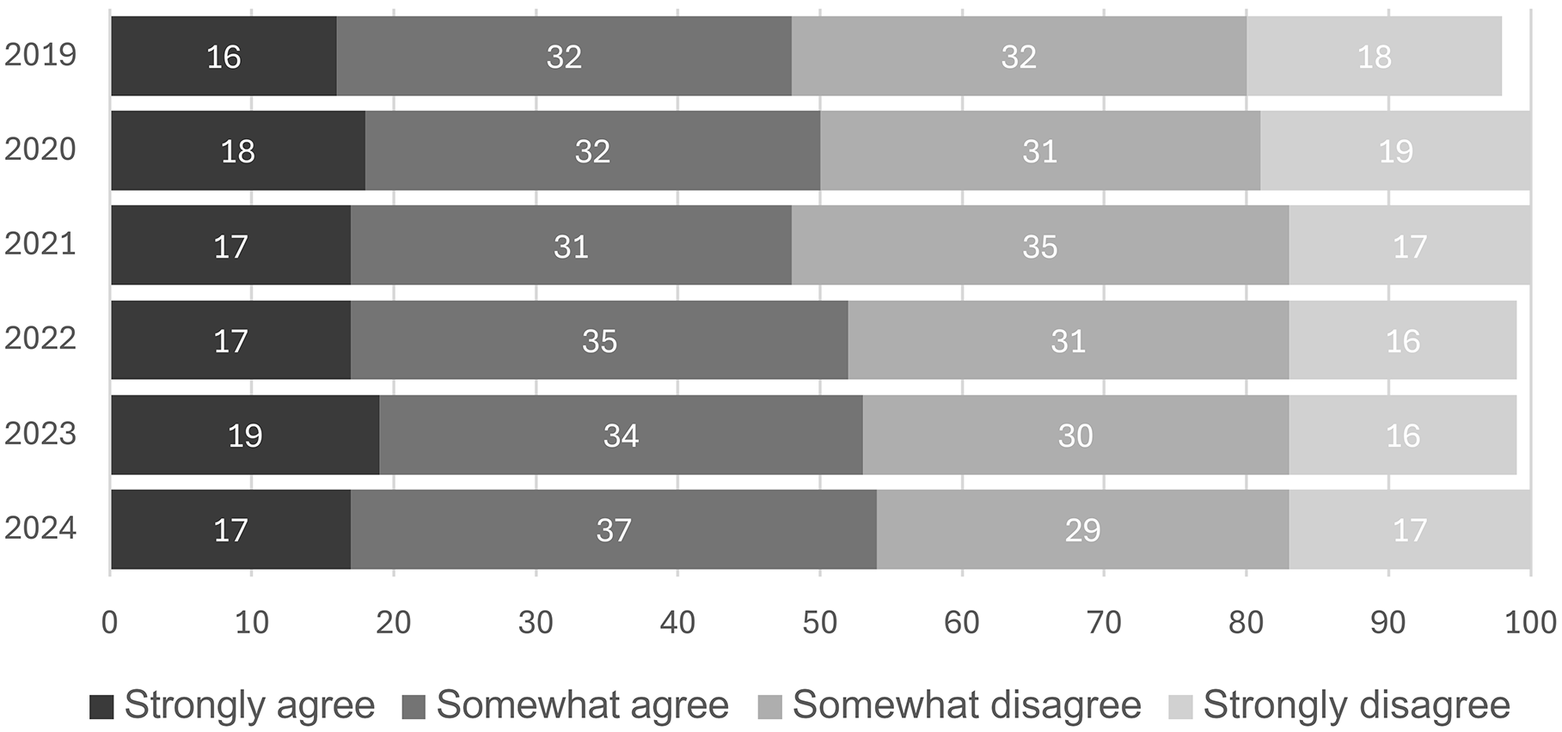
In polls conducted between 2012 and 2019, Gallup asked Americans if an education beyond high school is affordable to anyone who needs it; most Americans said it is not. As seen in figure 7, in 2012 almost three-quarters of Americans did not think an affordable higher education was accessible to everyone and a similar percentage chose the same option in 2019, indicating little change over time. Undoubtedly, a majority disagree with this question because it asks if higher education is available to anyone, and there will always be someone who cannot afford to attend college.
An Education beyond High School Is Affordable for Anyone in This Country Who Needs It (%)
Sources: Busteed and Marken (Reference Busteed and Marken2015); Lumina Foundation and Gallup (2013; 2014; 2016); Marken (Reference Marken2020).

Figure 7 Long description
The figure tracks responses to a Gallup question about whether education beyond high school is affordable to anyone who needs it. Across the period, roughly three-quarters of Americans say it is not affordable for everyone. The pattern remains relatively stable from 2012 through 2019, indicating persistent public concern about affordability.
New America data that track the perceived affordability of college exhibit a similar lack of change over time—although in a slightly later time period. New America posed the question somewhat differently, asking Americans to agree or disagree with the following statement: “Americans can get a high-quality education after high school that is also affordable.” A greater number strongly or somewhat agreed with this statement than with the Gallup statement, leaving Americans almost evenly divided on the issue of affordability (see figure 8). There is also no evidence of a partisan divide over affordability. If anything, Republicans hold slightly more positive views on affordability than Democrats (63% of Republicans versus 51% of Democrats in 2024; see appendix table A12). The partisan gap in the perceived affordability of a college degree is thus small and runs in the opposite direction to the gap in respondents’ overall assessment of higher education.
Americans Can Get an Affordable, High-Quality College Education (%)
Sources: Cheche, Nguyen, and Sawyer (Reference Cheche, Nguyen and Sawyer2025); Clark et al. (Reference Clark, Acosta, Nguyen and Fishman2019); Fishman et al. (Reference Fishman, Johnson, Nguyen and Romo-González2021); Fishman, Nguyen, and Cheche (Reference Fishman, Nguyen and Cheche2023); Fishman, Nguyen, and Woodhouse (Reference Fishman, Nguyen and Woodhouse2022); Francisco, Fishman, and Nguyen (Reference Francisco, Fishman and Nguyen2020); Nguyen, Fishman, and Cheche (Reference Nguyen, Fishman and Cheche2024).

Figure 8 Long description
The figure presents New America survey results from 2019–2025. Americans are more evenly divided than in Figure 7, with substantial shares agreeing and disagreeing that affordable, high-quality postsecondary education is available. Trends change little over time. The figure also reflects minimal partisan differences in perceived affordability.
The Perceived Value of a College Degree
Good Investment
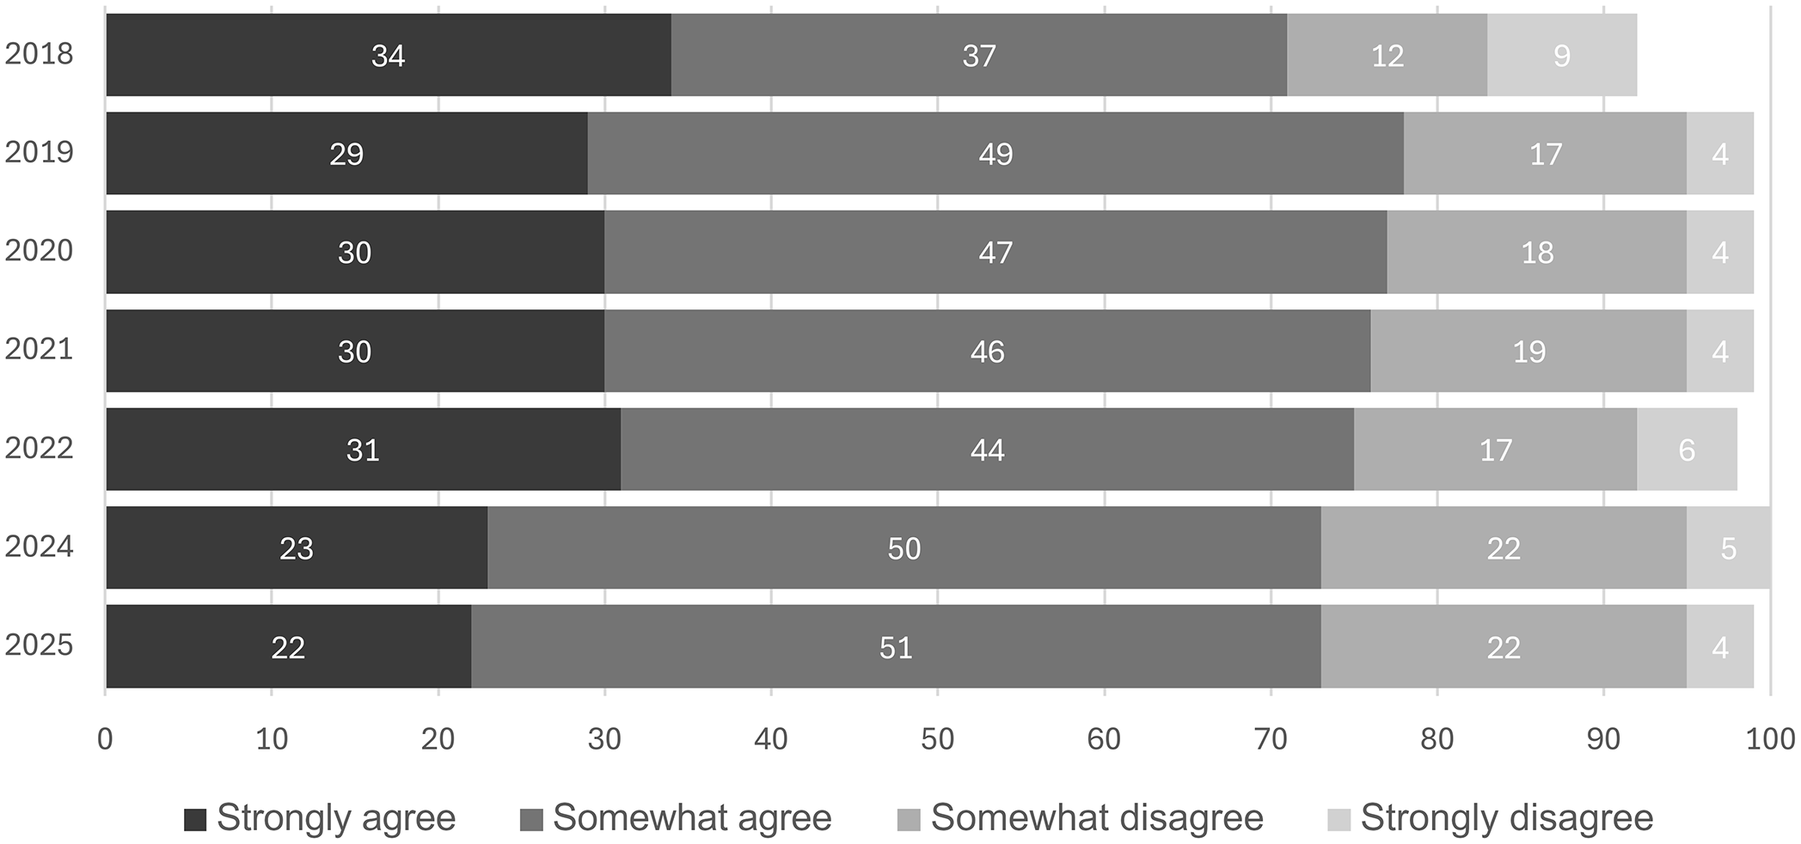
Broad concerns about the cost of a college education raise additional questions about its perceived value. Negative ratings of higher education and concerns about its cost do not necessarily mean that a degree has lost its perceived value. Since 2018, New America has asked Americans whether education beyond high school offers a good return on investment for the student. As seen in figure 9, Americans broadly agree that a higher degree is worth the expense—a view that has changed little over time, although the percentage who strongly agree with the statement was slightly lower in 2024 and 2025 than in earlier years. In 2018, 71% of Americans somewhat or strongly agreed that education beyond high school was a good investment (34% strongly agreed) and 73% felt the same way in 2025 (22% strongly agreed).
Education beyond High School Offers a Good Return on Investment (%)
Sources: Cheche, Nguyen, and Sawyer (Reference Cheche, Nguyen and Sawyer2025); Clark et al. (Reference Clark, Acosta, Nguyen and Fishman2019); Fishman et al. (Reference Fishman, Johnson, Nguyen and Romo-González2021); Fishman, Nguyen, and Cheche (Reference Fishman, Nguyen and Cheche2023); Fishman, Nguyen, and Woodhouse (Reference Fishman, Nguyen and Woodhouse2022); Francisco, Fishman, and Nguyen (Reference Francisco, Fishman and Nguyen2020); Nguyen, Ezeugo, and Fishman (Reference Nguyen, Ezeugo and Fishman2018); Nguyen, Fishman, and Cheche (Reference Nguyen, Fishman and Cheche2024).

Figure 9 Long description
The figure tracks agreement that education beyond high school offers a good return on investment. Overall agreement remains around seven in ten Americans from 2018–2025. Strong agreement declines somewhat over time, but total agreement remains stable. The figure demonstrates continuing confidence in the value of a college education despite concerns about cost.
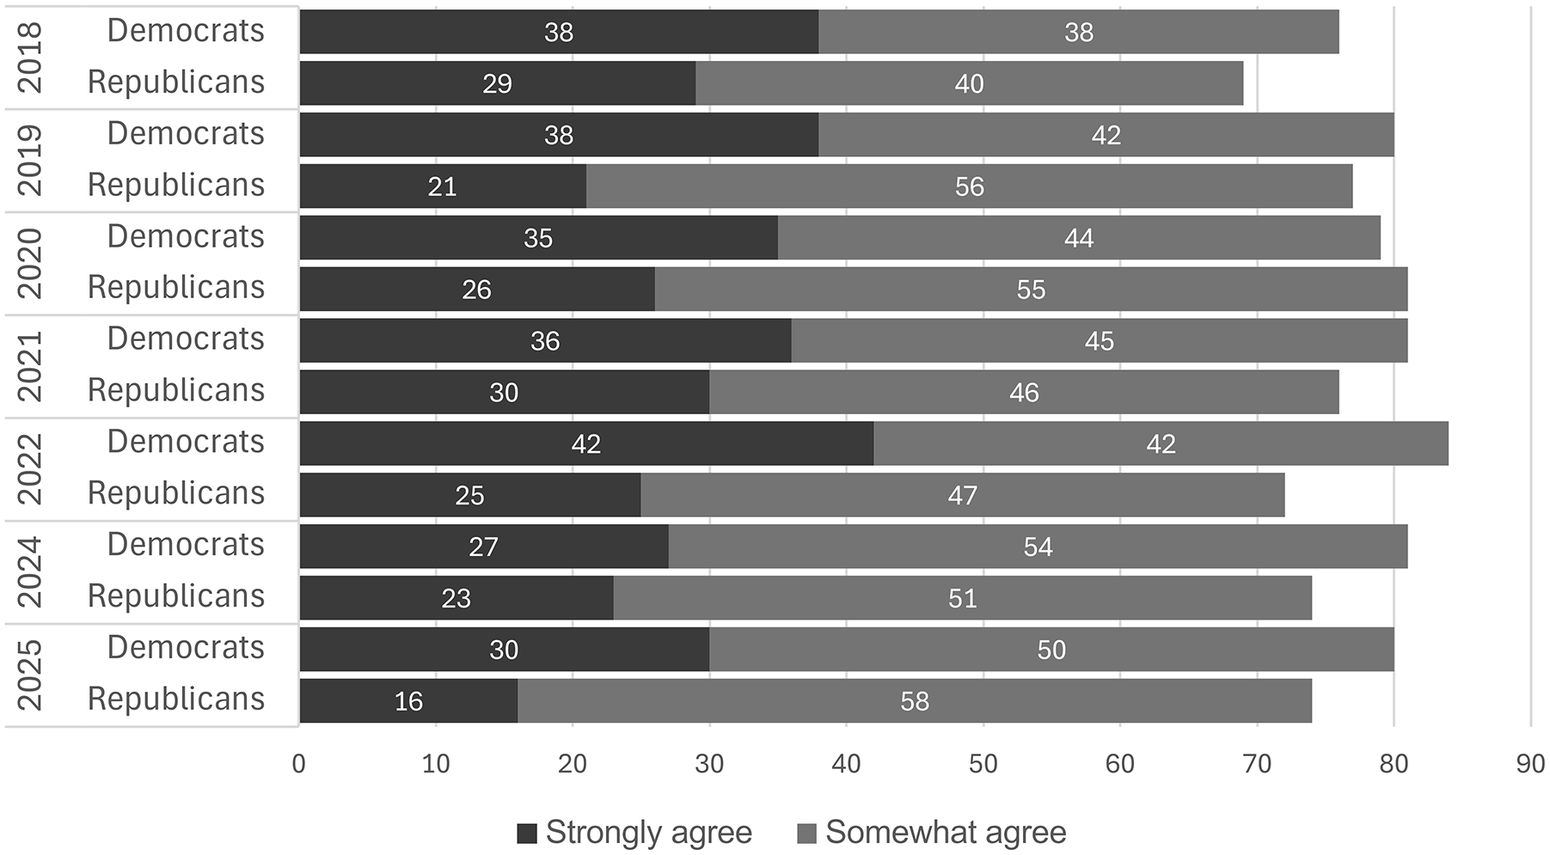
There is modest partisan disagreement concerning the value of a college degree in these data. Typically, somewhere between two-thirds and three-quarters of Republicans, Democrats, and pure independents somewhat or strongly agree that higher education is a good investment, as seen in figure 10 (see also appendix table A13). A greater percentage of Democrats than Republicans (30% versus 16% in 2025) strongly agree that higher education is a good investment, but very few Americans disagree. There is a slight decline over time in the number of Americans who strongly agree that college is a good investment (34% in 2018 and 22% in 2025) but no obvious trend in overall agreement, indicating surprisingly broad partisan agreement about the value of a higher degree. The rated value of a college degree also varies modestly among those with and without one. In 2025, 79% of those with a bachelor’s degree agreed that it was a good investment compared with 72% without a degree, although college graduates were more likely to strongly agree with this statement than others (29% versus 18%) (see appendix table A14).
Agreement that Education beyond High School Offers a Good Return on Investment (%)
Sources: Cheche, Nguyen, and Sawyer (Reference Cheche, Nguyen and Sawyer2025); Clark et al. (Reference Clark, Acosta, Nguyen and Fishman2019); Fishman et al. (Reference Fishman, Johnson, Nguyen and Romo-González2021); Fishman, Nguyen, and Cheche (Reference Fishman, Nguyen and Cheche2023); Fishman, Nguyen, and Woodhouse (Reference Fishman, Nguyen and Woodhouse2022); Francisco, Fishman, and Nguyen (Reference Francisco, Fishman and Nguyen2020); Nguyen, Ezeugo, and Fishman (Reference Nguyen, Ezeugo and Fishman2018); Nguyen, Fishman, and Cheche (Reference Nguyen, Fishman and Cheche2024).

Figure 10 Long description
The figure shows that majorities of Democrats and Republicans agree that higher education is a worthwhile investment. Democrats are somewhat more likely to strongly agree, but overall agreement remains high across partisan groups. The figure highlights modest partisan differences compared with the much larger partisan gaps observed in overall evaluations of higher education.
There has been some discussion about growing disenchantment with higher education among younger generations in tandem with evidence that the financial advantage of a college degree for young men (25–34) has decreased over the last several decades (Fry, Braga, and Parker Reference Fry, Braga and Parker2024). There is little evidence in the New America data, however, of any marked generational decline in the perceived value of a degree over the past six years (see appendix table A15). The oldest generation in the New America data—the Silent Generation (born between 1927 and 1945)—endorsed the value of a higher degree most strongly, but members of the youngest generation—Generation Z (1997–2006)—also viewed it as valuable. In 2025, 14% of the youngest generation strongly agreed that it was a good investment and 54% somewhat agreed. This is consistent with evidence from a 2023 Gallup poll in which over 80% of the members of Generation Z, defined by slightly different birth years (1998–2011), rated a college degree as fairly or very important (Nicola Reference Nicola2023). There is no evidence in polling data that young Americans’ interest in obtaining a college degree has declined.
There is also no difference between younger men and women in the perceived value of a college degree. Roughly two-thirds or more of young women and men (aged 18–24) agreed that a college degree was a good investment in each year of the New America survey, although the percentage indicating agreement was slightly lower in 2025 than in earlier years (see appendix table A16).
Value versus Cost
Other polls indicate greater skepticism among Americans about the value of a college degree when both the value of a degree and its cost are specifically referred to in the survey question or pitted directly against each other. In a 2023 Pew poll, very few Americans (22%) believed it was worth getting a four-year college degree if someone had to take out loans, but numbers increased dramatically if no loans were involved. In the same Pew poll, a majority of Democrats and Republicans thought it was worth getting a degree with or without loans, although agreement was stronger among Democrats (82% of Democrats versus 60% of Republicans) (Fry, Braga, and Parker Reference Fry, Braga and Parker2024). Even among those with a college degree, a plurality said the cost did not warrant loans (49%).
Similar findings emerge from other polls showing that Americans are less sanguine about the value of a higher degree if they can indicate its value when weighted against costs. In 2024, the AAU asked Americans if a college degree from a research institution is valuable and worth the cost, valuable but not worth the cost, or not valuable. Very few Americans said it is not valuable (5%). But they were more likely to say that it is valuable but not worth the cost (59%) than say it is valuable and worth the cost (30%)—a finding that is in line with data from the Pew survey. Once again, Democrats (40%) were somewhat more likely than Republicans (20%) to say that a degree from a research institution is valuable and worth the cost. In sum, the high cost of college tuition remains a concern for many Americans, but this concern exists across partisan lines and was likely a concern before Donald Trump entered politics.Footnote 5
The Value of a Degree from Different Types of Institutions
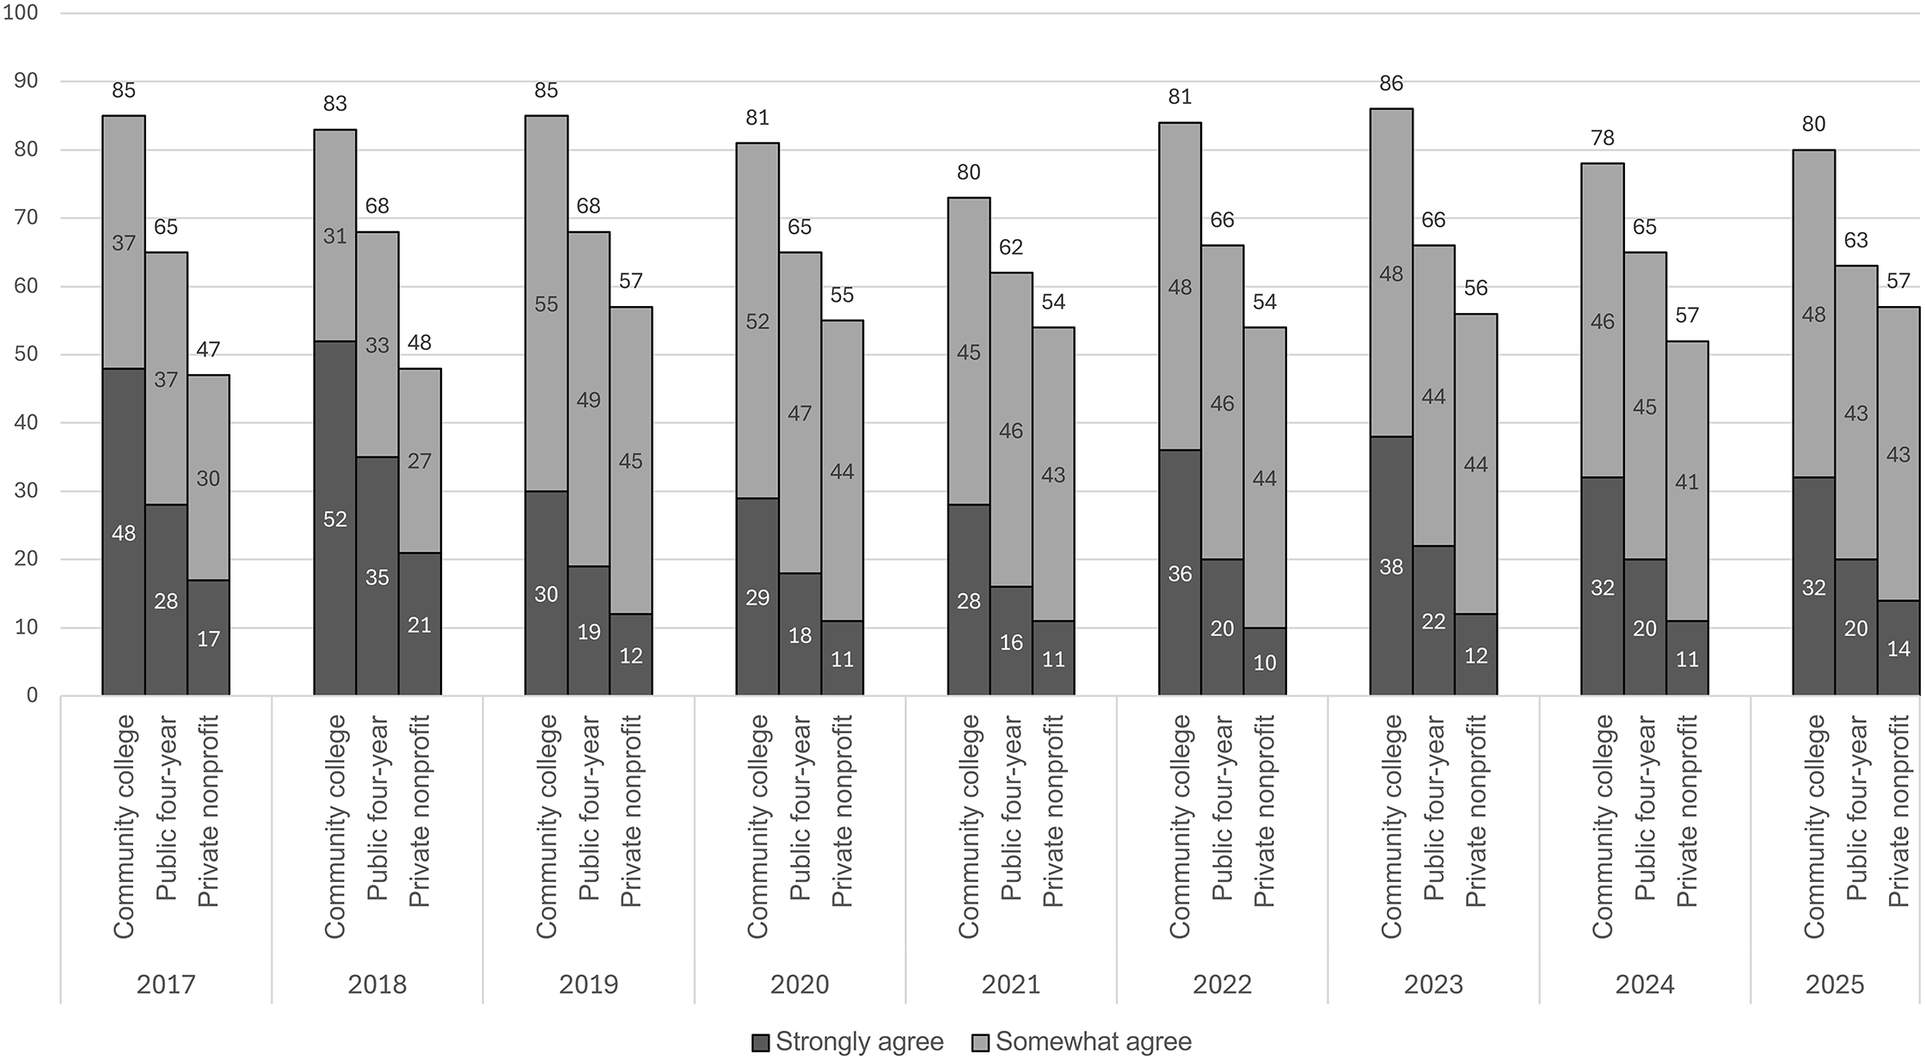
Americans’ views on the value of a college degree also vary with the type of higher education institution from which the degree is obtained (and presumably the institution’s tuition rates). Since 2017, New America has regularly asked Americans to agree or disagree with a series of statements that question if public community colleges, public four-year colleges or universities, and private nonprofit colleges and universities are worth the cost. Over 50% of Americans agree that a degree from any one of these institutions is valuable. But there are differences in their perceived value; Americans rate community colleges as better value than private nonprofit colleges and universities (see figure 11).
Agreement that the Institution Is Worth the Cost (%)
Sources: Clark et al. (Reference Clark, Acosta, Nguyen and Fishman2019); Fishman, Ekowo, and Ezeugo (Reference Fishman, Ekowo and Ezeugo2017); Fishman et al. (Reference Fishman, Johnson, Nguyen and Romo-González2021); Fishman, Nguyen, and Cheche (Reference Fishman, Nguyen and Cheche2023); Fishman, Nguyen, and Woodhouse (Reference Fishman, Nguyen and Woodhouse2022); Francisco, Fishman, and Nguyen (Reference Francisco, Fishman and Nguyen2020); Nguyen, Ezeugo, and Fishman (Reference Nguyen, Ezeugo and Fishman2018); Nguyen, Fishman, and Cheche (Reference Nguyen, Fishman and Cheche2024).

Figure 11 Long description
The figure displays ratings of whether degrees from different institution types are worth their cost. Community colleges receive the most favorable assessments, followed by public four-year institutions and then private nonprofit colleges and universities. Majorities view all three institution types positively, and trends remain relatively stable over time.
There is muted partisan disagreement over the value of a degree from different institutions, however. In 2025, Democrats were slightly more likely than Republicans to see both community colleges (87% of Democrats versus 77% of Republicans) and public four-year institutions (75% of Democrats versus 58% of Republicans) as worth the cost. And there were more Democrats (30%) than Republicans (12%) who strongly agreed that a degree from a public four-year institution was worth it. Nonetheless, most Republicans rated community colleges (77%), public four-year colleges and universities (58%), and private nonprofit institutions (58%) as worth the cost in 2025, and this level of overall agreement changed very little between 2019 and 2025 (see appendix table A17).
Workforce Preparedness and Employment
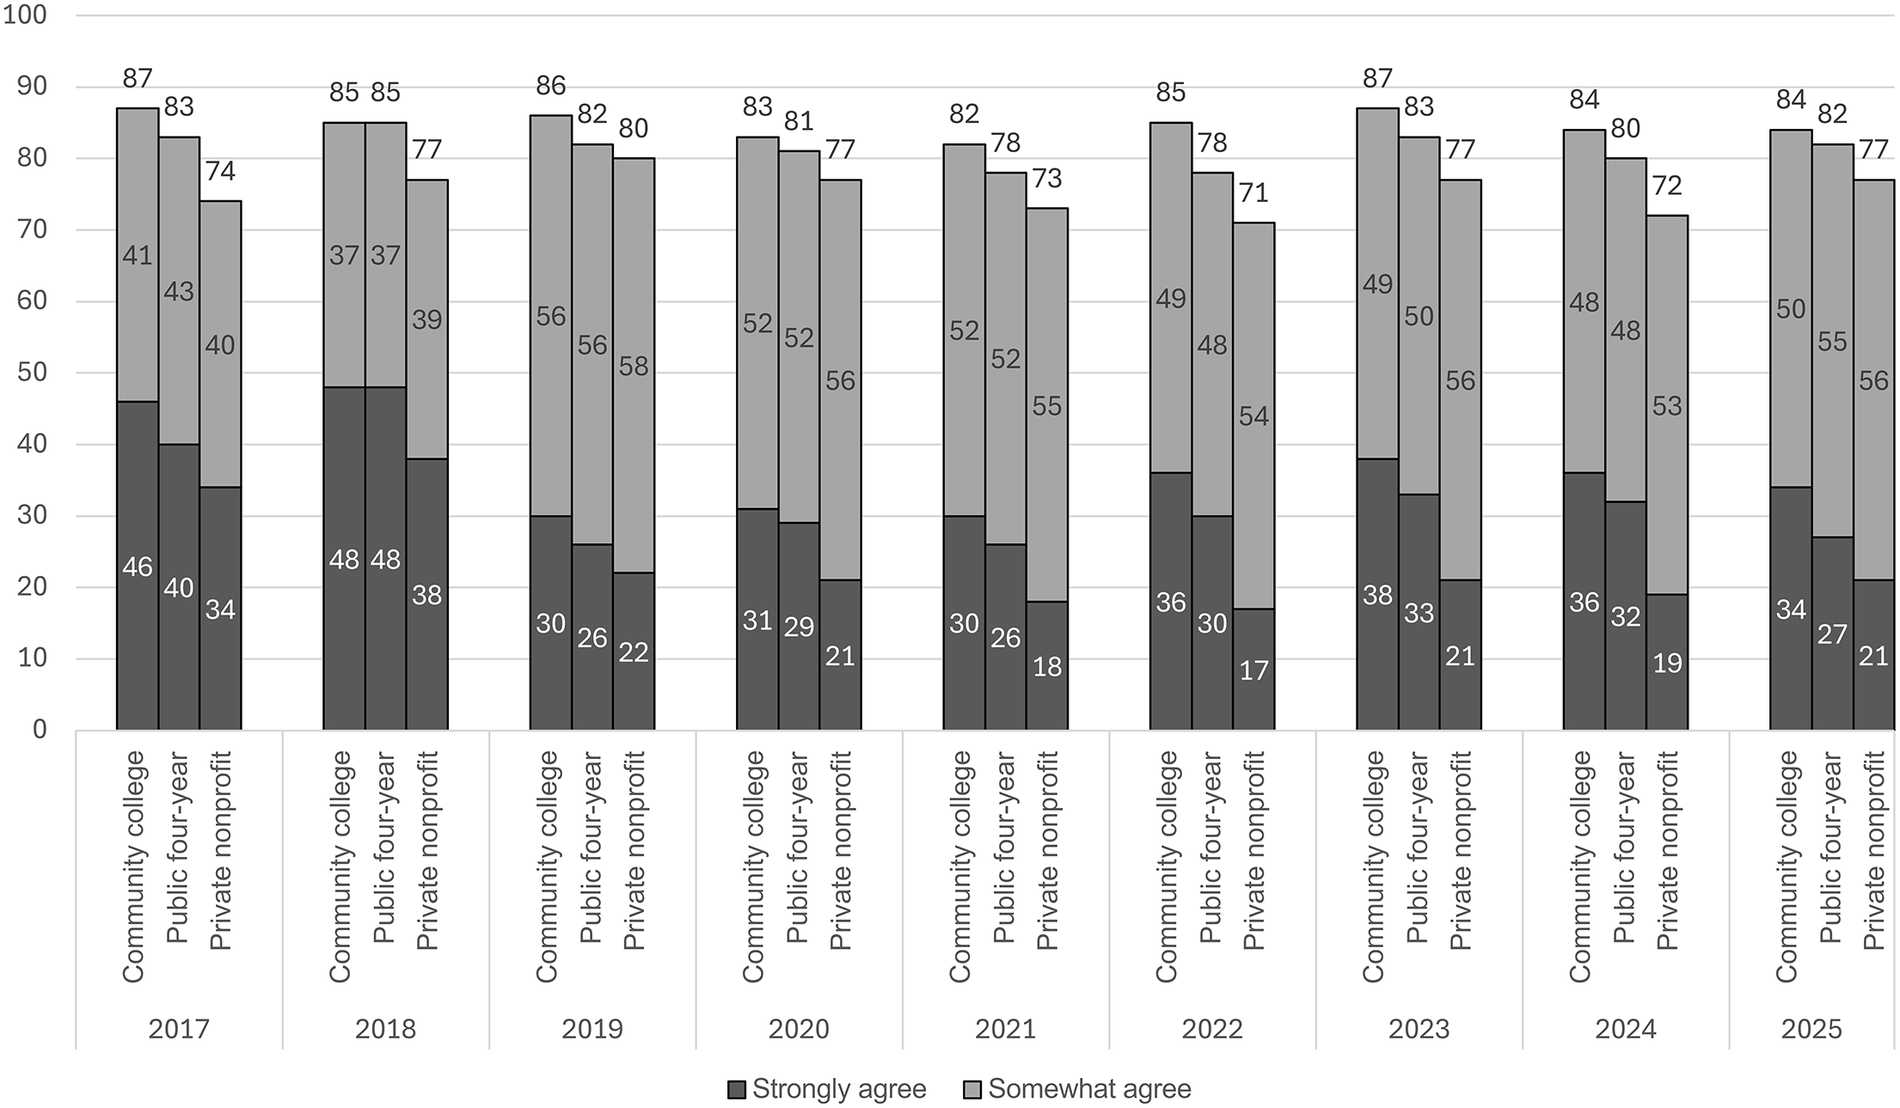
In addition to concerns about tuition costs, Americans worry about whether colleges and universities teach the wrong content to students and fail to prepare them for the workforce. New America has asked Americans to indicate how strongly they agree or disagree that community colleges, public four-year colleges and universities, and private nonprofit college and universities contribute to a strong American workforce. Once again, all three types of institutions are rated positively. In 2025, 84% of Americans agreed that community colleges contribute to a strong workforce, 82% agreed to the same statement when applied to public four-year institutions, and 77% agreed in relation to private institutions (see figure 12). Community colleges are thus seen as making a slightly stronger contribution to the workforce than other types of institutions. There has been a slight softening of agreement with this statement over time for all types of institutions. In 2017, 46% of Americans strongly agreed that community colleges contribute to a strong workforce. By 2025 that had dropped to 34%. Similar declines in strong agreement are seen for public four-year and private institutions.
Agreement that Higher Education Institutions Contribute to a Strong American Workforce (%)
Sources: Cheche, Nguyen, and Sawyer (Reference Cheche, Nguyen and Sawyer2025); Clark et al. (Reference Clark, Acosta, Nguyen and Fishman2019); Fishman et al. (Reference Fishman, Johnson, Nguyen and Romo-González2021); Fishman, Ekowo, and Ezeugo (Reference Fishman, Ekowo and Ezeugo2017); Fishman, Nguyen, and Cheche (Reference Fishman, Nguyen and Cheche2023); Fishman, Nguyen, and Woodhouse (Reference Fishman, Nguyen and Woodhouse2022); Francisco, Fishman, and Nguyen (Reference Francisco, Fishman and Nguyen2020); Nguyen, Ezeugo, and Fishman (Reference Nguyen, Ezeugo and Fishman2018); Nguyen, Fishman, and Cheche (Reference Nguyen, Fishman and Cheche2024).

Figure 12 Long description
The figure compares perceptions of workforce contributions from community colleges, public four-year institutions, and private nonprofit institutions. Large majorities believe all three strengthen the workforce. Community colleges receive the highest ratings. Strong agreement declines somewhat over time, but overall positive assessments remain high.
There is also only a modest partisan difference in the view that a degree from all three types of institutions contributes to a strong workforce (see appendix table A18). In almost all years and for all types of institutions, approximately 70% to 90% of Republicans and Democrats agreed. Once again, Democrats are slightly more supportive than Republicans of each higher education institution and agree more strongly that each one strengthens the workforce. For example, in 2025, 89% of Democrats agreed that community colleges strengthen the workforce compared with 81% of Republicans; 90% of Democrats and 76% of Republicans agreed that public four-year colleges do the same. In 2025, Democrats were also more likely than Republicans (50% versus 23%) to strongly agree that community colleges strengthen the workforce; they were also more likely to strongly agree with the benefits to the workforce of public four-year institutions (41% versus 16%). In other words, broad agreement on the workforce benefits of higher education masks slightly stronger Democratic support and intensity of support.
Some polling organizations have taken a different approach to gauging the employment-related value of higher education. In 2023, Pew asked Americans how important it is for someone to have a four-year degree to get a well-paying job. Sixty percent of Americans said it is extremely, very, or somewhat important, although this masks partisan differences. Consistent with modest partisan differences in the New America data, more Democrats (70%) than Republicans (50%) said a four-year degree is important (Fry, Braga, and Parker Reference Fry, Braga and Parker2024). In the same 2023 survey, Pew asked Americans how useful their education had been in giving them the skills and knowledge to get a well-paying job. College graduates were more likely than those without a degree to rate their education as extremely or very useful (58% of graduates versus 25% of nongraduates), and less likely to say it had not been useful (17% of graduates versus 38% of nongraduates).
On balance, a college degree is seen as useful to American workers and as strengthening the workforce, although Democrats rate a college degree as somewhat more valuable than Republicans. Partisan gaps in the perceived value of a higher degree are far more muted, however, than the gap seen in general evaluations of higher education and concerns about political bias. Partisan gaps of roughly 10–20 percentage points on the perceived value or costs of higher education are far smaller than the gaps of 35% to 45% observed in overall ratings of higher education.
Interest in Obtaining a Higher Degree
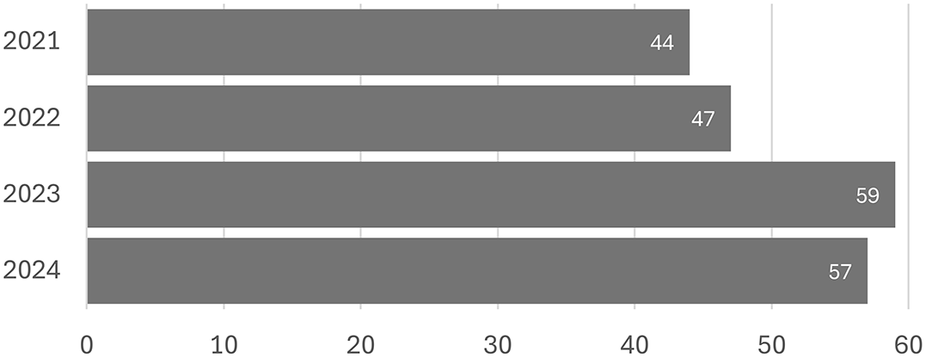
Another way to assess the employment value of a college degree is to measure interest in obtaining a degree among those who lack one. Gallup has surveyed US adults (aged 18–59) who do not have a college degree or another higher education credential over the last several years (2021–24) and asked about their interest in pursuing further education. Figure 13 shows a marked increase over time in interest in enrolling in a degree or credential program. In 2024, 57% of Americans who lacked a college degree and were not currently enrolled had thought about enrolling in a higher education program in the last two years. In 2024, this percentage was higher among younger than older Americans: 63% among those aged 35 or younger had thought about enrolling compared with 52% among those aged 36 or older (see appendix table A19).
Respondents Considering Pursuing a Post–High School Degree or Credential in the Last Two Years (No College Degree) (%)
Sources: Lumina Foundation and Gallup (2022; 2023; 2024); Ray (Reference Ray2024).

Figure 13 Long description
The figure tracks the percentage of adults without a college degree who have considered enrolling in a degree or credential program. Interest rises steadily from 2021 through 2024, reaching 57% in 2024. The figure indicates continued demand for higher education credentials.
In sum, partisan polarization surrounding higher education has not dampened enthusiasm for a college degree or degraded its value. A college degree continues to be seen as valuable, even if it is viewed as overly expensive. A majority of those without an education beyond high school are eager to obtain additional credentials, and college graduates rate their degree as very useful in the workforce. There are modest partisan differences in these assessments and perceptions but such differences are more muted and less negative than the levels of dissatisfaction, lack of confidence, and concerns about political bias observed among Republicans in recent years. It appears that the major product of higher education—the college degree—has not lost its luster.
Medical and Scientific Research
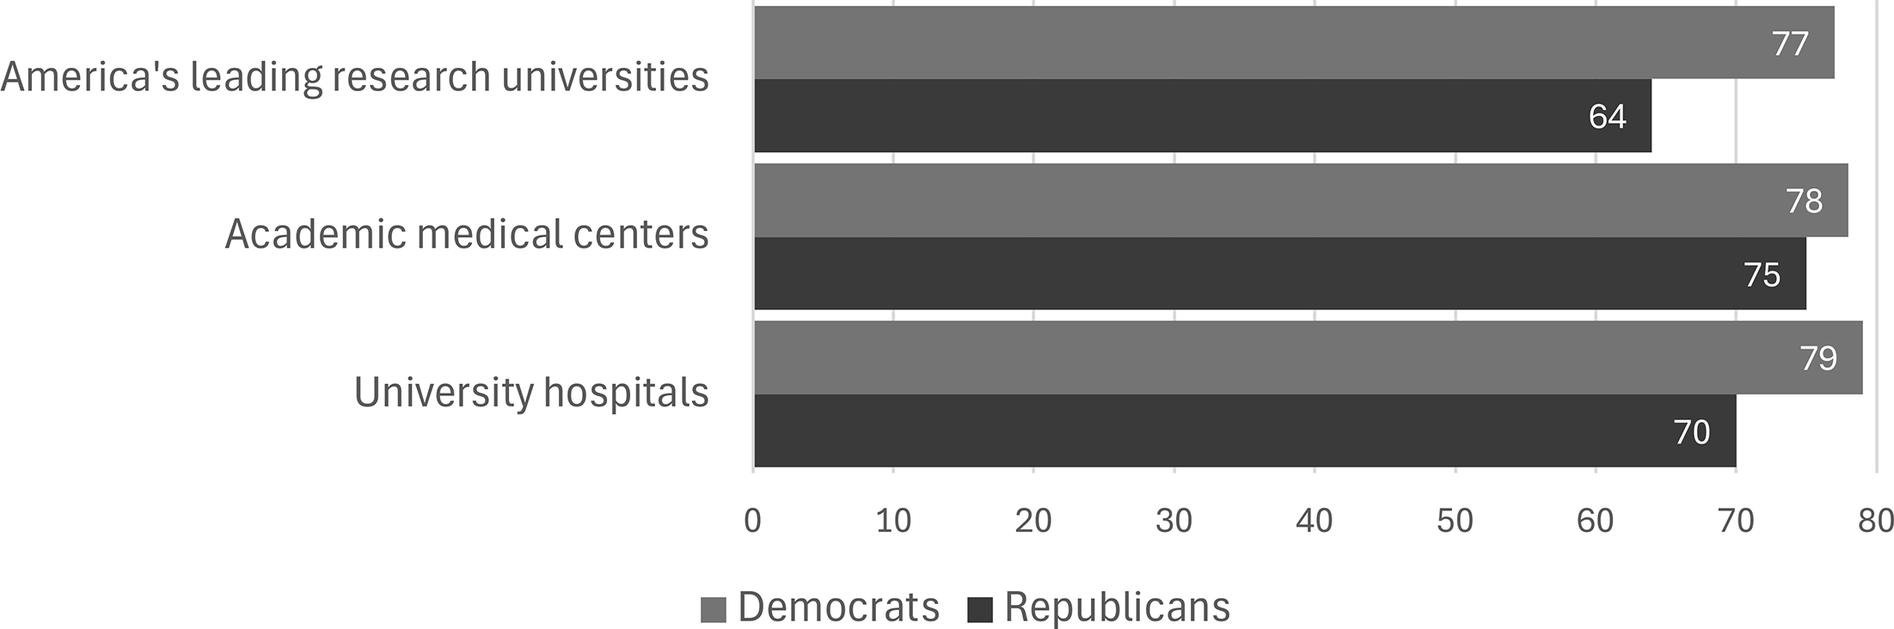
Higher education institutions do more than produce college graduates; some are also actively engaged in research and the generation of new medical, scientific, social science, and humanistic findings. This aspect of higher education may be less publicly visible than the production of college graduates, and it is important to gauge the degree to which Americans support university-based research activities. For the last several years, the AAU has asked Americans whether leading research universities, academic medical centers, and university hospitals make the country better or worse off. There is broad agreement that they benefit the country, and this assessment has changed little over the last three years (see appendix table A20). In 2023, 2024, and 2025, 65% or more of Americans agreed that each institution makes the country better off. Moreover, there are few partisan differences in this assessment—as seen in figure 14, which depicts data from 2025. Both Democrats and Republicans rate research universities, academic medical centers, and university hospitals as beneficial; there is no partisan gap in this assessment, with Republicans demonstrating especially strong support for university hospitals and academic medical centers.Footnote 6
Respondents Saying that the Institution Makes the Country Better Off (%)
Source: AAU (2025).

Figure 14 Long description
The figure compares Democratic and Republican evaluations of research universities, academic medical centers, and university hospitals. Majorities in both parties believe these institutions make the country better off. Partisan differences are small, especially relative to those seen for political bias and overall evaluations of higher education. The figure demonstrates broad support for university-based research and medical activities.
Associated Press asked Americans in May 2025 whether colleges and universities made more of a positive or negative contribution to medical and scientific research. Sixty-four percent of Americans said the contribution was positive, 26% said it was neither positive nor negative, and only 9% said it was negative. This confirms the high esteem in which Americans hold the medical and scientific research conducted at research universities. When pushed further in the same Associated Press poll and asked if they favor or oppose maintaining federal funding for scientific and medical research at colleges and universities, 62% of Americans supported continued funding. Republicans were somewhat less likely than Democrats (57% versus 75%) to favor continued federal funding for scientific and medical research, but they were supportive overall (see appendix table A21).
The AAU also asked Americans in March 2025 about the Trump administration’s cuts to medical research. A minority (38%) of Americans had heard about the cuts to medical research grants, many fewer than had heard about the cost-cutting efforts of the Department of Government Efficiency (DOGE) (68%) or efforts to eliminate the Department of Education (65%). When asked to choose actions being taken by the Trump administration to which they were strongly opposed, cutting medical research grants was near the top of the list and mentioned by 42% of Americans. There were marked partisan differences, however, in this opposition. A far greater percentage of Democrats than Republicans picked cuts to medical research grants to universities as something to which they were strongly opposed (69% versus 24%). This partisan gap was not evident on questions about the value of university-based medical and scientific research and only emerged once the Trump administration was named specifically, suggesting that such actions need to be linked explicitly to the administration to dampen Republican opposition.Footnote 7
Political Independents
There are far weaker and less pronounced partisan differences on questions of the affordability and value of a college degree and its contributions to the workforce, which makes it difficult to arrive at a firm conclusion about the stance of political independents. Like their stance on political bias in higher education, they typically hold positions that are intermediate between Democrats and Republicans. On some questions, such as whether a college degree is a good return on investment, they are closer to Republicans, but hold positions that are intermediate between that of Democrats and Republicans on the question of whether degrees contribute to a strong workforce.
Conclusion
We noted at the outset a glaring paradox in public views of higher education: declining confidence in the sector coupled with continued demand for college degrees. Our review of the public opinion literature on higher education brings that paradox into sharp relief. Most Americans without a college degree are interested in obtaining a higher degree or credential. College graduates rate their degree as especially useful in helping them to gain a well-paying job. Younger generations regard obtaining a college degree as important. There is little evidence here that a college education has been devalued or is seen as irrelevant to success in the workplace.
At the same time, we document a sharp decline over the last 10 years in Republican confidence in and support for higher education. This is accompanied by a pervasive Republican concern about liberal political bias and restricted freedom of speech for conservatives on college campuses. Republicans are dissatisfied with high college tuition fees, but so too are Democrats, making this an unlikely explanation for Republicans’ increasingly negative evaluations of higher education. Democrats express some concern about liberal bias on university and college campuses, but that has not dampened their enthusiasm for higher education. Republicans express greater concern about political bias on campus and their negativity is on a par with their overall negative evaluation of the higher education sector.
We cannot show that growing Republican disenchantment with higher education is caused by elite messaging or political actions. But it is clear that the two coexist, providing a fruitful basis for research on the degree to which elite influence, such as President Trump’s attacks on higher education, have shaped Republican public opinion (Broockman and Butler Reference Broockman and Butler2017; Lenz Reference Lenz2012; Zaller Reference Zaller1992). Political polarization characterizes numerous areas of public opinion on which one or the other major party has taken a strong, visible stand (Druckman et al. Reference Druckman, Klar, Krupnikov, Levendusky and Ryan2024). Polarizing views of higher education raise questions, however, about the limits to elite influence. Is public opinion toward higher education complicated by the perceived value and desirability of a college degree? How do attacks on higher education from the political Right square with the continued economic importance and value of a college degree? And how do college graduates reconcile their personal experiences with conservative critiques of higher education? It is one thing to rail against “woke” college professors but quite another to deny oneself or one’s children an opportunity to advance economically.
Our review of polling trends on higher education raises a series of interesting research questions. Is it possible to show the effects of elite influence on attitudes toward public opinion in an experimental setting? To what extent does personal experience with college education counteract negative messaging about the existence of political bias on campus? Do views of political bias overwhelm other attitudes concerning the value of a college degree, driving negative Republican evaluations of the sector overall? And is it possible to alter overall evaluations of higher education by increasing the salience of its positive or negative attributes? We cannot answer these questions with the current database on cross-sectional polls. Future longitudinal and experimental research is needed to shed light on the dynamics of public opinion concerning higher education and hopefully lend deeper insight into the study of public opinion more generally.
There is also considerable room for research on the political effects of self-interest on, and attitudes toward, higher education. High tuition rates coupled with heavy student indebtedness is a real problem for American families, leading Americans to say that the debt may not be worth it. But to what extent do these considerations shape the decision to attend college, send one’s children to college, or influence evaluations of higher education more generally? Our review of American public opinion suggests that such concerns play a minimal role in driving broad evaluations of higher education because Democrats and Republicans are equally exercised about the cost of a college degree, but Democrats continue to evaluate higher education far more positively than do Republicans. When it comes to evaluating higher education, politics seems to dominate other more varied, personal, and complex considerations.
In the end, a long-standing conservative critique of higher education, coupled with increasingly salient Republican accusations of campus political bias, appears to have had traction among Republicans. Going forward, both Republicans and Democrats will likely attend institutes of higher education, obtain college degrees, and encourage their children to do the same given the value they place on college education. But they may also continue to disagree on the content of college courses, the role of diversity on college campuses, and the direction and purpose of higher education, providing rich fodder for political science research.
Supplementary material
To view supplementary material for this article, please visit http://doi.org/10.1017/S1537592726105891.
Data Replication
Data replication sets are available in Harvard Dataverse at: https://doi.org/10.7910/DVN/1KJYK7.