

Gender quotas are increasingly seen as a “fast track” to redress gender imbalances in the composition of elected assemblies (Dahlerup Reference Dahlerup2006, 6). Although the detail of quotas varies significantly from one country to the next, the controversy that surrounds them and the broad arguments for and against them remain largely the same (Krook Reference Krook2004, Reference Krook2006b). Even if one accepts that legislatures should have a gender balance more in proportion to the general population (a concept which is in itself contested), quotas may still be challenged as an imperfect solution to gender inequalities in politics. Arguments against quotas based on fairness to men and to voters can be offset by arguing that the current shortage of women politicians in most democracies is even more unfair inasmuch as it results from endemic discrimination against women, and also deprives voters of the opportunity to elect women (Opello Reference Opello2006). Much more contentious is the claim that quotas may produce (or at least be seen to produce) second-class politicians (Bacchi Reference Bacchi and Dahlerup2006; Franceschet and Piscopo Reference Franceschet and Piscopo2008; Karam Reference Karam1999; Kolinsky Reference Kolinsky1993, 233; Krook Reference Krook2008; Zetterberg Reference Zetterberg2008a). The argument is put forward that if women cannot make it on their own merit without recourse to a quota, perhaps they should not be in politics at all. Even if they might have been capable of making it on their own merits, the mere fact that they were elected via a quota would give the impression that they had been selected on the grounds of their sex, rather than their suitability for the job. In the event that “quota women” are, in fact, inferior politicians, gender quotas will reduce the quality of representation for all and threaten the credibility of the institutions to which they are elected (Lovenduski Reference Lovenduski2005, 98). Quotas are also argued to undermine the legitimacy of women politicians, and as such, they may do more harm than good.
The counterargument to women's lack of “merit” is that the concept of “merit” itself may be gendered (Krook Reference Krook2006a; Murray Reference Murray2008a), and if women's talent is currently being overlooked, expanding the talent pool should actually raise standards in parliament. Advocates of quotas argue that women's exclusion from politics is not an indication of their inferior ability, but rather a result of institutional, structural, and/or psychological barriers. While a quota may not eliminate these barriers, it may help women to overcome them and thus ensure fairer representation (Dahlerup Reference Dahlerup2006; Karam Reference Karam2002; Krook Reference Krook2006a; Lovenduski Reference Lovenduski2005).
The arguments raised here certainly do not provide an exhaustive account of criticisms of quotas (for a good summary, see Bacchi Reference Bacchi and Dahlerup2006), but the qualities of women politicians are the focus of this article for two reasons. First, they were at the heart of the debate surrounding the introduction of the “parity” law in France, the implementation of which provides the case study for this article. Advocates of parity argued that women brought special and unique qualities to the political process, without which it could not be complete (Bataille and Gaspard Reference Bataille and Gaspard1999; Gaspard Reference Gaspard1997; Gaspard Servan-Schreiber, and Le Gall Reference Gaspard, Servan-Schreiber and Le Gall1992; Guigou Reference Guigou1997; Halimi Reference Halimi1994; Mossuz-Lavau Reference Mossuz-Lavau1998; Roudy Reference Roudy1995; Scott Reference Scott2005). For example, Martine Aubry (a senior woman in the Socialist Party) claimed that “women, because they have their feet more firmly on the ground and because they are more interested in action than power, are able to bring a different way of doing things to politics that is more concrete and closer to the people” (Mossuz-Lavau Reference Mossuz-Lavau1998, 79). Opponents of parity argued that such claims essentialized women and that what mattered was not candidates' sex but their ability to do the job (Lagrave Reference Lagrave2000, 128). This emphasis on a so-called meritocracy was embedded in the French universalist model, where all were seen to be equal before the law and preferential treatment for any category was unthinkable.Footnote 1 For example, Catherine Kintzler argued that “‘the law does not recognize any differences other than those of virtue and talent.’ I would prefer a competent man to a useless woman. The reverse is also true. . . . I would prefer a competent woman to a useless man” (Amar Reference Amar1999, 92).
Second, the rejection of a parity quota on the grounds of a real or perceived inferiority of “quota women” came not just from men but also from women, many of whom were themselves feminists and/or politicians, such as Elisabeth Badinter, Mona Ozouf, Evelyne Pisier, and Christine Boutin (the only deputy to vote against the parity law). For example, in a collection of articles by French feminists condemning the “trap” of parity, Luc Ferry warns that “[parity] runs the risk of creating ‘quota women,’ elected women who could, rightly or wrongly, be suspected of owing their entry into politics more to legal obligations than to their personal merit” (Amar Reference Amar1999, 124). Régine Dhoquois and Gilda Nicolau similarly warn that parity “could have the adverse effect of discrediting the worth of people elected in this way” (Amar Reference Amar1999, 141). Meanwhile, one of the leading women in the Rassemblement pour la République, or RPR (the main party of the Right), Michèle Alliot Marie, claimed that she was opposed to parity because “I find it insulting for women.”Footnote 2 These objections to a parity quota were raised in a political climate where questioning the competence and ability of women as politicians is commonplace. In 1994, Catherine Tasca (Socialist deputy and minister in the Jospin government) declared that “women are expected to be better than men to obtain the same level of responsibilities… . [T]here is a demand for proof of competence from women which is never required from men” (Halimi Reference Halimi1994, 241). More recently, doubts cast by the opponents of Ségolène Royal about her competence and ability were significant factors in her failed bid for the presidency (Murray and Perry Reference Murray and Perry2008).
As a result, following the implementation of the parity law, the question of competence is one of interest both to supporters and opponents of this law. Women might be expected to bring special qualities to politics. Alternatively, the parity law might eliminate the need for women to be better than men just to succeed at the same level, resulting in a harmonization of skills between the sexes. At the other end of the scale, parity might let in a host of inadequate women through the back door, selected through an obligation to fulfill a quota, rather than for their political qualities.
All of these claims are liable to subjective interpretation, with a lack of objective information collected about male and female politicians. For example, as Pär Zetterberg (Reference Zetterberg2008b) notes, there is a surprising lack of research on what “quota women” do once elected to power. Some studies do exist for other countries (for example, Baldez Reference Baldez2006; Childs Reference Childs2004; Franceschet and Piscopo Reference Franceschet and Piscopo2008; Zetterberg Reference Zetterberg2008a), but most work on women politicians considers their ability to represent the substantive interests of women. This research focus is extremely important for determining whether the descriptive representation of women influences women's substantive representation, but it is less helpful in addressing the question of legislative competence, and in illustrating whether women have the confidence and capacity to perform legislative functions to the same extent as their male counterparts.
The lack of studies focusing on gendered parliamentary activity is coupled with a lack of studies of “quota women” in France. Prior to 2007, this was perhaps unsurprising; the first application of parity to legislative elections in 2002 yielded an increase of women from 10.9% to just 12.3%. It was only in 2007 that the effects of parity really began to be seen, with a 50% rise in female representatives to 18.5% of the National Assembly (NA). This sudden and dramatic influx of women now presents an ideal opportunity to measure whether women are indeed more, less, or equally qualified and active than their male counterparts. The contrast between the composition of parliament on either side of the 2007 election facilitates comparison between those who came before and after parity. Men and women deputies before and after 2007 can be compared to see whether they have different backgrounds, and whether there is any difference in their parliamentary activity. In this way, it can be determined whether “quota women” are any different from those elected without the help of a quota.
The following sections elaborate on the chosen research design and then provide a quantitative analysis of the qualities and activities of men and women deputies, both before and after 2007. The findings indicate that while women may bring slightly different qualities and experiences to the National Assembly, they are no less likely than men to get on with the job effectively once elected.
RESEARCH DESIGN
The article focuses on two central aspects of deputies: who they are (their background), and what they do (their parliamentary activity). Looking at their background illustrates whether men and women have the same qualities and trajectories. The areas of focus, to be explained in more detail, are deputies' age, profession, and prior political experience. Men and women are compared for both 2002 and 2007, with a particular interest in those elected for the first time in 2007, to see whether there is anything distinctive about the women elected with the aid of the parity law.
An examination of the parliamentary activity of deputies illustrates whether men and women are performing the same kinds of tasks once elected and whether they are doing so in similar numbers. This provides an objective measure of deputies' job performance. The activities examined include asking questions, authoring and cosigning bills, writing reports, and contributing to plenary and committee sessions. Differences between the sexes are considered for both the 2002 and 2007 parliaments both to see whether there are any differences between men and women and to see whether this situation changes following a greater influx of women. Alternative variables that may influence parliamentary activity, such as safety of seat, political party, and prior parliamentary experience, are also controlled for in order to isolate the effects of sex from other independent variables. For both sets of experiments (background and activity), data is collected from the official National Assembly Website (National Assembly 2008). The research uses every available variable for both background and activity in order to offer as detailed a profile of candidates as possible. In this way, it can be determined whether there are any noticeable differences between men and women (and between women elected before and after 2007), both prior to and following election to the National Assembly.
Comparing Deputies' Background Prior to Election
The first set of experiments focuses on the profile of deputies at the point of election to the National Assembly. The age of deputies upon election is considered to see whether men and women start their parliamentary careers at similar life stages. Professional backgrounds are compared to see whether the wide gender differences in career paths present in broader French society are reflected in the composition of the National Assembly. Women are faced with an impossible double bind in this regard, as they are expected to be more representative of French society (and especially of French women), while at the same time meeting the elite standards set by their (predominantly male) counterparts in parliament. Finally, the political experience gained by deputies is measured in terms of the number and level of offices they have held to demonstrate whether women have similar political trajectories to men.
This research builds on earlier studies of the social attributes of France's men and women politicians, which have shown that France's women deputies have some significant differences to their male counterparts, but on the whole are more similar to male politicians than they are to the average French woman (Murray Reference Murray2004; Sineau and Tiberj Reference Sineau and Tiberj2007). One reason for women deputies' similarities to men might be a simple recognition of the fact that certain attributes, whether one is male or female, are particularly conducive to a career in politics. For example, while prior experience in local politics is not a prerequisite, it is clear why it might be advantageous to have a lower-level experience of politics before entering the national arena. Likewise, the time that it takes to build up the profile of experience, reputation, and status that are expected of parliamentary candidates means that it is very rare for anyone to be elected to the National Assembly before the age of 30.Footnote 3 Nonetheless, it is also possible that women are being forced to pander to male expectations of what a politician should be due to the fact that the vast majority of politicians are male. Using the criteria established by Rosabeth Moss Kanter and Drude Dahlerup, the rise from 12.3% to 18.5% women in 2007 took women's presence in the French parliament from a skewed group to a tilted group (Dahlerup Reference Dahlerup1988). This may enable women for the first time to begin to assert their gender identity, although the effects may not be visible immediately.
New Entrants
The data used in the first set of experiments is accurate to March 2008, utilizing information about deputies currently serving in parliament, even if they are the suppléant (reserve deputy) of the person elected in 2007. First, it is important to know how much political renewal actually took place in 2007 in order to make meaningful comparisons with the legislature of 2002. The incumbent government was reelected for the first time since 1978, meaning that fewer seats than usual changed hands among parties. Nonetheless, a total of 146 sitting deputies are serving their first term in the National Assembly (NA). Of these new entrants, 101 are men and 45 are women. Hence, women comprise a little under a third of new entrants. While this figure compares well to the 12.3% women present in the NA prior to the 2007 election, it means that women are still entering politics at a slower rate than men. Clearly, male incumbency, which has often been cited as an obstacle to achieving parity, is only part of the explanation (Murray Reference Murray2008b; Zimmerman Reference Zimmerman2003a, Reference Zimmerman2003b). Rather than fielding large numbers of women in new seats to offset the overrepresentation of male incumbents, parties are still giving nearly 70% of winnable new seats to men. Even so, this is an improvement compared to 2002, when only 35 of the 190 seats won by first-time deputies (18.4%) were held by women.
Age of Deputies
Research has indicated that due to domestic commitments, women are likely to enter the political arena later than men—for example, once the children have grown older (Murray Reference Murray2004; Pionchon and Derville Reference Pionchon and Derville2004; Sineau Reference Sineau2001). I explore here whether this is still the case, and whether age differences between male and female deputies can be explained in terms of gendered political careers.
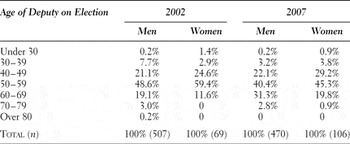
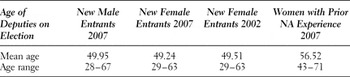
The age of deputies at the point of election is reported in Table 1. Although the number of deputies at the very top of the age range has gone down in 2007 compared to 2002, the mean age has actually gone up slightly, from 53.15 to 54.79. The mean age of women is 53.33, compared to 55.10 for men—in both cases, a rise relative to 2002. This gender gap does not seem to be attributable to women starting their political careers later than men, but rather to women finishing earlier. Whereas in 2002 there was a noticeable trend for women to be concentrated in the 50–59 bracket, with fewer women than men in either the youngest or oldest age groups, the trend in 2007 is that women are proportionally more present than men in every age group up to and including 50–59, and are then much less present in the two oldest categories. One possible explanation for this is that a high proportion of women (nearly half) are new entrants, and new entrants to the NA are more likely to be concentrated in the lower age groups, whereas the oldest deputies tend to have served a number of terms already. The best test of this theory is to look directly at the new entrants to the NA (see Table 2).
Age of winning candidate at the point of election, 2002 and 2007

Age of new entrants to the National Assembly

The new women entering the NA are certainly, on average, younger than the existing women in the NA, and it is interesting that they are also marginally younger on average than new male entrants. This suggests that the theory of women starting their political careers later in life than men is no longer valid. There is almost no difference between the ages of new women entrants in 2007 and new women entrants in 2002. However, because there are more new women this time (45, compared to 32 in 2002), the average age of women deputies may have been pushed down, whereas a greater proportion of male deputies are old-timers (42.5% of women deputies are serving their first term compared to 21.5% of men, and the mean number of terms served by current male deputies is 2.02, compared to 0.9 for women). No woman has served more than five terms, whereas 24 men (5.1%) have served six or more terms, with one man currently serving his eleventh term in the NA.
Routes into Politics: Profession
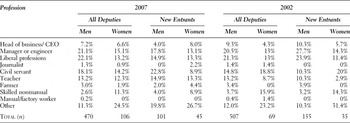
Given that women within France are disproportionately concentrated in low-status, low-paid, and part-time work, they might also be victims of the class bias present in the NA, where members of the top professions have a disproportionate presence. At the same time, if women are following the same trajectory as men in order to get into politics, then they will be even further removed from the average woman than a male deputy is likely to be removed from the average man. This may hinder claims that women deputies would be capable of representing the substantive interests of women. These arguments are considered here by comparing the professional background of male and female deputies and considering whether this has changed since 2002, especially among new entrants. The results are reported in Table 3.
Professions of deputies, by sex and year

It should be noted that the information on profession is based on the data provided by the National Assembly, which may be biased by deputies' attempts to present themselves in a favorable light—for example, Communist deputies may exaggerate their working-class roots, while some deputies may be classed as “other” to conceal an entire career based on professional political activity.Footnote 4 Catherine Achin also notes that deputies may have several different careers prior to entering parliament, and the one declared at their moment of election may not have been their principal career (Reference Achin2005, 135). As these caveats are not explicitly gendered, the data still give an indication of gender differences in deputies' professional backgrounds.
Overall, women are much less likely to be drawn from the professions that are traditionally male dominated, including management, the liberal professions, and farming, and are slightly less likely to be heads of business. Surprisingly, the more public-sector areas of civil service and teaching that might be considered more likely to favor women are actually better represented by men. The areas in which women are disproportionately represented are in skilled nonmanual and “other” categories (including those with no career), suggesting that women do have slightly different career trajectories than men, even among the elite group of women politicians. This continues the trend observed in 2002, but the gap appears to be narrowing somewhat. Among new entrants, there are obvious but not statistically significant gender differences (perhaps due to the low n), with women actually twice as likely as men to be heads of business, and much less likely to be civil servants. Like the 2002 new women (and women overall), the 2007 new women are more likely than men to come from the categories of skilled nonmanual (employé) and “other,” although this trend appears to be declining. Women are increasingly present in the higher socioeconomic categories, suggesting that they are better able to compete with men than before, and challenging the argument that it is hard to find enough women with suitable qualifications. Although it is not clear why so few new women in 2007 came from the civil service, the overall trend appears to be positive. It is impossible for women to meet the double standard of being as highly qualified as men and at the same time representative of women more broadly in society, but the new women entrants appear to have a greater presence in the highest socioeconomic categories than their women predecessors, while still being more representative of French society than men. In terms of profession, at least, the findings suggest that women can make limited claims of political renewal while defending themselves against claims of being second-class politicians elected only through the parity quota.
Routes into Politics: Experience
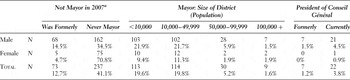
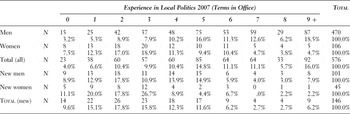
The most common route into a political career at the national level is a political career built up at the local level. Women's limited presence in local politics was given a major boost in 2001 thanks to the parity law, which has a stricter application in elections using proportional lists (lists not compliant with the law are rejected, and the law also regulates the placement of women on the lists). However, despite the large increase (to 47.5%) in women elected where the law applied in 2001, the presence of women stagnated in all areas where the law was not applicable (Bird Reference Bird2004; Troupel Reference Troupel2002). In particular, women remained largely absent from two major sources of local power that serve as useful springboards to national office, namely, as local executives (and especially the coveted position of mayor), and on departmental councils (conseils généraux). As Table 4 illustrates, current women deputies are less likely than men to have been a mayor, and only one woman deputy has ever presided over a conseil general, compared to 28 men.
Deputies and local executive office, 2007

Notes: A x 2 test revealed the results to be significant to p < 0.01.
aThose who did not hold mayoral office in 2007 were divided into two categories; those who had previously been mayors, and those who had never held mayoral office.
In addition to municipal and departmental executive offices, regional councils can also be a good entry point to national politics. In 2007, there was only one woman in France who presided over a regional council, in Poitou-Charentes. This woman was Ségolène Royal, who had announced that she would not defend her parliamentary seat in 2007 as a demonstration of confidence in her (unsuccessful) bid for the presidency. As a consequence, the opportunity to combine presidency of a regional council with the role of deputy was exclusively the preserve of men. In 2008, nine male deputies were also presidents of regional councils, with a further two having formerly held such a position.
Table 5 illustrates that, overall, men have served more terms in local office than women. These terms of office can include any position on a municipal, intercommunal, departmental, or regional council, with each period of election counting as one term. The mean number of terms served by a man was 5.39, compared to 3.63 for a woman. This trend carried through to new deputies, with new men having served an average of 3.69 terms, compared to 2.71 for new women. How one interprets these results can vary depending on the argument one wishes to pursue. The lower levels of women's presence in local politics are evident even at the national level. One way of interpreting this trend is that less qualified women are being promoted unfairly, with inexperienced women getting selected for the NA more easily than men. On the other hand, it could be argued that the parity law, where applied, is compensating for inequalities where it does not apply. For example, the application of parity at the national level is helping to mitigate the absence of women in local executive offices to which the law did not apply in 2001. It is also worth noting that although women overall have less experience than men, men are still being selected in higher numbers than women when they have no experience at all, or very little—the proportions of women from this category may be higher, but the absolute numbers favor men. In other words, the majority of deputies with little or no prior experience in politics are male. This refutes the argument that parity is allowing underqualified women in through the back door—the primary beneficiaries of fast-track promotions are men.
Number of terms of local office served for all and new deputies, 2007

Notes: A x 2 test revealed the results for all deputies to be significant to p < 0.01. The results for new deputies were not significant.
In terms of their overall background, the quota women newly elected in 2007 represent a mixture of change and continuity. They are younger and from higher professional backgrounds than the women who came before them, suggesting that women are increasingly competing on the same terms as men. The advantage is that this counters claims that women who were selected as a result of the parity legislation were inferior candidates who could not have made it on their own terms. The increase in quantity of women appears to converge with a corresponding increase in quality, if one judges women by the standards of the male norm. At the same time, women deputies remain slightly more representative of the social diversity of France. The gender gaps between men and women deputies are narrowing in some areas such as age and profession, although gaps remain stark in certain areas. Women remain underrepresented in certain powerful professions that are associated with political careers. Furthermore, women are heavily underrepresented in the areas of local politics most likely to serve as a springboard to national office, such as mayors, heads of departmental councils, and other local and regional executive positions. Women are also being given fewer opportunities than men, with men comprising the majority of newcomers and also the majority of those new deputies with little or no prior political experience. These results all suggest that the barriers to women's political representation remain, and without parity, women might find it even harder to get into parliament. The influx of “quota women” arguably has not compromised the quality of deputies in terms of background—these women appear to be located in the middle ground between imitating their male counterparts and representing the diversity of French women. How these differences translate into behavior once elected is explored in the next section.
Comparing Deputies' Parliamentary Activity
The second set of experiments considers the actions of deputies following their election. The data used is the actual number of times each deputy asked a question, authored a bill, cosigned a bill, wrote a report, participated in a plenary session in the National Assembly, and contributed to a committee session. These six measures are based on information provided by the NA, and they can be considered the most salient and easily comparable activities performed by deputies. The data allow for comparison between men and women and also between the 2002–7 parliamentary session (known as the 12th Parliament), before the impact of parity was really felt, and the 2007–8 (13th) parliamentary session, following the significant rise in women in the NA. This information has only recently become readily accessible in the public domain, with information about every deputy's activities listed on his or her page on the NA Website. This places the first of two restrictions on the data, namely, that the information for the 12th Parliament (2002–7) is less complete than the information for the 13th Parliament (2007–8). Information on contributions to plenary sessions dates back only to January 2004, and there is no information on contributions to committee sessions prior to 2007. The second limitation is that the data need to be static; in other words, each deputy needs to have served an equal term in order for the measure of his or her activity to be comparable.
To ensure consistency, two precautions have been taken. First, the data for the 12th Parliament was collected after all business had been concluded, and the data for 2007–8 was collected over the space of a few days during the 2008 summer recess, in order to ensure optimum fairness. Second, any deputy who did not serve a full term was eliminated from the study. As a result, out of 577 deputies, the n for the 12th Parliament is 540, and the n for the 13th Parliament is 567. Given the high n, and the surprising consistency between the different measures of activity used, it is still possible to draw interesting and meaningful conclusions from the data, as will be revealed.
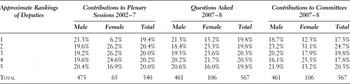
The first test of the data was to run cross-tabulations between each of the dependent variables (the six measures of activity) and the sex of the deputies. For both the 12th and 13th Parliaments, and across all dependent variables, chi-square tests revealed no significant relationship, indicating that there were no identifiable differences in the performances of men and women. Given the large range present in some variables (for example, the number of questions asked in the 12th Parliament ranged from 0 to 4,049), it is very difficult to identify any meaningful patterns in a cross-tabulation. For this reason, the data were grouped together into five categories based on percentile groups. The categories 1–5 represent, as closely as possible, the bottom 20% of deputies in terms of activity (1) through to the 20% most active deputies (5).Footnote 5 Once organized in this way, a couple of patterns emerged more clearly, although the statistical significance of the findings in Table 6 (all of which were significant at p < 0.05) is to be interpreted with caution—they are primarily for illustrative purposes. (All variables other than those reported in the following sections continued to show no relationship between sex and the dependent variable, with or without grouping).
Patterns of activity, by sex

It was not possible to split deputies into groups based on exact percentiles, as there were often multiple deputies sharing the same value. For example, the boundary for the bottom 20% of deputies asking questions in the 12th legislature lay between 47 and 48 questions.
As men remain numerically dominant in the NA, the division of deputies into percentile groups is predominantly influenced by male activity. It is unsurprising, therefore, that the distribution of men throughout these groups is fairly consistent. What is notable is that women do not follow the same pattern as men, but rather tend to be bunched together in the middle categories, with relatively few women present in the categories of most and least active. Women are consistently least likely to be found in the bottom category of activity, suggesting that the most complacent or otherwise occupied deputies tend to be men. Women are also less likely to be among the top performers, although men dominate positions of influence such as president of the NA and the executive of all parliamentary committees, which might explain why certain men are the most active members of parliament.
These results imply that there is no relationship between the sex of the deputy and the level of parliamentary activity. However, this finding may obscure the true relationship between sex and activity if there are other independent variables affecting the relationship. For example, one of the possible reasons for men's presence in the top-performing category for some variables is that they tend to hold the most powerful positions in parliament. These positions tend to be associated with seniority, which itself is related to the number of terms a deputy has served. Bearing in mind that women tend to serve fewer terms than men and are more likely to be newcomers, controlling for prior terms in the NA is important in order to help separate out the differences attributable solely to deputies' sex. Similarly, deputies in marginal constituencies might be more likely to prioritize activities within their constituency, for which no data are available, rather than focusing their efforts on work within the NA, and so safety of seat was also brought in as a control variable.Footnote 6 Finally, the party to which a deputy belongs might have a big impact on levels of activity, depending on whether the party supports or opposes the government. Parties of the Right have formed or supported the government since 2002, with parties of the Left in opposition, and so a dummy variable has been used to control for parties' left/right orientationFootnote 7 The dependent variables were then tested again with ordinary least squares regression analysis, using the four independent variables of sex, prior terms in the NA, safety of seat, and party (a left–right dummy). The results are reported in the following tables and discussion.
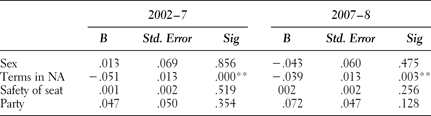
Table 7 reveals that prior experience in the NA is the only significant variable affecting the number of questions asked, and its negative sign suggests that those who have been in the NA longer are less likely to ask high numbers of questions. This may be because asking questions is a relatively simple task that does not require much seniority, whereas those with more experience may be more involved in demanding tasks such as authoring reports and bills. In addition, Anne Stevens notes that “there is little evidence that questions are taken very seriously by the government and its officials. Many of the written questions put by members to ministers remain unanswered” (2003, 184). As a result, more senior parliamentarians may not consider asking questions to be an effective use of their time, leaving this activity to those members who are conscientious in their role of scrutiny or who crave the dim limelight provided by the televised coverage of oral questions. This confirms Sébastien Lazardeux's (Reference Lazardeux2005) finding that questions are used by junior parliamentarians to obtain information about government policies. In any case, sex is insignificant both before and after 2007.
Number of questions asked
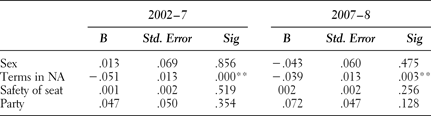
Notes: R2: 0.022 (2002−7), 0.013 (2007−8); B = unstandardized coefficients. ** = p <0.01.
The data for this dependent variable were skewed, with a few deputies creating outliers at the top end of the range by asking very high numbers of questions. As the interest was in relative rather than absolute performance, this regression uses a logarithm of the dependent variable to reduce the distortion created by the outliers. An alternative method using a ranked dependent variable produced a similar outcome. This and all other regressions were tested for multicollinearity and heteroscedasticity and showed no evidence of either.
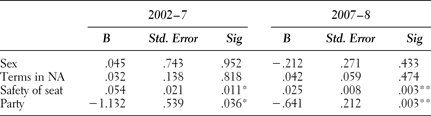
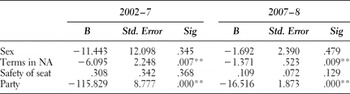
For both parliaments, the findings are very similar, with the two significant variables being safety of seat and party (see Table 8). Right-wing members of parliament were more likely to author bills—perhaps with the tacit support of the government (Stevens Reference Stevens2003, 180). Those in safer seats were also more likely to author bills, and this was the most significant variable. As proposing bills is quite a time-consuming (and potentially controversial) activity, those in marginal seats might prioritize spending time in their constituencies, leaving work on bills for those who can afford to focus their efforts on parliamentary activity. Sex is not significant and, interestingly, neither is prior experience.
Number of private members' bills authored
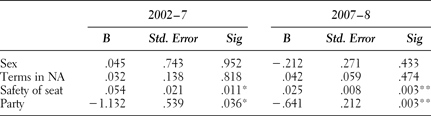
Notes: R2: 0.021 (2002−7), 0.039 (2007−8); B = unstandardized coefficients.
** = p<0.01; * = p < 0.05.
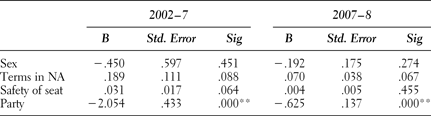
Table 9 again demonstrates very similar findings for both parliaments, this time concerning the number of private members' bills cosigned. This regression yields a higher R2 than the others, with both prior experience and party being highly significant. Members of the governing party are much more likely to cosign bills, which is unsurprising given that most bills are emanating from their party colleagues. More surprising is that deputies with higher levels of parliamentary experience are less likely to cosign bills than are their more junior colleagues. Perhaps new deputies are keen to lend their name to everything going, whereas more senior deputies are more discriminating. Once again, sex is completely insignificant.
Number of private members' bills cosigned

Notes: R2: 0.296 (2002−7), 0.142 (2007−8); B = unstandardized coefficients.
** = p < 0.01.
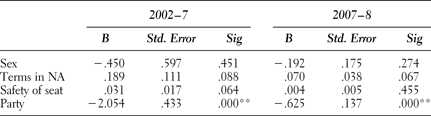
Writing reports is a relatively senior and time-consuming activity, and Table 10 reveals that it is primarily the preserve of members of the governing party. While party is the key variable, experience is also significant at the p < 0.1 level, hinting that more experienced members are more likely to write reports. This is unsurprising and may also explain why more senior members focus on activities like this, rather than on less prestigious activities such as asking questions. Safety of seat is significant at the p < 0.1 level in the 12th Parliament but not the 13th. Yet again, sex remains insignificant.
Number of reports written
Notes: R2: 0.059 (2002−7), 0.049 (2007−8); B = unstandardized coefficients.
** = p<0.01.
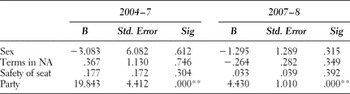
Contributions to plenary sessions might be considered a high-profile and prestigious activity (see Table 11). In fact, they appear first and foremost to be the preserve of the opposition, with a very strong relationship between the number of contributions and membership in a left-wing party. All other variables, including sex, were insignificant.
Contributions to plenary sessions

Notes: R2: 0.033 (2004−7), 0.028 (2007−8); B = unstandardized coefficients.
** = p < 0.01.
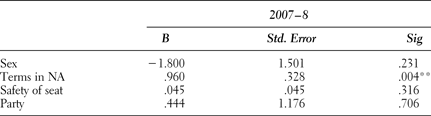
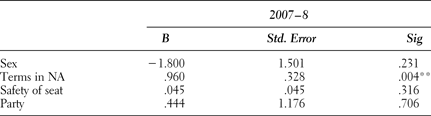
In Table 12, information on committee sessions is only available for the 13th Parliament. Unlike plenaries, committee work appears to be a matter of experience rather than partisanship, with those with more experience being more likely to contribute to committee sessions. Sex is not significant, but the direction of the relationship suggests that men may contribute more than women to committee sessions, although the low significance means that this must be interpreted with caution. It should also be noted that all six parliamentary committees are presided over by men, and women occupy only five of the 47 executive positions on committees. It is reasonable to assume that the executive members of committees would contribute the most, and so it is almost surprising that sex is not significant here. It may be that women are very active within their roles as ordinary members of committees. These findings all accord with Amanda Green's study of parliamentary committees, where she concludes that the male/female division of labor within committees is a combination of seniority (with men more likely to have the level of seniority required to lead committees and to be a member of the most prestigious committees such as finance), personal interest (with women tending to orient toward “useful” committees such as social affairs, rather than “prestigious” committees such as defense), and the structural problems associated with “a system [that] has evolved under male dominion” (Green Reference Green2004, 157).
Contributions to committee sessions
Notes: R2: 0.019; B = unstandardized coefficients. **= p < 0.01.
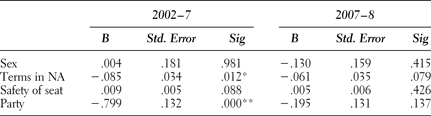
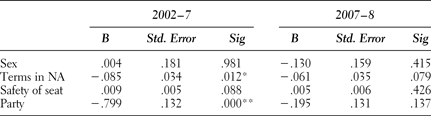
Finally, combined scores are provided in Table 13 to consider the impact of the different independent variables on the total levels of parliamentary activity. Given the variations reported previously, some nuances are lost when the combined scores are considered. For example, the more experienced members of parliament appear to be less active, but this may be a reflection of more time spent on prestigious and time-consuming activities such as authoring reports, rather than on lower-level activities such as asking questions. Similarly, members of the governing party are more active in areas such as writing reports, while members of the opposition are more likely to contribute to plenary sessions. Nonetheless, experience and party remain the dominant variables, while sex is completely insignificant.
Total parliamentary activity
Notes: R2: 0.094 (2002−7), 0.003 (2007−8); B = unstandardized coefficients.
** = p < 0.01; * = p < 0.05.
The dependent variable for this table is a combination of all the measures of parliamentary activity used in this study. In order to weight the different measures, a logarithm of each separate dependent variable was created and these logarithms were then summed to create a dependent variable for total parliamentary activity.
Considered collectively, the measures of parliamentary activity indicate two important trends. First, the four independent variables used in this study all had a significant relationship with at least one form of parliamentary activity, with the notable exception of sex, which was never significant. Second, there were strong similarities in the data for the 12th and 13th Parliaments. Taken together, these trends suggest that the introduction of more women through the parity law has had no measurable impact on parliamentary activity. There is no significant relationship between sex and any kind of parliamentary activity observed here, and nothing changed following the 50% rise in women in 2007. These findings support the argument that the new women deputies in the NA are performing at the same levels as men and as those who came before them.
CONCLUSION
This article has explored the impact of the parity law on the National Assembly in two ways. It first looked at whether the new “quota women” came from different backgrounds than the men and women around them. The findings suggest that newly elected women do have slightly different backgrounds to newly elected men, although the gap between men and women is closing, further suggesting that quota women are more like men than their nonquota counterparts, rather than the other way round. The gender differences that are present stem from inequalities in society, and quotas are helping women to overcome this barrier to entry. And even with these different backgrounds, the second part of the article illustrated that there is no noticeable difference between men and women in terms of volume or type of parliamentary activity following election. Quota women do indeed appear to be “up to the job,” with no distinguishable differences between them and their male counterparts or the deputies that preceded them.
A conclusion can be drawn that women are slightly more representative of the general population in terms of their background, thus at least partially fulfilling expectations of political renewal, while also demonstrating equal competence to men once elected. Hence, the parity law is helping to enhance the fairness and perceived legitimacy of the National Assembly without any apparent loss of quality or representation. This finding offers strong empirical evidence to reinforce arguments in favor of quotas. There is one caveat within this conclusion. The article has focused on parliamentary activity from a quantitative perspective, looking at the volume and type of activity, rather than considering the content of the output. It is not clear from this study whether there are any qualitative differences between men's and women's parliamentary activity—for example, whether women are focusing on different issues and policy areas than are men, and whether there is any evidence of women deputies representing the substantive interests of women constituents. There is obvious potential for a wider research project to explore this issue further. Nonetheless, this study has clearly demonstrated that women politicians are as capable as men at getting on with the job. They may still be numerically unequal—but they are certainly not second-class.