NOMENCLATURE
- ABP
achieve-by-point
- AEM
arrival expedition margin
- AP
action point
- APC
preselected action point set
- APD
action point distance
- APM
action point modification set
- ASTAR
airborne spacing for terminal arrival routes
- BADA
base of aircraft data
- CAS
calibrated airspeed
- DTG
distance-to-go
- ETA
estimated time of arrival
- FIM
flight-deck interval management
- ft
feet
- IM-SP
interval management – speed planning
- Kn
knots
- MOPS
minimal operation performance standards
- NM
nautical miles
- OWN
ownship
- PSO
particle swarm optimisation
- RPD
reference profile deviation
- RTA
required time of arrival
- SD
standard deviation
- SMPSO
speed-constrained multi-objective particle swarm optimisation
- TGT
target
- TTF
traffic-to-follow
- TTG
time-to-go
- TTR
time-to-react
- A
amplification factor
 $c_{\rm x}$
constant (user defined)
-
$f_{\rm x}$
objective function
-
$e{(t)}$
spacing error
-
$q_{\rm x}$
weight factors
-
$p_{\rm x}$
particle position
-
$r_{\rm x}$
random number
-
$s_{\rm x}$
individual score
-
$S_{\rm x}$
final score
-
$v_{\rm x}$
velocity
-
$\Delta$
nominal spacing
-
$\delta$
dimensional particle speed limit
-
$\chi$
velocity constriction coefficient
-
$\varphi$
sum of constants
-
$\omega$
particle inertia


1.0 INTRODUCTION
Sophisticated technologies for air traffic management that promote higher air-route and runway utilisation while maintaining high levels of safety have been the research focus of several global airspace modernisation initiatives, such as NextGen(1), SESAR(2) and CARATS(3).
One such technology that assists pilots and air traffic controllers alike and that is a common working task of the three initiatives is Flight-deck Interval Management (FIM)(4,5) . FIM is an airborne self-spacing concept that could potentially allow for an increase in throughput of up to four aircraft per hour per runway compared with current time-based metering operations(Reference Bone and Mendolia6).
The most commonly used logic for FIM, namely Airborne Spacing for Terminal Arrival Routes (ASTAR)(Reference Abbott7,Reference Baxley, Johnson, Scardina and Shay8) , was developed by the National Aeronautics and Space Administration (NASA). ASTAR issues speed commands based on a feed-forward logic, which, in a federated implementation, are set by the crew on the autopilot control panel, similar to speed commands received by air traffic control.
NASA’s research concluded with an actual flight test in 2017, and the results showed good overall performance and acceptance, while they also highlighted the need for further research to achieve operational implementation, with an emphasis on reducing the number of speed commands and speed reversals, i.e. accelerations after a deceleration(Reference Swieringa, Wilson, Baxley, Roper, Abbott, Levitt and Scharl9–Reference Baxley, Swieringa, Roper, Hubbs, Goess and Shay11).
In response to these findings of the NASA flight test, a new FIM logic, namely Interval Management – Speed Planning (IM-SP)(Reference Riedel, Takahashi and Itoh12), was introduced in 2019. IM-SP uses a rule-based cost function with an adjustable weight factor to determine the required IM speed changes. Compared with ASTAR, IM-SP has been shown to significantly reduce the number of speed commands, albeit at the expense of slightly reduced spacing performance and higher fuel burn(Reference Riedel, Takahashi and Itoh12).
As IM-SP used experienced-based and balanced cost function weights in its original version, it has scope for further improvement through weight factor optimisation. However, the difficulty in this task lies in the different paradigms of federated FIM operation, including reliable spacing performance, operationally feasible speed profiles and low cost. Therefore, this task must be formulated as a multi-objective optimisation problem. The lack of derivative information of the objective functions only allows for derivative-free optimisation strategies, which further increases the complexity of the task.
This study adopts speed-constrained multi-objective particle swarm optimisation (SMPSO)(Reference Nebro, Durillo, GarcÍa-Nieto, Coello Coello, Luna and Alba13,Reference Rahil, Abou El Majd and Bouchoum14) , a bio-inspired optimisation strategy, to find suitable weight settings and improve the performance of IM-SP. Among the suitable candidates, two distinguished solutions emerge, which are tested and compared with the original settings. The results show that both solutions can enhance the performance of IM-SP on the basis of different priorities.
The remainder of this paper is organised as follows. Section 2 outlines the working principles of FIM, IM-SP and the optimisation methods. Section 3 describes the details of the objective function, parameters to be investigated and cost function weights. Section 4 introduces the simulation environment. Section 5 provides an in-depth analysis of each cost function weight. Section 6 presents the SMPSO optimisation results. Section 7 discusses and interprets the results and explores directions for future research. Finally, Section 8 concludes the paper.
2.0 SYSTEM DESCRIPTION
2.1 Flight-deck Interval Management (FIM)
Continuous research effort, especially with regard to ASTAR, has led to the development of the Minimal Operating Performance Standards for FIM (MOPS-FIM)(4), which includes all the important definitions and equations for FIM operation.
The key element for the time-based separation is the spacing error term e(t).
To calculate e(t), the remaining flight time (‘time-to-go’, TTG) of the own aircraft (‘Ownship’, OWN) is compared with that of a pre-assigned target aircraft (‘Traffic-To-Follow’, TTF) to a common waypoint called the Achieve-By-Point (ABP). By adding a nominal spacing target (Δ), e(t) can be calculated as follows:
 \begin{equation}e(t) = TT{G_{{\rm{OWN}}}}(t) - \left( {TT{G_{{\rm{TTF}}}}(t) + \Delta} \right)\end{equation}
By adding the current time, TTG can be replaced with the estimated time of arrival (ETA) for each aircraft such that the term within the parentheses (ETA TTF + △) can be summarised as the required time of arrival (RTA):
 \begin{equation}e(t) = ET{A_{OWN}}(t) - RTA(t)\end{equation}
Consequently, a positive error term indicates a delayed arrival whereas a negative one indicates an early arrival. The FIM logic then tries to eliminate any spacing error via speed commands.
Technically, the TTF’s TTG is calculated from its current speed and position obtained via ADS-B, while the ownship’s TTG is obtained from data supplied by the flight management system.
2.2 Interval Management – Speed Planning (IM-SP)
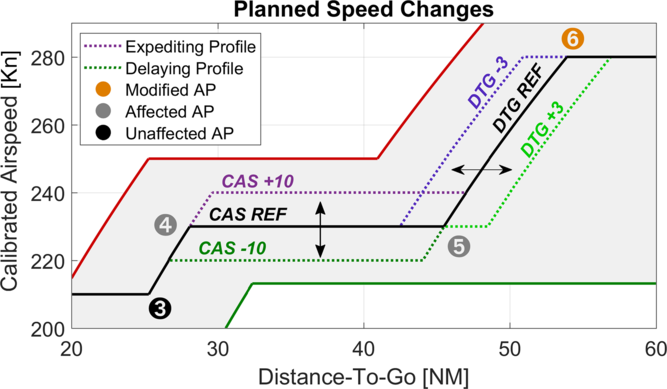
IM-SP is a newly developed logic for FIM, designed to evaluate and re-plan the entire remaining speed schedule to achieve the spacing objective. Modifications are made primarily to existing speed changes (as opposed to the current speed in ASTAR) by changing their target Calibrated Airspeed (CAS) to a higher or lower value, or the location where the speed change is initiated to an earlier or later position (Fig. 1). Additional speed changes are inserted only when deemed favourable or necessary.
Speed change modification principle of IM-SP.(Reference Riedel, Takahashi and Itoh12) Here, AP6 is modified, thus affecting AP5 for DTG change, or both AP5 and AP4 for a CASTGT change.

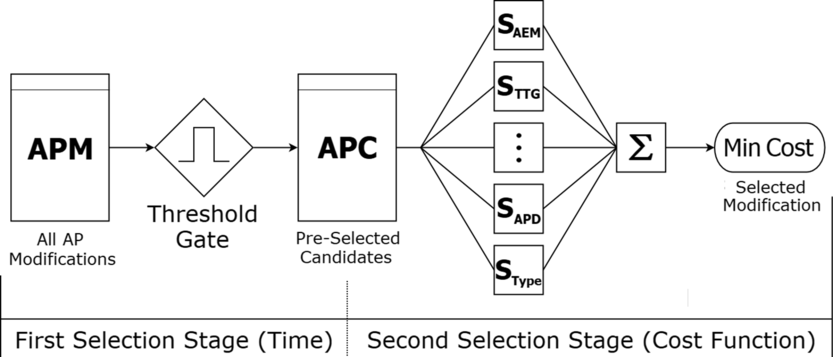
To choose the most appropriate speed plan modification, IM-SP uses a two-stage selection process, involving a time-based primary stage and a cost-function-driven secondary stage, as shown in Fig. 2.
Functional selection stages and flow of IM-SP.(Reference Riedel, Takahashi and Itoh12)

The cost for a speed plan modification is based on the characteristics of the modification itself (as further explained in Section 3.3).
Internally, these characteristics are associated with Action Points (APs). APs are important points in the speed schedule. The most prominent APs are the beginning or end of speed changes. Other important APs include the Mach transition point as well as the system initiation and termination points. They are numbered sequentially and store information such as the location (‘Distance-To-Go’, DTG), nominal CAS, target CAS (CASTGT) and other scoring-related attributes. Modifications to an AP can affect only subsequent APs, as shown in Fig. 1. The modified AP, subsequently affected APs and unaffected APs are indicated in orange, black and grey, respectively.
2.3 Particle Swarm Optimisation (PSO)
Particle swarm optimisation (PSO) is a Nature-inspired metaheuristic that was first proposed by Kennedy and Eberhard in 1995(Reference Kennedy and Eberhart15). It is classified as an Evolutionary Algorithm (EA) that is based on swarm or social behaviour, such as the flocking behaviour of birds or schooling behaviour of fish.
PSO works on the principle that the particles in the population move individually through the search space to find the global minimum, where they are driven by both an individual force (‘pursue your own goal’) and a social force (‘follow the leader’).
First, all the particles are distributed over the search space, giving each particle a starting position ( ${\vec p_0}$
) and an initial velocity (
 ${\vec v_0})$
. The particle with the best position, i.e. the current global minimum (
 ${\vec g_{Best}}$
), becomes the leader. Further, each particle memorises its individual best position (
 ${\vec p_{Best}}$
), which is not shared with the other particles.
All the particles now start to move, and their new velocity ( ${\vec v_{n+1}}$
) is determined by their inertia (
 $\omega$
) and their individual and social pull, given by Ref. (Reference Shi and Eberhart16) as
 \begin{equation}{\vec v_{n+1}} = {\rm{}}\omega \cdot {\vec v_n} + {\rm{}}{c_p} \cdot {r_1} \cdot \left( {{{\vec p}_{Best}} - {{\vec p}_n}} \right) + {c_g} \cdot {r_2} \cdot \left( {{{\vec g}_{Best}} - {{\vec p}_n}} \right),\end{equation}
where c represents the user-defined magnification factors and r random values, the latter of which are newly determined in each iteration.
The particles’ next position ( ${\vec p_{n+1}}$
) is then given by Ref. (Reference Shi and Eberhart16) as
 \begin{equation}{\vec p_{n+1}} = {\rm{}}{\vec p_n} + {\rm{}}{\vec v_{n+1}}\end{equation}
If a particle finds a position better than  ${\vec p_{Best}}$
, the new value is memorised in lieu of the former. Further, if a new global minimum is found,
 ${\vec g_{Best}}$
is updated and the corresponding particle becomes the leader.
PSO ends after a fixed number of iterations or when an abort criterion is met.
2.4 Speed-constrained Multi-objective Particle Swarm Optimisation (SMPSO)
SMPSO is an enhanced version of PSO, precisely OMOPSO(Reference Sierra and Coello Coello17), a multi-objective PSO algorithm that incorporates additional features (further described below) that have been shown to facilitate a more uniform examination of the search area as well as faster exploration of the Pareto front(Reference Nebro, Durillo, GarcÍa-Nieto, Coello Coello, Luna and Alba13).
Previous applications of SMPSO in the aerospace context include the optimisation of air routes for hub connections(Reference Rahil, Abou El Majd and Bouchoum14).
As suggested by its name, SMPSO’s main feature is the speed constraining term that limits an individual particle’s velocity to avoid ‘swarm explosion’, expressing the phenomenon that particles gain high speed, skip unexplored areas and ultimately reach the search space limits.
Based on an idea originally proposed by Clerc and Kennedy(Reference Clerc and Kennedy18), SMPSO uses the sum ( $\varphi$
) of the user-defined magnification factors c,
 \begin{equation}\varphi = {c_p} + {c_g}\end{equation}
to define a velocity constriction coefficient (χ), which is expressed in a shortened form as
 \begin{align}{{\chi }} = \left\{ \begin{array}{ll} \dfrac{2}{2 - \varphi - \sqrt {{\varphi ^2} - 4\varphi } }, &\quad \varphi < 4 \\ 1,&\quad \varphi \le 4 \end{array} \right. .\end{align}
Note that, for SMPSO, c p and c g are randomly chosen, and they are limited to the range of [1.5, 2.5].
The new velocity of a particle is then determined by multiplying the velocity of the PSO algorithm (Equation 3) by the constriction coefficient (Equation 6).
Finally, the velocity of the particles in each dimension is limited by half the dimension span:
 \begin{equation}{\delta _j} = {{\left( {upper\_limi{t_j} - lower\_limi{t_j}} \right)} \over 2}\end{equation}
Thus, the dimensional speed (v j) lies within the range [ $-\delta_{j},\ \delta_{j}$
].
Another important feature of SMPSO is the mutation concept, which is inherited from OMOPSO. Mutation describes the (random) partial change of the particle’s position component values, occurring at a given probability. The added movement improves propagation and lowers the risk of particles becoming trapped in local minima.
3.0 OPTIMISATION PROBLEM
3.1 Objective function parameters
A total of four parameters, i.e. one performance, one ecology and two usability factors, are chosen for the objective function. The input argument is IM-SP’s cost function weight vector ( $\vec q$
), giving the general equation
 \begin{equation}\min f({\vec q}) = {\rm{min}}\left( {{f_1}({\vec q}),{f_2}({\vec q}),{f_3}({\vec q}),{f_4}({\vec q})} \right)\end{equation}
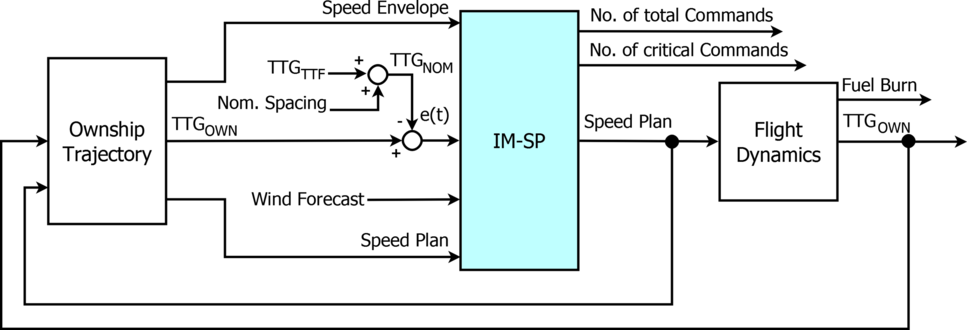
For minimisation, some factors have been adapted as described below. The block diagram of IM-SP is shown in Fig. 3.
Block diagram of IM-SP relevant blocks. IM-SP’s logic block is highlighted in blue in the centre. To the left is the ownship’s trajectory as the main input provider; To the right is the flight dynamics block as a post-processor of the speed plan to obtain further performance data. Information flow from left to right: 1) The speed envelope, the ownship’s TTG (TTGOWN) and the speed plan are output from the ownship’s trajectory. 2) TTGOWN is compared with the spacing target time (given by the nominal spacing and traffic’s TTG) to obtain the spacing error e(t). 3) From these inputs, IM-SP generates a new speed plan and logs a change history from which the number of total commands and critical commands are obtained. 4) The speed plan is looped back to the ownship trajectory and passed forward to the flight dynamics. 5) From the flight dynamics the new fuel burn and TTGOWN are calculated. 6) TTGOWN is looped back to the ownship trajectory and returned as the spacing error correcting variable

3.1.1 Final spacing error
The final spacing error indicates the deviation between the Actual Time of Arrival (ATA) and the RTA at the ABP, or the measuring gate; thus, it is the primary indicator of IM performance. Ideally, this value is 0s, i.e., neither too early nor too late; thus, the partial objective function is
 \begin{equation}{f_1}({\vec q}) = \left| {e(t)} \right|\end{equation}
In a realistic environment, FIM operation is deemed successful if 95% of all arrivals are within ±10s of the RTA(4,Reference De Gelder, Bussink, Knapen and in ‘t Veld19) . For easier comparison with Ref. (Reference Riedel, Takahashi and Itoh12), ±5s is used as the target range here.
3.1.2 Fuel burn
The fuel burn is used as an ecological indicator of FIM operation. In general, the lower the fuel burn, the lower the cost. Therefore,
 \begin{equation}{f_2}({\vec q}) = Fuel\ Burn.\end{equation}
For the reference profile, a fuel burn of 1600.4kg was estimated. However, as FIM operation requires deviation from the reference profile, a slight increase in fuel burn must be expected.
3.1.3 Total number of commands
The number of commands represents how often the speed is changed; thus, in a federated system environment, it represents the required number of interactions by the crew. Therefore, it is the first indication of the workload imposed by the system on the crew. In general, fewer commands are favourable; however, too few commands could result in undesirably high speed change magnitudes. Therefore, ideally, the number of speed commands (n) will be equal to the number of changes in the reference profile (n Ref):
 \begin{equation}{f_3}({\vec q}) = \left| {n - {n_{Ref}}} \right|\end{equation}
Here, the reference profile has six commands.
3.1.4 Number of critical commands
As MOPS-FIM expects a command to take effect within 11s of its annunciation (including latency and engine delay)(4), the crew is required to immediately recognise and comply with the command. Otherwise, there is a risk that the FIM logic’s intentions might not be met. To reduce this risk, IM-SP was designed to avoid commands on short notice, unless absolutely necessary (Subsection 2.2.). These commands are further referred to as ‘critical commands’ (n Crit) and include all commands with lead times shorter than 15s. Ideally, no critical command is required during IM-SP-based FIM operation. Thus,
 \begin{equation}{f_4}({\vec q}) = {n_{{\rm{Crit}}}}\end{equation}
3.2 Other non-objective function parameters
In addition to the objective function parameters, four other parameters, two indicating usability and two that are related to the speed profile, are evaluated in this paper to show the side effects of the cost function setting as well as for clearer comparison with previous studies.
3.2.1 Accelerations
During descent and on approach, accelerations are usually undesired, especially after the initial deceleration has been made. Nevertheless, for successful FIM operation, accelerations might be inevitable, in which case they should be kept to the absolute minimum. Naturally, the reference profile has no planned accelerations.
3.2.2 Speed brake use
Speed brakes are used to increase drag, with the purpose of increasing either the rate of descent or the deceleration rate. Here, they are used solely for the latter purpose. Whenever idle thrust does not allow for a sufficient deceleration rate, the use of speed brakes, for the minimum time required to achieve the above-mentioned deceleration rate, is assumed. The use time for the reference profile was estimated to be 393.3s (6min 33.3s). Note that for fixed flight path angle descent operations, the average use time is significantly longer than that for stepped descents.
In any case, the use of speed brakes is often considered undesirable by pilots, as it requires a certain amount of attention. Therefore, low values are desirable.
3.2.3 Reference profile deviation
The Reference Profile Deviation (RPD) was introduced to indicate the deviation of the final FIM-logic-generated speed profile from the reference profile. The lower the RPD, the closer the profile to the reference profile. It is simply calculated by multiplying the difference in knots between the CAS and the reference CAS by the distance over which the deviation is observed. In other words, it describes the area between the new profile and the reference profile in the CAS/DTG graph (Fig. 6). Accordingly, the unit of the RPD is knots times nautical miles (Kn × NM).
3.2.4 Maximum reference CAS deviation
The maximum reference CAS deviation indicates the highest difference between the nominal and commanded speeds during a scenario. However, in contrast to RPD, this value is not influenced by the duration of the deviation. Note that, owing to the design of IM-SP, changes in DTG also cause a difference between the nominal and commanded speeds.
3.3 Cost function elements and weights
As shown in Fig. 2, IM-SP includes a cost-function-based selection stage involving the scoring vector ( $\vec s$
). This vector consists of five elements: two primary selection attributes (s AEM and s TTG) and three secondary penalty attributes (s TTR, s APD and s Type).
For each scoring element, a corresponding weight (q AEM, q TTG etc.) exists in the weight vector ( $\vec q$
). The final score (S) for each solution (i) is then obtained as the scalar product of the two vectors:
 \begin{equation}{S_i} = \overrightarrow {{s_i}} \cdot \vec q\end{equation}
Each individual weight can assume a value between 0 and 1; however, the primary attributes are dependent on each other, giving the constraint q AEM + q TTG = 1. Therefore, if q AEM is 1, q TTG will be 0 and vice versa. All other weights are independent of each other; thus, the total number of inputs can be reduced to four. Therefore, the optimisation problem involves four input variables and four output objectives.
Weight factor settings by profile

The following subsections outline each element’s function and motivation. A more detailed explanation including the corresponding equations can be found in Ref. (Reference Riedel, Takahashi and Itoh12). The function weights used in the initial study to benchmark the optimised weights are given in Table 1.
3.3.1 Arrival expedition margin (s AEM, q AEM)
The Arrival Expedition Margin (AEM) is an indicator of how much further positive error can potentially be handled by the system, i.e. how much earlier the ownship is able to arrive. In other words, it indicates how close the ownship is already operating to the maximum speed profile. Therefore, a high AEM weight (q AEM) benefits profile changes that occur during earlier stages of FIM operation, but in return can cope with further unexpected errors better.
3.3.2 Time-to-go (s TTG, q TTG)
The time-to-go weight score benefits modifications that occur close to a predefined TTG at which changes should be summarised. Here, this target is set as 60s before the ABP to allow for the maximum time available before a modification takes effect.
3.3.3 Time-to-react (s TTR, q TTR)
The TTR score is used to penalise modifications with short notification times. The penalty is enforced with lead times of shorter than 60s and is maximum for 10s, i.e. when immediate action by the crew is required.
3.3.4 Action point distance (s APD, q APD)
The action point distance is introduced to allow for a sufficient distance between APs to avoid a high frequency of speed commands. In particular, this function penalises speed changes that commence less than 5NM apart from each other.
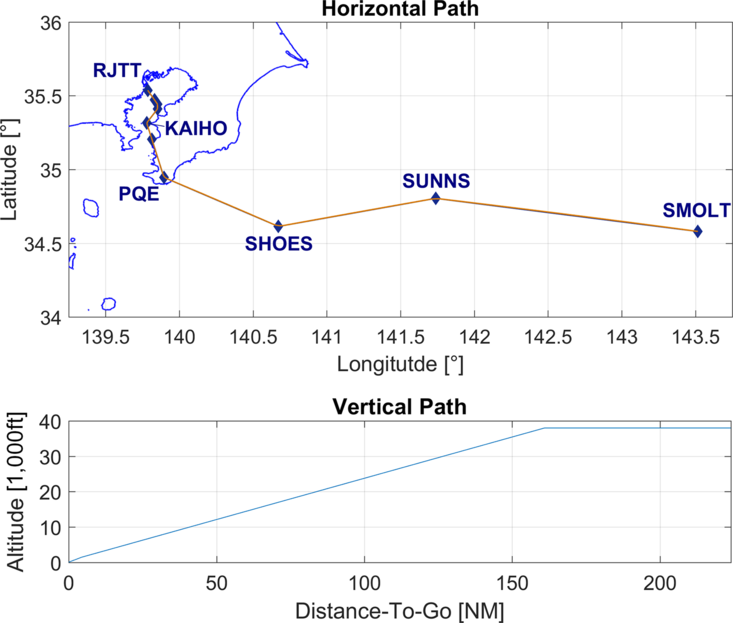
Horizontal and vertical routing of the ownship(Reference Riedel, Takahashi and Itoh12).

3.3.5 Action point type (s Type, q Type)
The type score is a simple, fixed value biased toward existing speed changes; i.e. no penalty is enforced if a modification is made to an existing speed change, while additional decelerations and accelerations will receive a penalty.
4.0 SIMULATION ENVIRONMENT
The simulation environment, i.e. the aircraft type, routing, winds, external spacing error and patterns, is adopted from Ref. (Reference Riedel, Takahashi and Itoh12) for comparison with the original results. Therefore, only an outline of the original settings is provided here, while the differences and settings unique to this study are given in detail.
4.1 Aircraft and calculation model
All the performance calculations in this study were based on EUROCONTROL’s BADA model, version 3.12(20) and MOPS-FIM(3) with standard atmospheric conditions. The aircraft model used for the ownship and traffic was a Boeing 787-8 at reference mass.
4.2 Flight path
The horizontal and vertical flight paths are shown in Fig. 4. The flight originates at waypoint SMOLT and continues to the KAIHO arrival toward the ILS X approach for Runway 34 L at Tokyo International Airport (RJTT). Vertically, the profile is initiated at 38,000ft (FL380) and laid out as a continuous descent approach (CDA) with a fixed geometric flight path angle of −2.2°(Reference Itoh, Fukushima, Hirabayashi, Wickramasinghe and Toratani21,Reference Itoh, Wickramasinghe, Hirabayashi and Fukushima22) . The angle is kept from the top of descent until glide slope capture, from where the descent is continued with −3.0°. Speed constraints were applied below 10,000ft (250Kn), at KAIHO (180Kn) and at the Final Approach Fix (FAF, 150Kn).
4.3 Scenarios and data sets
The original study on IM-SP consists of 147 simulations based on 7 fixed offset scenarios ranging from −30s to +30s in 10-s intervals as well as 5 error patterns with 28 different settings, i.e. 2 amplifications (high or low) and 2 directions (positive or negative) for each of the 7 offsets.
In this study, one new error pattern was taken from the SPICA simulator(Reference Riedel, Takahashi, Tatsukawa and Itoh23), increasing the total number of simulations to 175.
The new pattern is used for various examples throughout this paper (Sections 5.1 and 6.1), and it was included because of its demanding characteristics, introducing a nearly linear progressing error of 10s within the last 30NM.
Besides the full data set (175 scenarios), a reduced optimisation set was added for computation time considerations. This set contains only 18 scenarios, 6 fixed offsets and 6 error patterns in both directions, but only with high amplification and without any initial offset.
4.4 SMPSO
The SMPSO source code used in this study is based on the Multi-Objective Evolutionary Algorithm (MOEA) Framework 2.12 by Dave Hadka(Reference Hadka24). In this implementation of SMPSO, the values of c p and c g are randomised for every particle in every iteration and the probability of a mutation is 1 to 6. In total, 81 particles were simulated for 50 steps each, giving a total 4050 calculations.
5.0 SINGLE ELEMENT ANALYSIS
To facilitate a better understanding of each cost function element’s influence and performance as well as of the results that might be expected from the SMPSO optimisation, a single element analysis was performed by varying only one weight at a time, i.e. keeping the other weights at their default original setting.
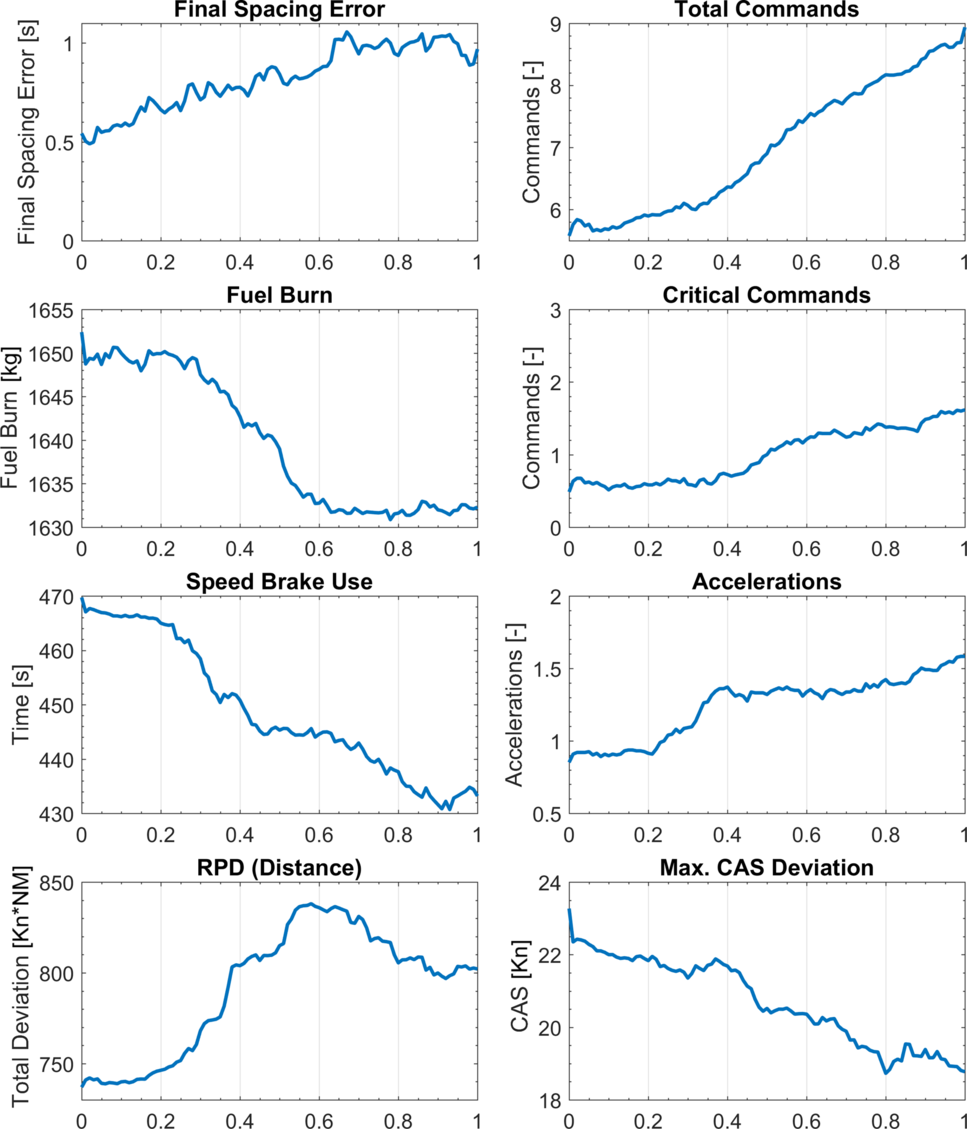
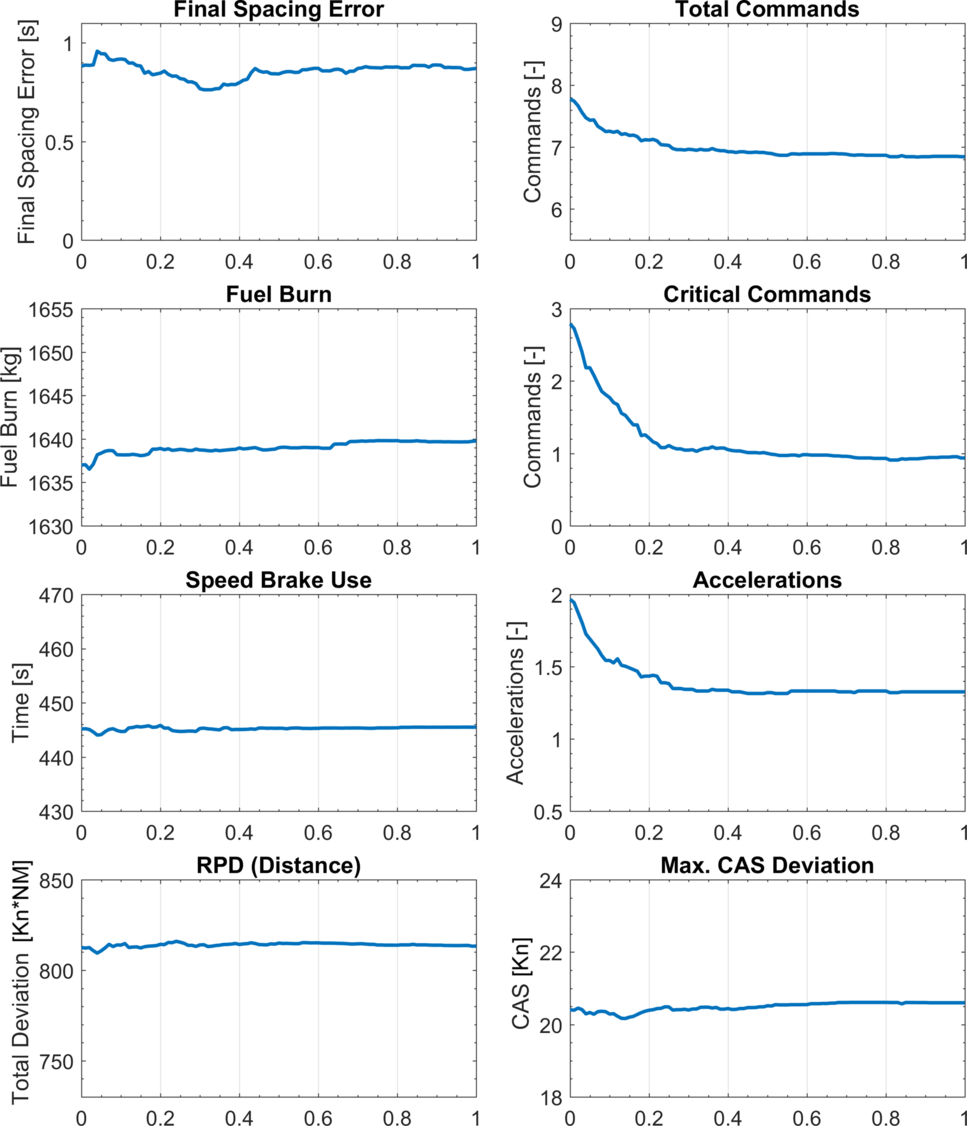
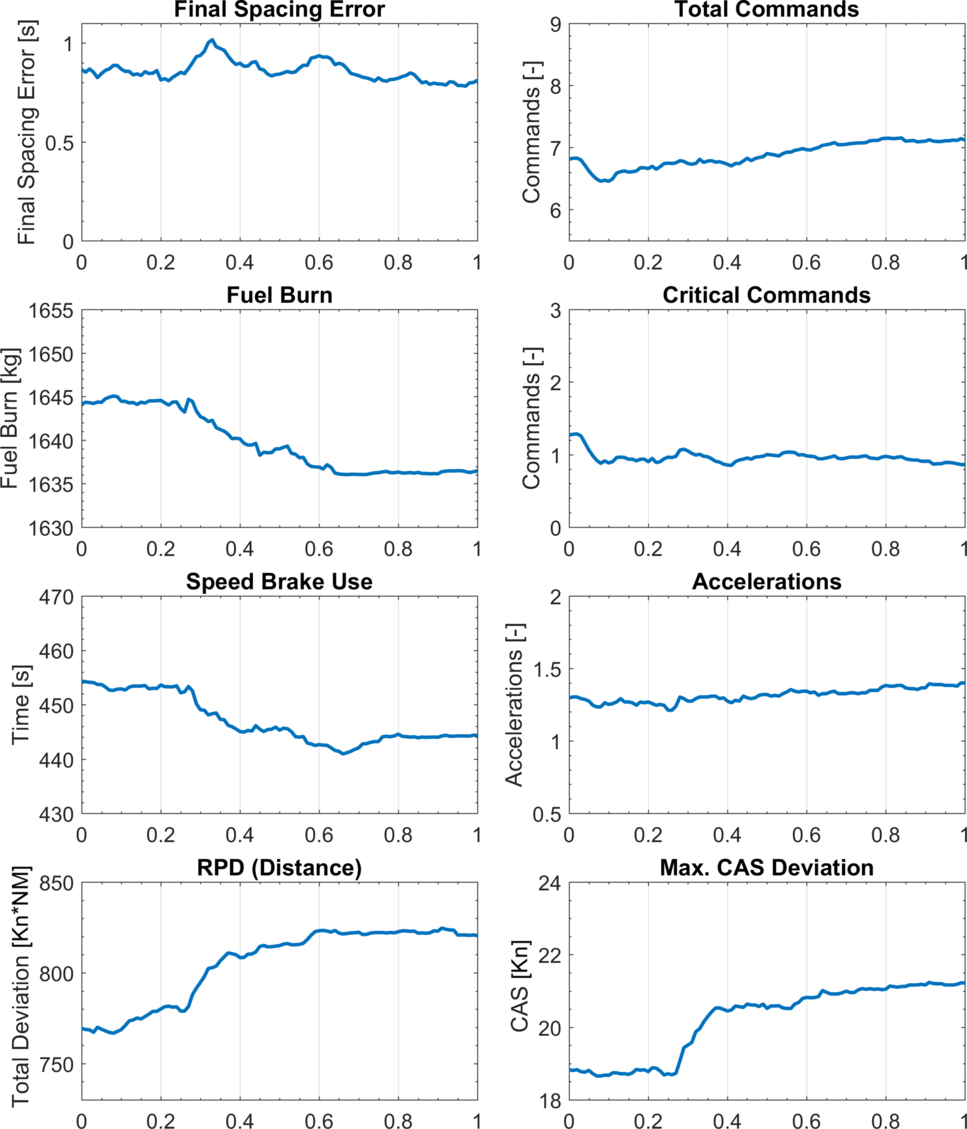
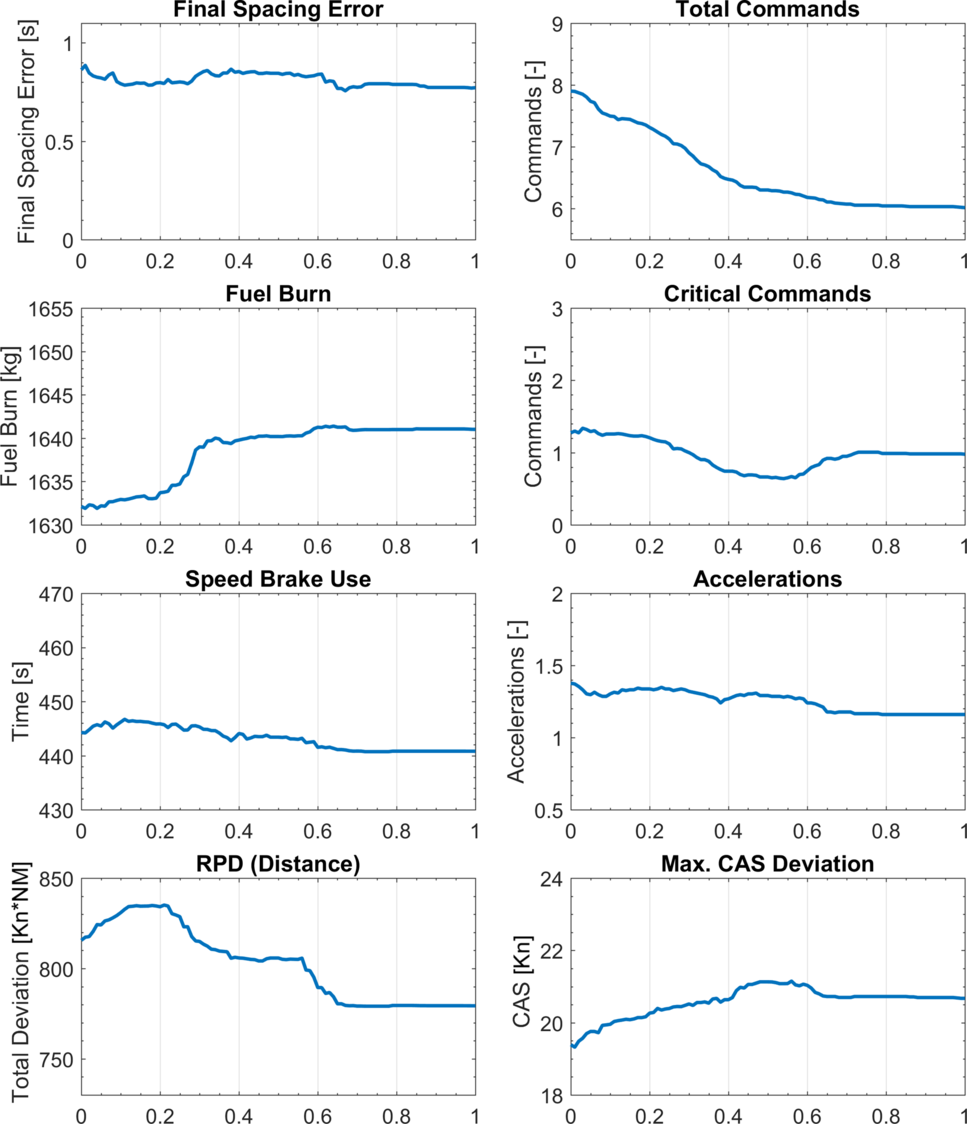
Figures 5–8 show the development of the objective and non-objective parameters (explained in Sections 3.1 and 3.2) for each weight for the full data set. The x-axis represents the element’s weight factor, and the y-axis represents the value of each parameter, shown in the same limits for each figure. The weights have been simulated in the range from 0 (not applied) to 1 (fully applied) in steps of 0.01 units.
5.1. Arrival expedition margin versus time-to-go
The increase in q AEM, and conversely the decrease in q TTG, has a significant effect on all the attributes. In particular, an increasing trend is observed in the final spacing error, number of commands, number of accelerations and RPD. By contrast, a decreasing trend is observed in the fuel burn, speed brake use time and deviation from nominal CAS.
Remarkably, q AEM values lower than 0.25 show fewer commands than the reference profile and have only a minor impact on the fuel burn and speed brake use. However, beyond 0.25, a significant change is observed in these values, especially RPD.
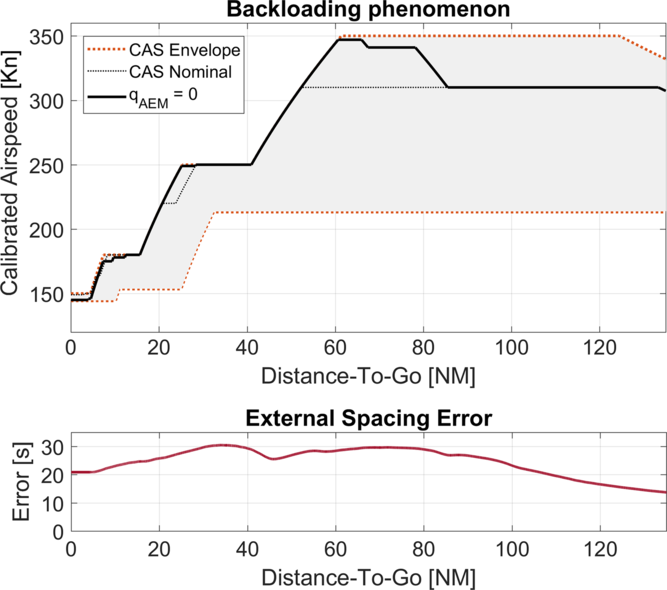
Considering the development of the final spacing error and commands, it can be easily assumed that (if fuel burn was of no concern), a q AEM of 0, i.e. a q TTG of 1, would render the best results for the optimisation problem. However, further investigation of the generated profiles indicates an operationally undesirable phenomenon called ‘backloading’, as shown in Fig. 9.
Overall results dependent on q AEM (x-axis), q TTG given by 1-q AEM.

Overall results dependent on q TTR.

Overall results dependent on q APD.

Overall results dependent on q Type.

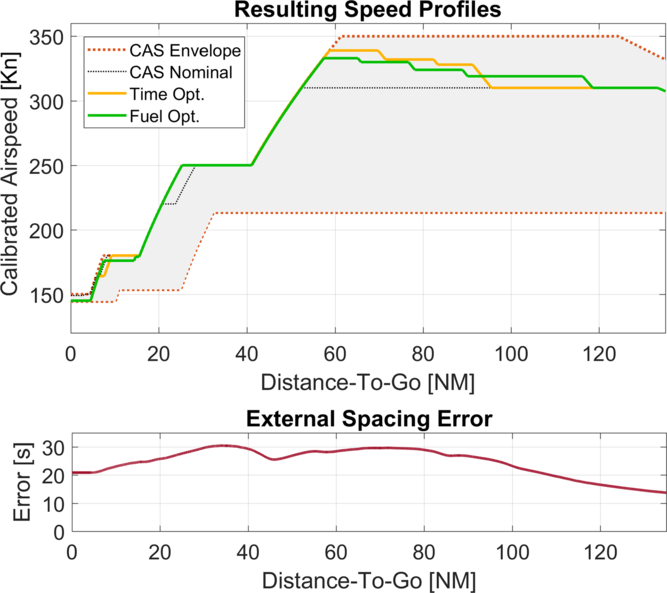
Example of the backloading phenomenon. Upper graph: The ownship’s speed profile within the speed envelope Lower graph: The external spacing error originating from the TTF’s trajectory The x-axis shows the DTG of the ownship, aligned for both graphs, the graph’s left border (0NM) indicates the runway threshold or final position; the right border (130NM) the initial position, at which FIM was commenced. Chronologically, the graph is read right-to-left: 1) At 130NM (initial position), a spacing error of +15s is indicated, meaning that the ownship needs to expedite its arrival by 15s, compared with the originally estimated time. 2) From 130NM until 80NM the error gradually increases to +30s. 3) From 80NM to approximately 30NM the error mostly remains at +30s. 4) From 30NM to 0NM (final position) the error reduces to +20s. This shows that, in hindsight, the ownship would have needed to only shorten its remaining flight time by 20s (compared with the initial estimation) to arrive with no spacing error. Further, it is seen that the TTF slowed down during the last 30NM; Thus, if the ownship had already compensated for +30s at this time, it would now be required to delay its arrival by 10s.

Owing to the characteristics of s TTG, a setting of q AEM = 0 (q TTG = 1) biases the modifications to be summarised and applied to the speed changes during the later flight phases. In the case of an initially high and further developing spacing error (the arrival must be further expedited), the system will try to assume the maximum speed profile, or if it is not sufficient to compensate the error, it will add a single late acceleration that is consequently shorter but has a higher CAS value.
In the example given below, this would cause an initial acceleration from 310Kn to 340Kn at a DTG of approximately 85NM, followed by another acceleration to 347Kn, which is kept for a short distance of 5NM.
The above-mentioned observation was made for q AEM values below 0.3, and it coincides with the sudden rise in RPD as well as the reduction in the fuel burn and speed brake use time, as shown in Fig. 5.
Another problem that arises with such behaviour is that the profile may be saturated, i.e. it may become the maximum speed profile, once the initial deceleration is commenced, and it might not be able to deal with further increasing error. A detailed discussion on this issue is provided in Section 6.1.
Consequently, solutions that incorporate a q AEM of less than 0.3 are disregarded.
5.2 Time-to-react
Figure 6 shows that the TTR penalty portion can suppress commands with short lead times (here, from 2.8 to 1) and reduce the overall commands and accelerations, as intended by its design. Furthermore, a minor reduction in the final spacing error, which is minimised for a q TTR of 0.33, can be observed. Beyond 0.5, all of the above-mentioned attributes stabilise, while none of the others are affected significantly.
5.3 Action point distance
The primary purpose of the APD penalty is to avoid many commands over short distances. While this is not reflected by any of the attributes directly, in Fig. 7 for q APD values starting from 0.25, a sudden increase can be observed in RPD and the maximum nominal CAS deviation, accompanied by a reduction in fuel burn and speed brake use, which supports the bias of the penalty toward fewer but higher-magnitude speed changes, compared with many but small speed changes.
Other noteworthy points include the maximum final spacing error (0.34) and the (local) maxima for total and critical commands for a q APD of 0. Further, a marginal increase is observed in the total commands for higher values of q APD.
5.4 Action point type
The type penalty was introduced to prevent additional speed commands if the same error reduction can be realised by modifications to existing speed changes. As shown in Fig. 8, this is successfully achieved, reducing the total number of commands from 8 to 6 over the range of q Type, with only a minor impact on the final spacing error. Furthermore, it can be seen that the penalty effectively reduces the RPD at q Type values of 0.22 to 0.56. However, a distinct increase in fuel burn is observed for q Type values greater than 0.25.
5.5 Single parameter analysis summary
Two observations can be made from all the graphs.
First, the penalty portions (s TTR, s APD and s Type) perform as intended, i.e. they have only a minor effect on the final spacing error compared with s AEM and s TTG, and they augment the final speed profile for improved characteristics (fewer overall and critical commands).
Second, a reduction in fuel burn is mainly at the expense of more (critical) commands or a higher final spacing error, and vice versa. In other words, the objectives are in conflict with each other and thus require a trade-off solution.
Nevertheless, as the above-mentioned analysis involves only one parameter at a time, potential correlations are not reflected. For example, naturally, a larger number of total commands increases the probability of one of them being a critical command; however, the inverse assumption (many critical commands imply a large number of total commands) cannot be made. Therefore, this analysis should serve only as an indicator of the quality of each weight’s influence and the result to be expected from the multi-objective optimisation described in the next section.
6.0 MULTI-OBJECTIVE OPTIMISATION RESULTS
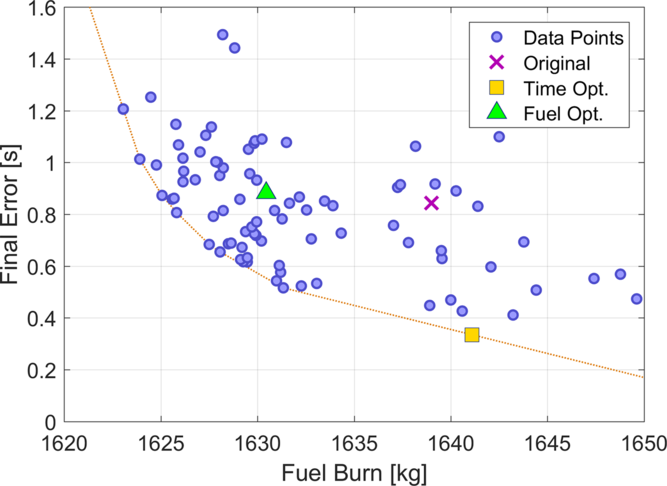
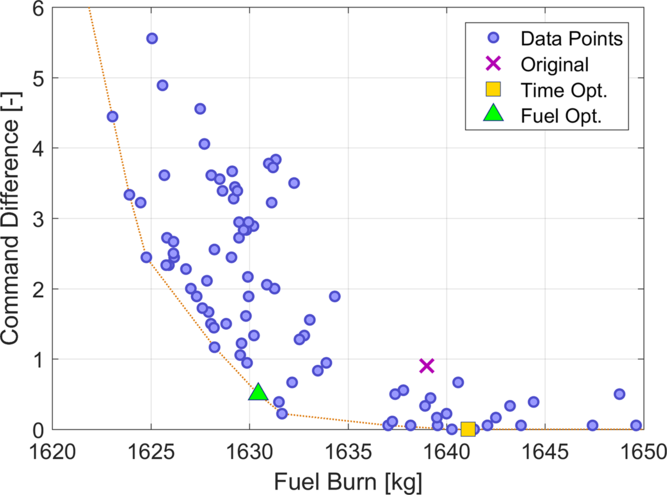
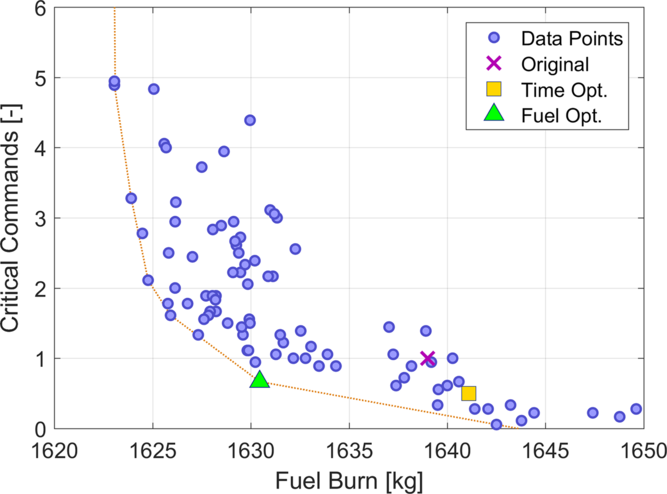
By incorporating all four objectives, SMPSO rendered a total of 87 potential solutions for the optimisation problem. As noted in Section 5.5, there is a possible trade-off scenario between the fuel burn and the other objectives. Therefore, Figs. 10–12 show scatter plots of all the solutions, with the fuel burn shown on the x-axis and the final error, command difference and number of critical commands shown on the y-axis. The axis limits have been selected to include all the solutions. The Pareto front for each combination is shown in each figure, and it is linearly interpolated and extrapolated.
Optimisation results – final error versus fuel burn.

Optimisation results – command difference versus fuel burn.

Out of the 87 possible solutions, 2 solutions that are situated at two out of three Pareto fronts stand out. These solutions neither increase the number of total or critical commands by one nor have a final error higher than 1s. In the following, these two solutions are referred to as the ‘time optimal’ and ‘fuel optimal’ solutions, respectively.
The ‘time optimal’ solution (TOpt), which is the global best solution in terms of the final spacing error and command deviation, yields reduced critical commands, albeit at the expense of a slightly higher fuel burn.
The ‘fuel optimal’ solution (FOpt) is a trade-off between the fuel burn and the command deviation, critical commands and final spacing error, which is comparable to that of the original setting.
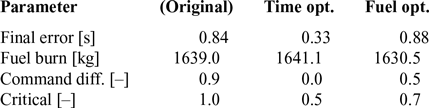
The detailed results are presented in Table 2, and the corresponding weight factors are listed in Table 1. Note that the values for TOpt and FOpt shown in Table 2 and Figs. 10–12 correspond to the results of the reduced optimisation set as described in Section 4.3. A detailed comparison showing the results of the full data set is given in Section 6.2. The original setting results, shown for reference, are always based on the full data set.
Objective function results by profile

Optimisation results – critical commands versus fuel burn.

In Figs. 10–12, the original weight results are indicated by a purple ‘x’ mark, TOpt is shown by a yellow square and FOpt is marked with a green triangle. The same colour coding is used in all the following graphs.
6.1 Speed profile characteristics
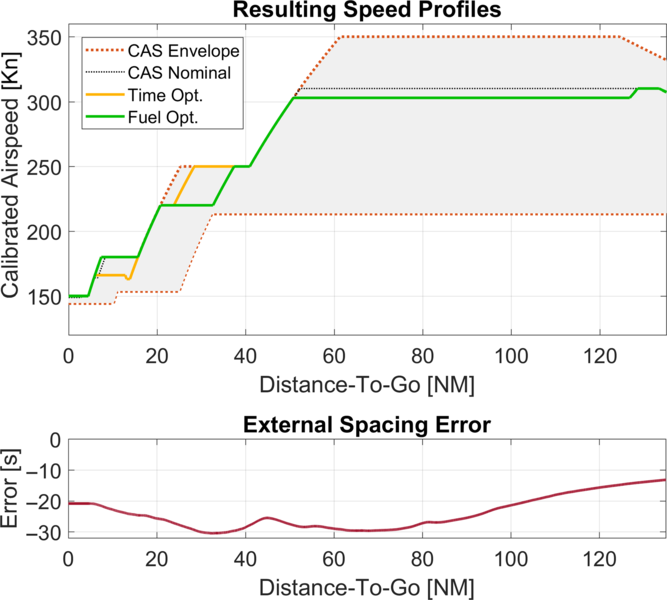
Figures 13 and 14 show two examples for comparing the resulting speed profiles generated by TOpt and FOpt. Figure 13 shows an example of an initially positive and increasing spacing error, identical to the one shown in Fig. 9.
Profile comparison for both settings with an initial positive error.

Profile comparison for both settings with an initial negative error.

The profile generated by TOpt uses fewer commands and commences its initial acceleration at a later time (DTG, 94NM), albeit with higher speed magnitudes.
By contrast, the profile generated by FOpt reacts to the initial spacing error with an earlier acceleration (119NM), resulting in more but smaller speed steps and giving a lower top speed that contributes to the lower fuel burn. In the latter half (<60NM), the speed profiles are nearly identical, with a small difference for the final or next-to-final deceleration.
In the second example (Fig. 14), the same error profile is used, but in the opposite direction with a corresponding negative initial spacing error. Both settings react with the same initial deceleration. However, FOpt adjusts to the further development of the spacing error by expediting the deceleration from 250Kn to 220Kn, while the profile generated by TOpt remains on the nominal profile and reduces the next deceleration from 220Kn to 180Kn to a lower target CAS.
In summary, it can be seen that FOpt, using a higher qAEM, reacts earlier to changes in the spacing error, while TOpt reacts later.
Depending on the progression of the error, this makes TOpt more susceptible to errors progressing in the same direction, e.g. a positive error that increases, than FOpt. This is also reflected by the final spacing error distribution of the full data set shown in Section 6.2.
By contrast, for an error that changes in direction or cancels itself, e.g. a positive error that decreases (or vice versa, as shown in Figs. 13 and 14), TOpt reacts later and has more time to combine or revert previous changes, thus resulting in fewer overall commands.
However, in rare cases, i.e. if all other options have been exhausted, the late reaction also increases the potential for reversals, i.e., a deceleration immediately followed by an acceleration (as seen in Fig. 14), to compensate for the change in the spacing error.
6.2 Full data set results
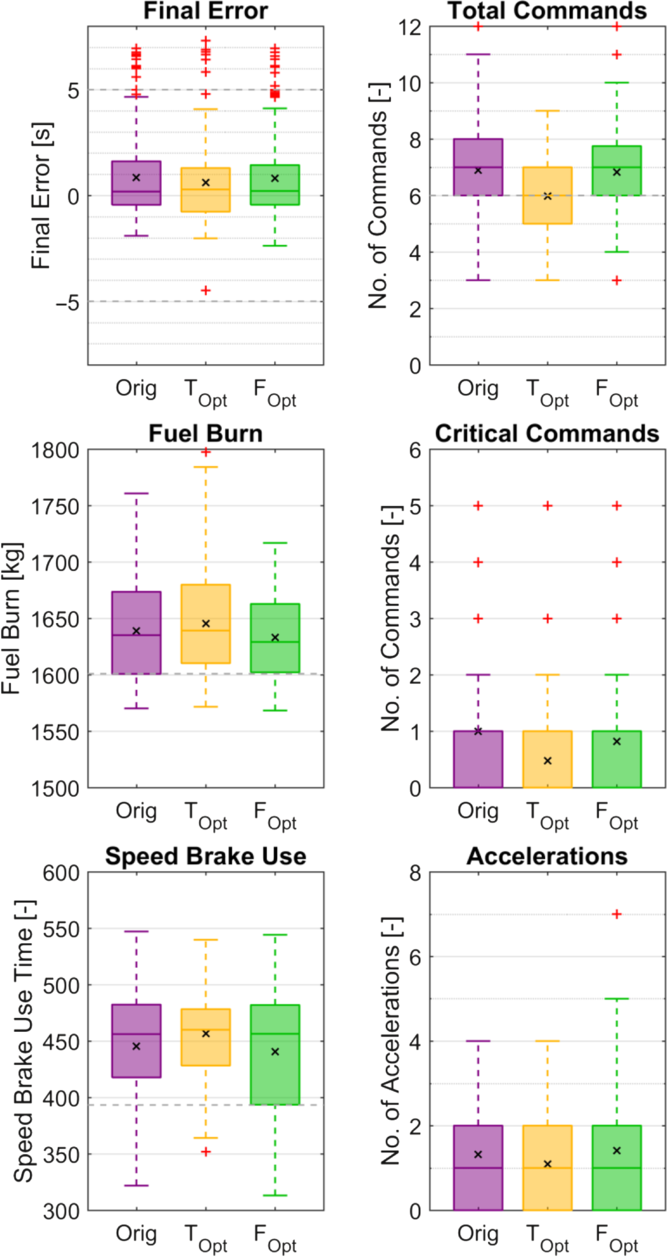
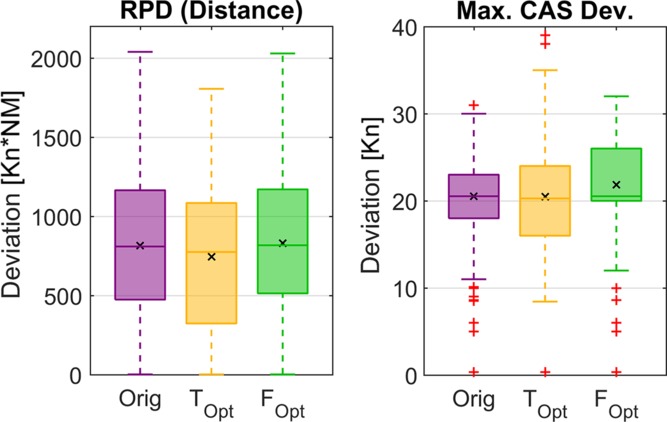
The results for the full data set, including all 175 scenarios, are shown as boxplots in Figs. 15 and 16 and summarised in Table 3. The boxplots are drawn according to the Tukey convention and grouped by the weight factor setting: Original (Orig.), TOpt and FOpt. The outliers are indicated with red ‘+’ marks, the mean values are indicated by a black ‘x’ mark and reference or target values, where applicable, are indicated by a grey dashed line.
Box plots for each parameter by setting.

Box plots for each parameter by setting (continued).

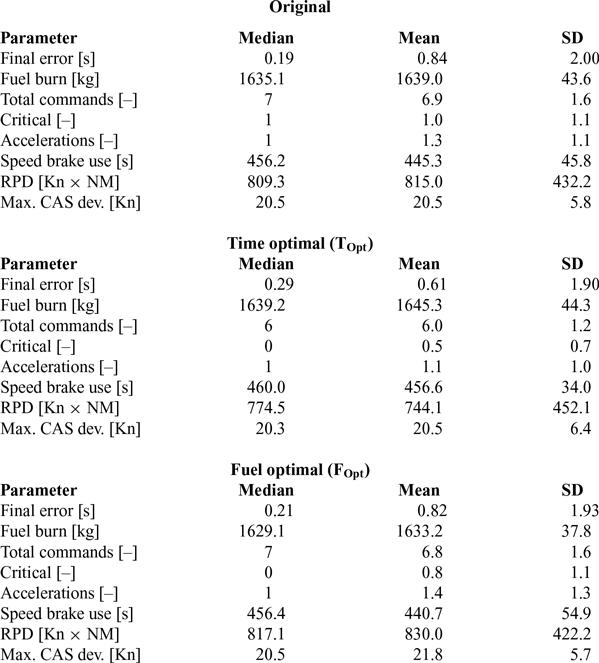
Median, mean and standard deviation values for each parameter by setting

6.2.1 Objective parameters
As estimated, TOpt gives the best results for the average final spacing error with 0.61 ± 1.90s, compared with the original settings with 0.84 ± 2.00s. Compared with the results of TOpt for the optimisation data set (0.33s), an increased final spacing error can be observed. However, this can be attributed to the fact that the full data set includes the initial spacing errors from –30s to +30s for all scenarios. Given that the reference profile offers a much greater margin to respond to a negative error than to a positive error, together with the previously described tendency of TOpt to react to error changes later, a slightly higher result is obtained. Considering the outliers and extrema of TOpt (–4.49s, +7.31s), this becomes even more apparent.
Notably, FOpt rendered a final spacing error of 0.82 ± 1.93s, which is slightly better than the result of the optimisation data set (0.88) and marginally better than the result of the original setting.
In terms of fuel economy, FOpt causes an average fuel burn of 1633.2 ± 37.8kg. Compared with the original setting (1639.0 ± 43.6kg), this is a notable improvement in terms of absolute fuel burn and consistency. However, TOpt shows an increased consumption at 1645.3 ± 44.3kg. This difference in fuel burn for TOpt and FOpt can be attributed to the higher maximum speed of TOpt-generated profiles, as shown in Fig. 13, which results in higher drag; thus, more thrust is required to maintain the current airspeed.
Note that during FIM operation, the aircraft will have to deviate from the nominal speed profile; thus, increased fuel consumption is often inevitable. Nevertheless, keeping additional cost to a minimum is highly desirable from an operator’s perspective and certainly conductive to FIM acceptability.
During the development of IM-SP, the reduction of (additional) FIM-based speed commands was strongly emphasised compared with other FIM logics(Reference Abbott7). Ideally, the number of commands should match those of the reference profile (here, 6).
With the TOpt setting, this is the case, with a value of 6.0 ± 1.2 commands and a median of 6 commands, implying that no additional speed changes were needed on average.
FOpt gives a result of 6.8 ± 1.6 commands compared with the 6.9 ± 1.6 commands of the original setting. From the corresponding boxplot, a minor improvement can be detected. Both settings give a median of 7 commands; i.e. one additional command is required for FIM operation.
The critical commands are also improved for both settings, i.e. 0.5 ± 0.7 for TOpt and 0.8 ± 1.1 for FOpt, both with a median of 0, compared with 1.0 ± 1.1 with a median of 1 for the original setting. This means that on average, a single immediate action is required per flight (FOpt) or every second flight (TOpt).
However, from the boxplot, it is clear that for demanding scenarios, i.e., with fast changing errors, multiple critical commands cannot be avoided without jeopardising spacing performance.
6.2.2 Other parameters
Starting with the number of accelerations, TOpt shows the lowest results at 1.1 ± 1.0, followed by the original setting at 1.3 ± 1.1 and FOpt at 1.4 ± 1.3. The boxplot also shows a higher outlier and whisker for FOpt. However, a large number of accelerations is not to be mistaken for large magnitudes of accelerations. An inspection of the profile with seven accelerations shows that these are composed of a set of four consecutive accelerations (similar to Fig. 13) and a set of three consecutive accelerations, with only one reversal.
The average speed brake use time, which is 445.3 ± 45.8s for the original setting, increased to 456.6 ± 34.0s for TOpt owing to its higher maximum speeds (Fig. 13). By contrast, for FOpt, it decreased to 440.7 ± 54.9s. Thus, FOpt is the ‘cleanest’ setting in terms of both fuel and noise. However, it must be noted that, counterintuitively, the highest average renders the smallest standard deviation (and vice versa).
Finally, it can be observed that TOpt renders the smallest RPD but highest absolute nominal CAS deviations, which are caused by the shorter but higher-magnitude CAS changes as discussed in Section 6.1. The highest deviations recorded are 37Kn and 39Kn, as marked by the outliers. FOpt has a slightly higher RPD than the original setting and the overall highest average maximum CAS deviation. The latter might have also been influenced by the high values of qAPD and qType.
7.0 DISCUSSION
7.1 ‘Optimal’ weight setting
Owing to the four-dimensional objective function, especially the trade-off between the fuel burn and the other objectives, multiple solutions exist, i.e. it is not possible to identify one ‘optimal’ weight. Nevertheless, it has been shown that the original cost function setting could be improved.
In a real-world scenario, and especially if further settings along the Pareto fronts are discovered, flight-by-flight selection of the settings could be considered according to the current priority (e.g. time versus fuel burn), comparable to the selection of the cost index.
When limiting the options to TOpt and FOpt and from a strictly numerical perspective, TOpt shows better results for six out of eight parameters, making it the best setting.
Nevertheless, it can be argued that the relative improvement of 0.2s in the spacing error, 1 command and 0.5 critical commands, or one critical command every second flight, of TOpt over FOpt justifies an increased fuel burn of 12kg. While the difference in the spacing error is barely detectable for a human operator, the additional commands increase the workload; however, one additional command, especially during the early phases of FIM operation (as expected for FOpt) is reasonable. Further, considering the outliers for the spacing error and maximum CAS deviation, it can be seen that TOpt results in more extreme values, indicating higher instability or susceptibility to running out of an adjustment margin.
Therefore, by interpreting the results and accounting for the above-mentioned operational aspects, FOpt is recommended.
7.2 Synergy of high q AEM and penalty functions
As shown in Section 5.1. and Fig. 5, a q AEM of 0.76 was expected to cause an average of 8 commands; however, FOpt showed only 6.8 commands. As the critical commands were also reduced (1.3 versus 0.8), this is an indication that the penalty functions were able to successfully alleviate the negative effects of a high q AEM.
This effect becomes even more obvious in the scenarios with the command outliers, which was basically limited to error patterns with rapidly increasing or changing errors. Here, the higher q AEM would trigger an earlier reaction, possibly resulting in multiple commands in rapid succession. However, similar to the behaviour shown in Fig. 13, the suppressive characteristic of the penalty functions limited the system to have at least 60s between commands, which satisfied the request by the pilots who participated in the flight test in Ref. (Reference Baxley, Swieringa, Wilson, Roper, Hubbs, Goess and Shay10) to have no more than one command per minute.
7.3 Approach design
As an extension of a previous study, this study used FIM during a continuous descent approach. Depending on the airport or region, CDAs are not commonly used or limited to times of low traffic (e.g. night-time), where FIM might not be a factor. Therefore, in a future study, we will also examine the behaviour for idle descents or stepped approaches. Nevertheless, it is also important to consider the compatibility of CDA and FIM operation, which, given the results of this study and previous studies, is feasible albeit more demanding.
Further, compared with other approaches, here, the FAF is rather late and the ABP would usually be selected at the FAF or even earlier. However, as the spacing minima and RTA are measured at the runway threshold, any difference between the speed of the ABP and the final approach speed at runway threshold would affect the actual spacing performance. Therefore, it was decided to have them closer to the runway. Nevertheless, this pertains to all FIM logics, and future studies will also include simulations with earlier ABPs and different final approach speeds.
7.4 Future research tasks
In follow-up studies, the above-mentioned settings should also be tested with different error inputs or under different parameters to determine whether the recommendation of FOpt holds true. From a different perspective, an investigation on how much the maximum tolerable final spacing error (1s in Section 6) would need to be increased to reduce the other parameters to even more desirable values is also of interest.
Other important aspects to consider are the string stability, i.e. the behaviour of multiple IM-SP-based FIM aircraft in a chain, and the evaluation of the settings in a human-in-the-loop environment. As mentioned in Section 7.1, numerical differences do not necessarily reflect subjective experience, and one setting might produce profiles that are ‘easier to fly’ than another.
Furthermore, this study considered only the cost function weights while ignoring the scoring function itself. The addition of another scoring or penalty function or the optimisation of the internal settings could further improve the system’s performance and usability.
8.0 CONCLUSION
In this study, interval management – speed planning, a newly proposed logic for FIM, was further analysed and optimised in terms of its cost function weight factors using SMPSO. The results showed that the weight factor settings have a significant influence on crucial objectives such as the spacing performance, fuel burn and number of commands. Further, it was shown that undesired behaviours such as high-frequency or additional speed commands can be alleviated by the penalty functions. The two settings obtained from the SMPSO optimisation allowed for further improvement, either in the spacing performance and commands or in the fuel burn, depending on the priority. Finally, the fuel optimal setting, which combines favourable aspects from both a pilot’s and an operator’s perspective, was recommended, which is expected to further increase the acceptance and quality of IM-SP.