I. INTRODUCTION
An AC powder electroluminescence (ACPEL) device is operated by applying a high electric field to phosphor. Since an ACPEL device can be made using a screen-printing method on a flexible substrate, it has been used as a backlight of mobile phones and personal digital assistants (PDAs) because of its flexibility, uniform light emission, and low power consumption.Reference Neyts1
The basic ACPEL mechanism is explained by the trapping and recombination of electrons and holes. When a high electric field is applied, electrons and holes are formed by the p–n junction of n-type ZnS and p-CuxS. The injected electrons are trapped by shallow donor centers such as CuxS-related defects, and the injected holes are trapped by recombination centers such as Cl− ions. When the field is changed, an emission is generated by the recombination of electrons and holes.Reference Fisher2
Until now, ACPEL emission has been only shown in ZnS-based phosphors such as ZnS:Cu,Cl phosphor, which shows blue-green emission depending on the concentration of Cu, and ZnS:Cu,Cl,Mn phosphor, which shows orange or white emission depending on the concentration of Mn and Cu.Reference Neyts1, Reference Park, Lee, Kim, Kwon, Park and Han3 However, a red emission has yet to be reported. To overcome this problem, red photoluminescence (PL) phosphors such as CaS:Eu, Ca2Si5N8:Eu, Y2O2:Eu, and ZnS:Mn,Te have been used.Reference Park, Kim, Yoo, Shin, Kim and Choi4–Reference Xianqing, Takashi, Hiromasa and Ken-Ichi7 Among them, ZnS:Mn,Te has been known as a phosphor that shows a 650-nm red PL emission through the excitation of 365-nm UV light and a 650-nm red thin film electroluminescence (TFEL) emission.Reference Benalloul, Benoit, Geoffroy, Yebdri, Bilewicz, Busse, Gumlich and Rebentisch8
Therefore, we want to develop a red ACPEL phosphor by the combination of ZnS:Mn,Te and ZnS:Cu,Cl,Mn because ZnS:Mn,Te is a good red PL phosphor and ZnS:Cu,Cl,Mn is a good EL phosphor. In addition, this paper proposes the PL and EL mechanisms.
II. EXPERIMENTAL
ZnS:Cu,Cl,Mn,Te phosphor was synthesized using a conventional wet synthesis and sealed vessel method.Reference Park, Im, Chung, Seo, Ahn and Jeon9 During the first firing step, the conventional wet synthesis method was used to fabricate ZnS:Cu,Cl phosphor, which has 20–30 μm size particles.Reference Park, Lee, Kim, Kwon, Park and Han3 During the second firing step, Mn and Te were doped and fired at 1100 °C for 3–6 h using a sealed vessel method to avoid the contamination of Mn and Te due to their sensitivity to hydrogen and oxygen during the firing step. After the milling process, which enhances the CuxS-related phase, the second fired mixture was added with Cu and fired at 750 °C for 2 h for a hexagonal to cubic phase transition. The phosphor was then washed with a KCN solution and distilled water and dried at 80 °C for 5 h. Each step has its own purpose. The first firing was used to form ZnS:Cu,Cl, which has 20–30 μm size particles. The second firing is used to produce a red PL emission by doping Mn and Te. Finally, the third firing is used to make a red ACPEL emission through the hexagonal to cubic phase transformation.
An ACPEL device was fabricated through a conventional screen-printing method. The PL and decay curves were characterized at room temperature using a DARSA PRO 5100 PL system (Professional Scientific Instrument Co., Seoul, Korea) with a xenon lamp. An Mn K edge extended x-ray absorption fine structure (EXAFS) measurement was carried out at the Pohang Accelerator Laboratory, Pohang, Korea. The EL spectrum was recorded using an optical fiber and DARSA PRO system while the EL devices were operated with an AC bias voltage of 100 V and frequency of 400 Hz. The luminance was measured using a BM-7 Luminance colorimeter (TOPCON, Tokyo, Japan). The crystal structures of the prepared samples were analyzed through x-ray diffraction (XRD) using an x-ray diffractometer [Rigaku, Tokyo, Japan, D/max-IIIC (3kw) with Cu-Kα (λ = 1.5406Å) at 40 kV and 45 mA]. To confirm the existence of CuxS and CuxTe, an FT-Raman from Bruker (IFS 66 FRA) 106 was used.
III. RESULTS
A. PL property of ZnS:Cu,Cl,Mn after the second firing
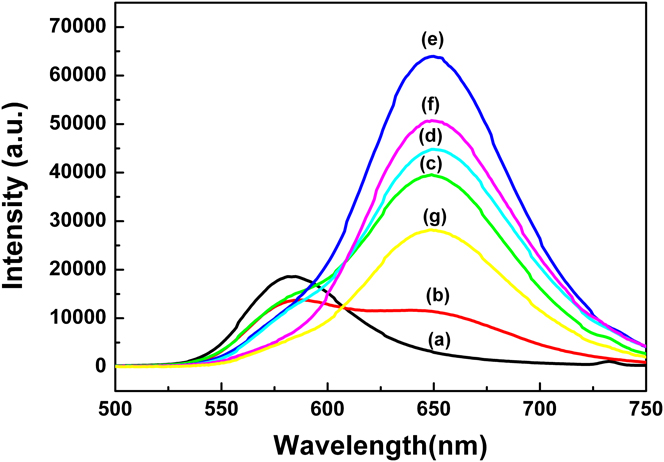
While the concentration of Mn was fixed at 3 wt%, various concentrations of Te were doped into the ZnS:Cu,Cl phosphor during the second firing step to investigate the effect of Te on the PL. As shown in Fig. 1, below 0.5 wt%Te, an orange (∼588 nm) emission decreases and a red (∼650 nm) emission increases as the concentration of Te increases. However, above 0.5 wt%Te, the orange emission disappears and only the red emission exists. The 0.5 wt%Te-doped ZnS:Cu,Cl,Mn,Te phosphor shows a maximum red emission.
Photoluminescence (PL) spectra of ZnS:Cu,Cl,Mn,Te phosphors after the second firing according to the Te concentration (at 3 wt%Mn): (a) 0 wt%Te, (b) 0.01 wt%Te, (c) 0.05 wt%Te, (d) 0.1 wt%Te, (e) 0.5 wt%Te, (f) 1 wt%Te, and (g) 2 wt%Te.

B. The origin of red PL emission
It is well known that the orange emission of ZnS:Mn phosphor originates from the 4T1–6A1 transition of Mn2+ ions.Reference Parrot, Naud and Gendron10 That is, the orange emission is due to Mn2+ ions surrounded by S2− ions. However, the red emission must be related to Te2− ions in ZnS:Cu,Cl,Mn,Te phosphor since it appears as soon as Te is doped. The doping of Te has a nephelauxetic effect on Mn2+ ions and shifts an orange emission to a red emission because the ionic radius of Te (≅2.1 Å) is larger than that of S (≅1.84 Å).Reference Zhang, Zeng and Su11
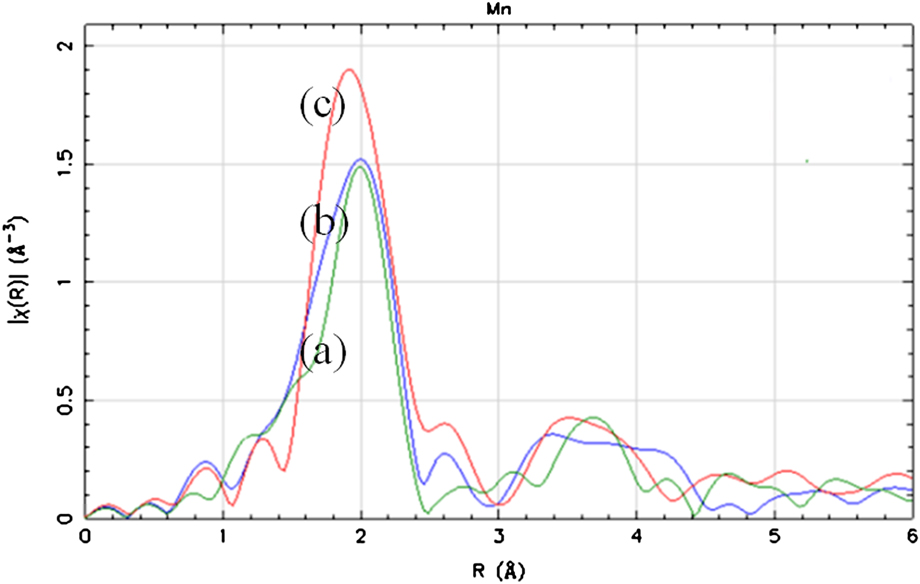
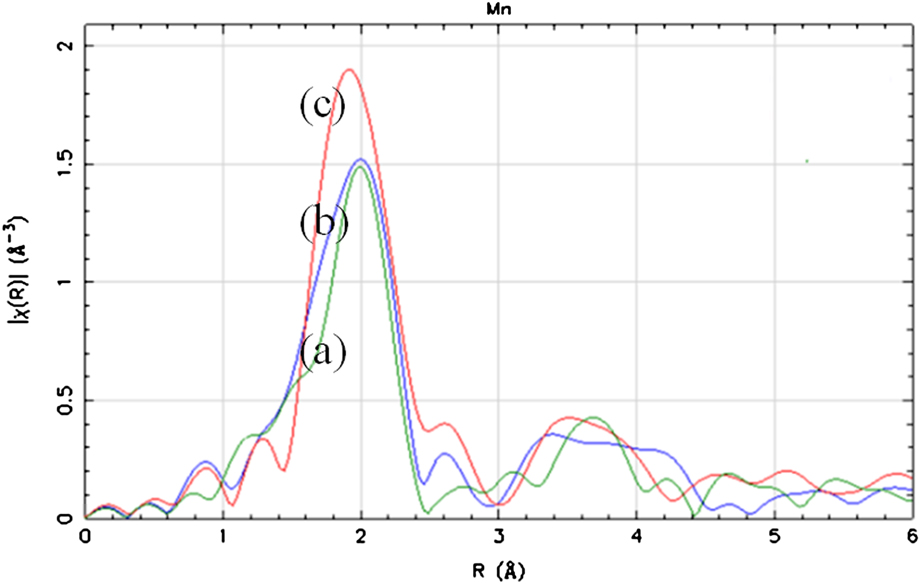
To investigate how Te2− ions affect the local structure of Mn2+ ions, an Mn K edge EXAFS analysis was conducted. The interatomic distance of Mn–S, Mn–Te, and Mn–Zn are 2.172, 2.732, and 3.825 Å, respectively.Reference Soo, Ming, Huang and Kao12, Reference Happo, Sato, Mihara, Mimura, Hosokawa, Ueda and Taniguchi13 As shown in Fig. 2, a peak of about 2.7 Å appears and increases as the concentration of Te increases. This means that Te2− ions are located at the nearest neighboring site of Mn2+ ions and have an effect on their local structure. Thus, the origin of the orange and red emissions must be from the Mn2+ ions, which are surrounded by S (Mn[S2−]) and Mn2+ ions, which are themselves surrounded by Te (Mn[Te2−]).
Mn K edge extended x-ray absorption fine structure spectra according to the concentration of Te (at 3 wt%Mn): (a) 0.05 wt%Te, (b) 0.5 wt%Te, and (c) 2 wt%Te.
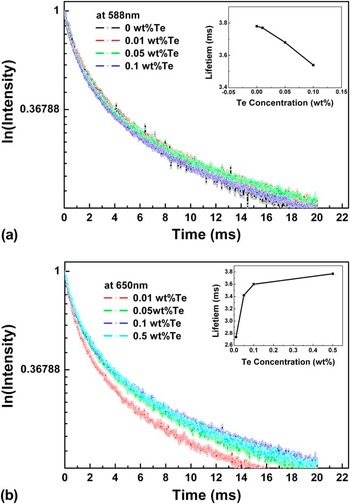
Even though the concentration of Te is relatively small compared with that of Mn, 0.5 wt%Te- and 2 wt%Mn-doped ZnS:Cu,Cl,Mn,Te phosphor shows only a red emission. If Mn and Te are assumed to be homogeneously distributed throughout the phosphor, there should be an orange emission from Mn[S2−] and a red emission from Mn[Te2−] since the amount of Te is not sufficient to change the local crystal field of all Mn2+ ions. However, the phosphor does not show an orange emission. This implies that there must be some type of relationship between them. The decay curves and measured life times were recorded at 588 and 650 nm as a function of the Te concentration. The orange emission shows a nonexponential decay, which consists of fast and slow decay. This means that the fast and slow decay originate from the separate Mn[S2−] ions and the energy transfer among them, respectively.Reference Li and Wang14, Reference Sohn, Park, Kim and Park15 The red emission also shows a nonexponential decay. This implies that the fast and slow decay originate from the Mn[Te2−] ions and the energy transfer from the Mn[S2−] ions to the Mn[Te2−] ions. The measured decay time of the orange emission decreases as the concentration of Te increases, whereas the measured decay time of the red emission increases as the concentration of Te increases, as shown in the inset of Fig. 3. This also supports the energy transfer from the Mn[S2−] ions to Mn[Te2−] ions.
Decay curves and measured lifetimes of ZnS:Cu,Cl,Mn,Te according to the concentration of Te (at 3 wt%Mn) at (a) 588 nm (orange emission) and (b) 650 nm (red emission).

C. EL property of ZnS:Cu,Cl,Mn after the third firing
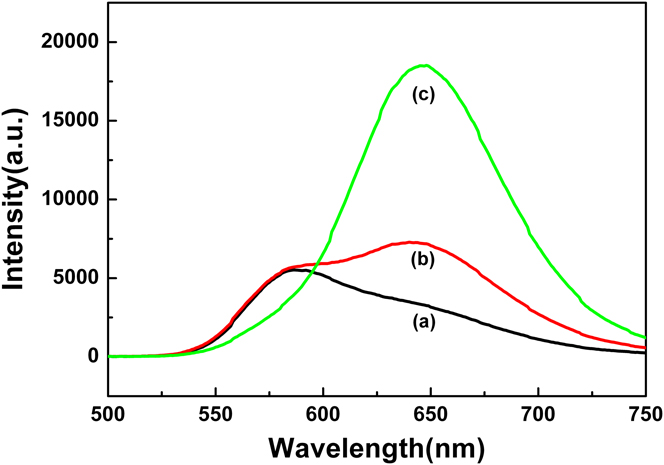
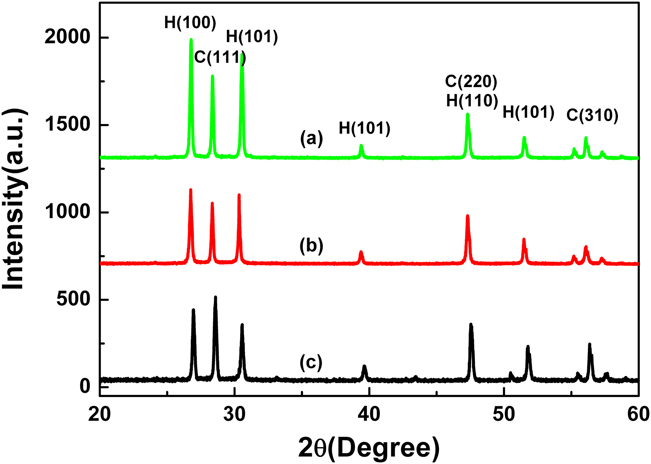
After the third firing with Cu metal, 0.05 wt%Te-doped ZnS:Cu,Cl,Mn,Te phosphor shows almost an orange PL emission, whereas 0.1 wt%Te-doped phosphor shows a minor orange PL emission and a major red PL emission, as shown in Fig. 4. However, 0.5 wt%Te-doped phosphor shows only a red PL emission. The red emission has decreased compared with the second fired phosphors. It is known that a red emission is more stable when ZnS has a hexagonal phase.Reference Smirnova and Pron16 Figure 5 shows the XRD results of 0.5 wt%Te-doped phosphor after the second firing, after 1-h milling, and after the third firing with 5 wt%Cu metal. After the third firing, a hexagonal phase was changed to a cubic phase. That is, the decrease in red emission must be mainly due to a hexagonal to cubic phase transition and partly due to the contamination of Te during milling and the third firing even though the milling process was done in an Ar-purged glove box and the heat treatment was done in a sealed vessel.
PL spectra of ZnS:Cu,Cl,Mn,Te phosphors (at 3 wt%Mn) after the third firing with 5 wt%Cu metal according to the concentration of Te: (a) 0.05 wt%Te, (b) 0.1 wt%Te, and (c) 0.5 wt%Te.

X-ray diffraction (XRD) spectra of ZnS:Cu,Cl,Mn,Te phosphor (a) after second firing, (b) after 1-h milling, and (c) after the third firing with 5 wt%Cu metal.

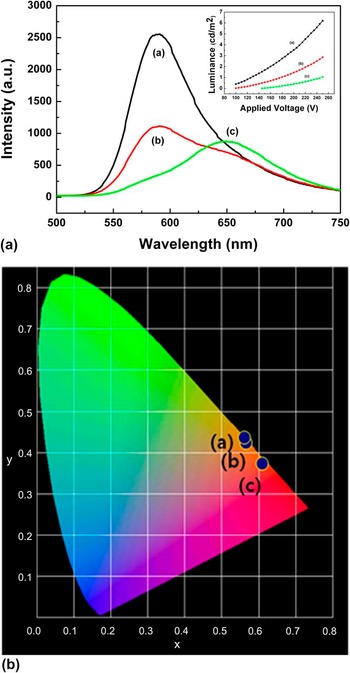
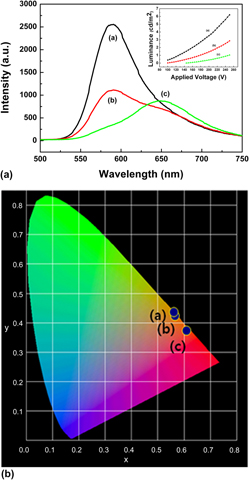
EL devices have been fabricated by adopting these phosphors. After analyzing the luminance, it decreased as the concentration of Te increased as shown in the inset of Fig. 6. EL spectra were measured to determine the reason. As shown in Fig. 6, each phosphor has orange and red EL emissions. The orange emission decreased with the concentration of Te, whereas the red emission hardly changed. However, the International Commission on Illumination (CIE) color coordinates changed from orange to red regions as shown in Fig. 6.
Electroluminescence spectra and CIE color coordinates of ZnS:Cu,Cl,Mn,Te phosphors (at 3 wt%Mn) after the third firing with 5 wt%Cu metal according to the concentration of Te: (a) 0.05 wt%Te, (b) 0.1 wt%Te, and (c) 0.5 wt%Te.

As mentioned previously, an orange ACPEL emission from ZnS:Cu,Cl,Mn originates from the CuxS–ZnS p–n junction. However, the origin of the red ACPEL emission from ZnS:Cu,Cl,Mn,Te has not been discussed. The red ACPEL emission could be generated from CuxS–ZnS or CuxTe–ZnS p–n junction. In the former case, electrons from CuxS-ZnS could impact the Mn2+ ions, which are surrounded by Te2− ions, and the red ACPEL emission is dependent on the CuxS phase. On the other hand, electrons from CuxTe-ZnS could impact the Mn2+ ions in the latter case, and the red ACPEL emission is a function of the CuxTe phase. If the former case is true, the ratio of orange and red PL emissions should be the same as that of orange and red ACPEL emissions as Te only affects the local crystal field of Mn2+ ions and shifts an orange emission to a red emission. When one looks at EL and PL spectra of 0.1 wt%Te-doped phosphor, the orange emission is bigger than the red emission in the ACPEL, whereas the red emission is bigger than the orange emission in PL.
D. Validation of the relationship between CuxTe phase and red ACPEL emission
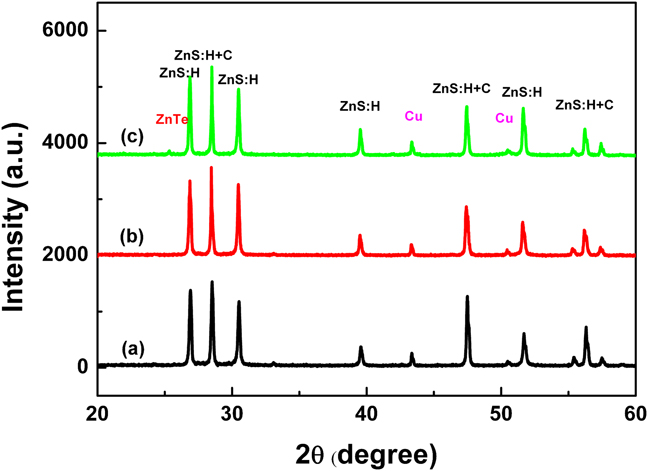
To confirm the relationship between CuxTe phase and the red ACPEL emission, the existence of a CuxTe phase was first investigated through XRD analysis. As shown in Fig. 5, a CuxTe-related peak is not found in 0.5 wt%Te- and 5 wt%Cu-doped phosphor, and only ZnS-related peaks are found. Since it is believed that 0.5 wt%Te is too slight to be detected through XRD, 3, 6, and 10 wt%Te-doped phosphors were synthesized. Figure 7 shows the results of XRD analysis for these phosphors. However, even though the concentration of Te is sufficiently high, a CuxTe-related peak is also not found. That is, a CuxTe-related phase is not easily formed through this method, and thus the luminance of the device must be relatively low, as shown in the inset of Fig. 6.
XRD spectra of ZnS:Cu,Cl,Mn,Te phosphors (at 3 wt%Mn) after the third firing with 5 wt%Cu metal according to the concentration of Te: (a) 3 wt%Te, (b) 6 wt%Te, and (c) 10 wt%Te.

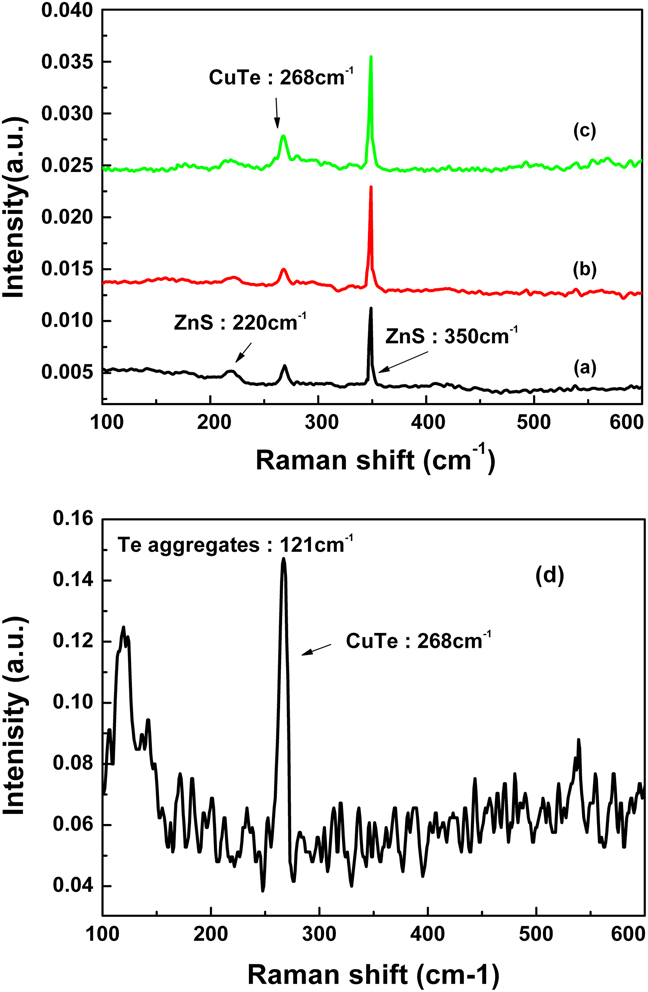
However, since a CuxTe-related phase is still believed to be the reason for an EL emission, an FT-Raman analysis was conducted as Te is known to be very sensitive in Raman experimentation.Reference Schreder and Kiefer17 As shown in Fig. 8, Raman peaks are found at 220, 268, and 350 cm−1. Peaks at 220 and 350 cm−1 are related to the [TO-TA]x and LO modes of ZnS, respectively.18–Reference Nien and Chen20 However, the peak at 268 cm−1 is not assigned to any compound such as ZnS, Cu, CuS, ZnTe, MnS, or MnTe. Since CuTe and Cu2Te Raman peaks were not found in any references, FT-Raman for CuTe was also measured as shown in Fig. 8. The peak at 267 cm−1 must be related to CuTe because the peak at 121 cm−1 is known as A1 symmetry of polycrystalline Te.Reference Amirtharaj and Pollak21 Therefore, the peaks at 268 cm−1 in the phosphors can be assigned to the CuTe (or Cu2Te)-related peak as a Raman peak of CuS (472 cm−1) is similar with that of Cu2S (474 cm−1).Reference Minceva-Sukarovaa, Najdoskia, Grozdanova and Chunnilall22
Raman spectra of ZnS:Cu,Cl,Mn,Te phosphors (at 3 wt%Mn) after the third firing with 5 wt%Cu metal according to the concentration of Te: (a) 0.05 wt%Te, (b) 0.1 wt%Te, (c) 0.5 wt%Te, and (d) CuTe metal powder only.

V. CONCLUSIONS
ZnS:Cu,Cl,Mn,Te phosphors demonstrating ∼650-nm red PL and ACPEL emissions were synthesized. Even though the concentration of Te is not sufficiently high, the red PL emission increases rapidly. A Mn K edge EXAFS analysis reveals that the shift of an orange PL emission to a red PL emission originates from the local crystal field change of the Mn2+ ions through the doping of Te. A red ACPEL emission was first shown in 0.5 wt%Te-doped phosphor. To investigate the mechanism of red ACPEL emission, XRD and Raman analyses were conducted. XRD did not reveal any clues, but Raman results showed the existence of a CuxTe phase, which induced the p–n junction of ZnS- and CuxTe-related phases. However, a further investigation should be made to confirm the direct evidence between red ACPEL emission and a CuxTe-related phase. A way to improve the luminance for use in real applications should be determined as well.