
I. INTRODUCTION
SAE 1050 grade steels are often used in mechanical and electrical devices that are frequently exposed to high cyclic loading under service conditions. Hence, ensuring a good high-cycle fatigue (HCF) resistance is recognized as an essential prerequisite to their application. Reference Hamada, Karjalainen and Puustinen1,Reference Schilke, Ahlström and Karlsson2 The HCF fracture process is generally divided into four stages: damage, fatigue crack initiation (FCI), fatigue crack propagation, and rapid fracture. The FCI stage represents the major portion of the fatigue lifetime in the HCF process. Reference Pérez-Mora, Palin-Luc, Bathias and Paris3 Makita et al. Reference Makita and Brhwiler4 explained the process of damage from the perspective of redistribution of deformation. Gaier et al. Reference Gaier, Unger and Dannbauer5 assumed that fatigue damage was caused mainly by the stress normal to the critical plane. Fatigue damage caused by HCF originates from the changes in the internal microstructure of the material, which result in a microscopic strain. The nature of HCF damage is a combination of mutually conflicting processes involving slip bands and obstacles and is usually related to the heterogeneity in microstructure, which generates local stress concentration effects and directly leads to fatigue failure. However, the site of the microstructure heterogeneity is determined by the nature of the material and boundary conditions. Understanding the characteristics of FCI is the most studied problem in the field of HCF. A large volume of research carried out by many investigators on HCF behavior has focused primarily on the formation mechanism of FCI. The local stress concentration, which is the direct reason for fatigue damage, may be caused by singularities or heterogeneity in microstructure such as non-metallic inclusions, pores, second phase particles, and grain boundaries. During the different periods of loading, the site or stage I crack which is selected for fatal crack is always competitive. Reference Umezawa and Nagai6 At the microscopic level, a cleavage crack nucleates when the stress is locally raised to the level necessary for the separation of two neighboring atomic planes (cohesive or theoretic strength). Reference Šmida and Bošanský7 Many investigators Reference Zener8–Reference Chen, Wang and Ma15 have reported in-depth analyses on the formation mechanism of FCI in different materials.
Generally, when materials undergo regular cyclic loading processes, they experience harsh conditions, such as high strain, immediately after the application of the load. The analysis of material behavior under extreme loading conditions, such as large strains and high strain rates, is a very important issue in many areas including military applications, crash testing, safety cages, helmets, aviation, and ship hulls. Reference Moćko16–Reference Moćko, Rodriguez-Martinez, Kowalewski and Rusinek19 The effect of pre-strain deformation on fatigue behavior has been studied by researchers in this field for decades. Reference Al-Rubaie, Del-Grande, Travessa and Cardoso20–Reference Arora and Raghavan25 The effect of quasi-static plastic pre-strain on HCF has also been studied for many years. It appears that the most studied material is steel and that the effects of pre-strain vary from cases where there is no apparent fatigue benefit to where either a significant benefit or detriment is observed. Reference Froustey and Lataillade26 In a pure metal, the initial dislocation density is low, and the different observed effects during monotonic and cyclic deformations of metals are mainly influenced by the nature of the material (the stacking fault energy), Reference Ghammouri, Abbadi and Mendez27–Reference An, Lin, Wu and Zhang30 physical-metallurgical factors (grain size, impurities, particles, precipitation, etc.), Reference An, Wu, Wang and Zhang29–Reference Wu, Hamada and Noguchi32 and the deformation conditions (loading type, strain rate, and temperature). Reference Wang, Zhang, Shao, Duan, Pang, Yang, Li and Zhang33
However, an important uninvestigated aspect is the influence of the pre-straining rate on the fatigue properties, which in turn implies that it is necessary to understand the effect of pre-straining rate on HCF process. We have focused our study on the HCF behavior in pre-strained SAE 1050 steels. Tensile elastic pre-deformation strained at different strain rates and stress-controlled HCF tests were performed in air at room temperature. In the pre-strained stage, constant pre-strain deformation was maintained at 0.16%, which was close to the low yield point. In combination with fatigue testing, a series of specimen characterization analyses were carried out, including continuous temperature measurements and the observation of fracture morphologies and dislocation microstructure characteristics. Rough sets theory model proposed by Pawlak Reference Pawlak34 was introduced to treat the attribute reduction of the characteristic parameters of the pre-straining rate-HCF process, to export the decision of issues under the premise of maintaining the same classification ability. The present study concerns sequential pre-straining at different rates followed by HCF and has two objectives: to characterize the sensitivity of the material toward these consecutive loadings and to establish a fatigue model to estimate the number of cycles before the occurrence of fracture, for a given set of loading conditions.
II. EXPERIMENTS
A. Materials
In the current study, medium carbon steel SAE 1050, a material used in high-speed passenger traffic train wheels, is used in this work, the chemical composition of which (wt%) is given in Table I.
Chemical composition of SAE 1050.

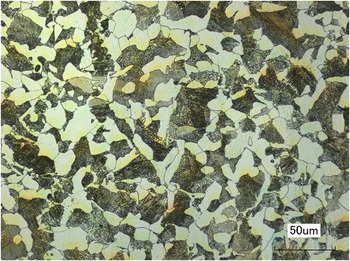
The material was rolled, and an appropriate heat treatment cycle including quenching-tempering was designed to achieve a homogeneous microstructure with optimized mechanical properties. The specific heat treatment was carried out at 860 °C for 1.5 h and after quenching at 840 °C, the steel sample was tempered at 460 °C for 2 h. Steel sample having a typical dual-phase metallurgical structure with the ferritic–pearlitic microstructure, as seen in Fig. 1, was obtained.
Microstructure of SAE 1050.

B. Analysis
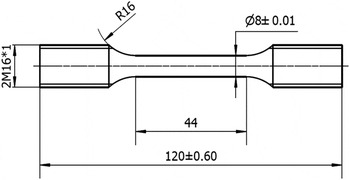
All the analyses presented in this article, including the tensile and fatigue tests, were carried out on specimens with geometry that satisfied the requirements of ISO 6892-1: 2009 and ISO 1099: 2006(E) international standards for both tensile and fatigue testing. The geometry and dimensions of the specimens are illustrated in Fig. 2. The gage length and diameter were 44 and 8 mm, respectively.
Shape and dimensions of the specimen.

A quasi-constant hardness value of 106 ± 3 HV1 was measured in sections perpendicular to the axis of specimen, suggesting that the plastic flow behavior of the studied steel in the as-received condition should be homogeneous. In this work, we have attempted to demonstrate the effect of pre-straining rate on the HCF lifetime (N f). For this purpose, specimens were systematically characterized and their pre-straining rate and HCF were studied at room temperature. First, during tensile testing, the properties of SAE 1050 steel under tensile loading were analyzed using a CMT 5305 servo-hydraulic testing machine equipped with an electro-mechanic extensometer under constant total strain amplitude (0.16%) control, with different strain rates between 10−5 s−1and 10−2 s−1. The pre-straining deformation was completed within the elastic regime. The strain was measured with a clip-on extensometer attached directly to the gage length. To avoid the impact of the strain gauge on the sample surface, 704 latex was spread on the surface prior to the experiment. Subsequently, the cyclic deformation behavior of the pre-strained specimens was investigated in the HCF regime by using a GPS 100 resonant testing device, an electromagnetic shaker-based HCF test machine, at a frequency of 115 Hz.
The entire HCF monitoring experiment was carried out under a constant of maximum tensile stress amplitude of 402 MPa and sinusoidal wave loading with a tensile stress ratio of 0.1 in air, at room temperature. During the process of HCF, the specimen temperature was continuously measured with the help of thermocouples on the area of the sample gage up to the point where the sample experienced fatigue failure. The stop criterion for the total stress-controlled fatigue tests was chosen to be a 10% drop in the tensile force.
Fracture morphologies of specimens that experienced the period of HCF following deformation at different strain rates were observed by scanning electron microscopy (JEOL JSM-7001F) and ultra-depth microscopy (VHX-5000) that enabled a comprehensive two dimensional and three dimensional (3D) characterization of the crack morphology. Moreover, the morphologies in the different regions of the crack were also characterized using the HV hardness tester. A load of 1000 g force applied for 15 s was chosen as the experimental condition to measure the hardness values of the fracture morphologies of the different specimens. Micro hardness value could be very well correlated with internal stress level, which could not be quantitatively displayed in different regions of the crack morphology.
In addition, the microstructures of the specimens before and after fatigue tests were characterized by transmission electron microscopy (TEM; FEI Tecnai F20 instrument) operated at 200 kV to study the influence of the pre-straining rate on the microstructural evolution and the fundamental fatigue micro mechanisms in operation. Thin foils pre-fatigued for TEM observation were cut from the cross-sectional plane at the centers of the specimens by using spark cutting. Post-fatigued samples for TEM examination were obtained from thin slices cut at a distance of 1 mm away from the fracture planes. All the thin foils were prepared by standard methods involving mechanical grinding, polishing, and dimpling, followed by ion milling.
III. RESULTS
A. The relationship between the low yield stress and the tensile strain rate
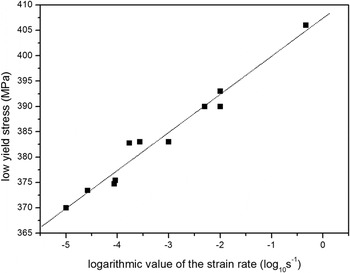
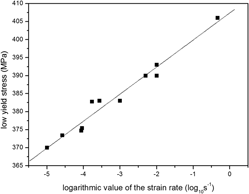
The effect of strain rate on the low yield stress of the specimens was elucidated from a series of tensile tests on the SAE 1050 specimens. The tensile strain rate was varied between 10−5 and 10−2. In general, the strain rate has a clear effect on the yield stress of metallic materials, particularly in the case of low carbon steels. Reference Tsuchida, Masuda, Harada, Fukaura, Tomota and Nagai35–Reference Itabashi and Kawata37 Our sample specimens also showed similar results, which are given in Fig. 3.
Relationship between the low yield stress and the tensile strain rate.

From Fig. 3, it is clear that the strain rate (
 ${\rm{\dot \varepsilon }}$
) follows a log-normal relation with the low yield stress (σLYS). Accordingly, the low yield stress of the specimen increased proportionally with increasing tensile strain rate. The log-normal relationship is described by the following equation:
 $${{\rm{\sigma }}_{{\rm{LYS}}}} = 7.5137\,\mathop {{{\log }_{10}}}\nolimits^{\dot \varepsilon } + 407.42\quad {\rm{.}}$$
During HCF tests, the estimated low yield stress can reach 406 MPa on the condition that the frequency of the specimen is consistent with the high-frequency testing machine, which is 115 Hz.
B. The pre-straining rate-high-cycle fatigue process
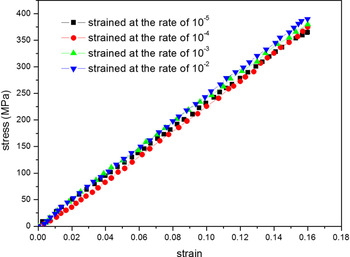
Prior to HCF testing, 12 specimens were chosen to be tensile strained. The tensile pre-strain deformation was maintained constant at 0.16%, which was close to the low yield point, to ensure that the pre-straining was completed within the elastic regime. Four types of pre-strained specimens were prepared at four different strain rates, namely 10−5 s−1, 10−4 s−1, 10−3 s−1, and 10−2 s−1, using a servo-hydraulic testing machine. For each set of experiments, three pre-strained specimens at the same strain rate were tested. The representative stress–strain curves for the pre-strain deformation are shown in Fig. 4.
The stress–strain curves for the pre-strain deformation at different rates.

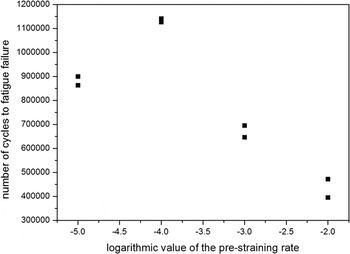
Next, one specimen was selected from each set and prepared for characterization by TEM. The others were used in HCF tests, which were carried out with a sinusoidal wave form loading at a stress ratio of 0.1 in air, at room temperature under constant maximum stress amplitude of 402 MPa. The variation of the lifetime of the specimens as a function of the pre-straining rate during HCF is shown in Fig. 5.
Lifetime changes with pre-straining rate during HCF under a constant total stress of amplitude 402 MPa at stress ratios of 0.1.

It is clearly seen that HCF lifetime increases initially with increasing pre-straining rate, but reduces subsequently. This observed trend indicates that two conflicting mechanisms governed the effect of the pre-straining rate during the process of HCF. This aspect will be discussed in Sec. IV. A.
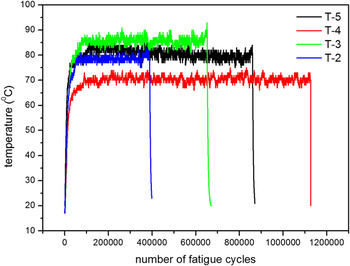
Specimens in each set with different strain rates, namely 10−5 s−1, 10−4 s−1, 10−3 s−1, and 10−2 s−1, were named as sp-5, sp-4, sp-3, and sp-2, respectively. During the process of HCF, the sample temperature was monitored continuously, as shown in Fig. 6.
Evolution of the sample temperature as a function of the number of fatigue cycles: T-5, T-4, T-3, and T-2 represent the change in temperatures of sp-5, sp-4, sp-3, and sp-2.

The evolution of the sample temperature during fatigue cycling showed the following significant trend: in the initial stage HCF, the temperature increased rapidly, after which it was relatively stable showing constant but slight fluctuations of around 5 °C. In the final stage HCF, the temperature reached an extreme value. For relatively larger pre-straining rates, such as 10−3 s−1 and 10−2 s−1, this was the maximum temperature attained during the whole process. On the contrary, in the other two cases, the temperature decreased slowly after the initial rapid increase, especially for the specimen with a pre-straining rate of 10−5 s−1. The specimen with a pre-straining rate of 10−4 s−1 experienced the longest N f, and for this sample, the temperature variations were also relatively small during the entire process. Comparatively larger variations occurred in the middle of the process, and the specimen with a pre-straining rate of 10−4 s−1 was similar to the sample with 10−5 s−1pre-straining rate. It can be assumed that slip systems formed during fatigue tests, the process following different pre-straining rates, should be varied with respect to their location and the nature of the region where they are formed. Moreover, different types of microscopic plastic strains caused by the effect of pre-straining were present during different stages of the HCF process.
C. Microstructure of pre-strained steel samples
The microstructures characteristic of pre-fatigued samples are shown in Fig. 7; the images obtained present typical features of the ferritic–pearlitic microstructure of pre-strained specimens.
Dislocation microstructure in pre-fatigued samples strained at different pre-straining rates. (a) Microstructure of a dislocation in the specimen pre-strained at the rate of 10−5. (b) Microstructure of a dislocation in the specimen pre-strained at the rate of 10−4. (c) Microstructure of a dislocation in the specimen pre-strained at the rate of 10−3. (d) Microstructure of a dislocation in the specimen pre-strained at the rate of 10−2.

Following tensile elastic pre-deformation with a lower pre-straining rate, there were few dislocations in the original structure in the pre-fatigued samples, and most of these dislocations were confined to the grain boundaries and to interfaces between phases. However, with the increase in pre-straining rate, more dislocation multiplications and greater dislocation density were the main observed features. Interestingly, there were more dislocations accessed, wound, and pinned within different organizational structures that tended to form a clear pattern of dislocations within the cementite lamellar structure. However, the dislocations did not tend to aggregate at the interfaces or form dislocation walls or dislocation cells.
D. Observation of the fracture surface
The pre-strained specimen that underwent HCF demonstrated instantaneous failure, and the crack source was relatively flat. The characteristics of the fracture surface were investigated to study the areas where potential microscopic plastic strain could occur, which determined the driving force for crack formation and its propagation.
1. Microscopic characteristics of the fracture surface
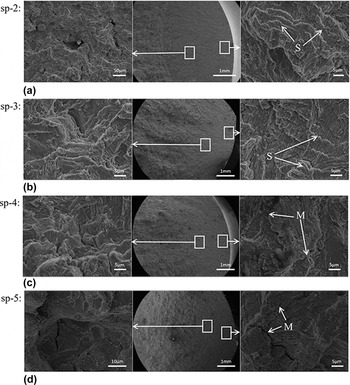
As seen from Fig. 8, fatigue striations and secondary microcracks were the main observed features in the fatigue crack source zones for the specimens sp-5 and sp-4. It can be inferred that more severe local microscopic strains appeared irreconcilably in the internal structures of sp-5 and sp-4, and secondary microcracks in sp-5 were comparatively more obvious. In sp-5 and sp-4, in the region of stable crack growth, the main features were similar to the microscopic characteristics of the crack source zone; however, multiple cleavage planes were observed with a higher contrast.
Microscopic characterization of the fracture surface: M—secondary microcracks and S—fatigue striations.

In contrast, there were significant differences in the micro morphologies of sp-3 and sp-2. In the crack source regions of these two specimens, characteristic fatigue striations and cleavage planes were found, but no significant secondary microcracks appeared. In the stable crack growth stage, a large number of intensive secondary microcracks and more intensive characteristics of cleavage planes were presented. We deduced that the barriers to crack growth were higher, which led to an increase in the local strain during the subsequent rapid crack propagation stages.
2. Three dimensional characterization and HV hardness of fracture surfaces
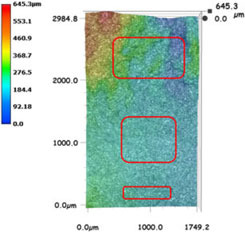
According to Table II, in the crack source area, and in the entire region of steady crack expansion, the fracture surface was relatively flat and the height difference was constant at less than 90 μm. For sp-5 and sp-4, the lowest and the highest positions in the fracture morphology were both in the final fracture region; the largest gaps were 645.3 μm and 559.1 μm, respectively. In contrast, the lowest and the highest points of sp-3 and sp-2 were in the crack source region and in the final stage of stable fatigue crack propagation region, respectively. It is noteworthy that the height of the fracture surface in sp-3 and sp-2 increased regularly layer by layer from the lowest position in the crack source, which in turn led to the layer by layer lifting of the cleavage plane.
Three dimensional characterization and HV hardness of crack source and stable crack propagation regions.

In parallel, the HV hardness of the crack source and stable crack propagation regions were quantitatively characterized. First, the HV hardness of the crack source, stable crack propagation I, and stable crack propagation II regions gradually decreased. Secondly, the HV hardness of the four different sets of specimens showed few differences with respect to each other in the stable crack propagation II region, whereas significant differences were observed in the crack source and stable crack growth I regions. These findings confirm the observed microscopic features of the fracture surface shown in Fig. 8 and could be helpful in quantitative characterization.
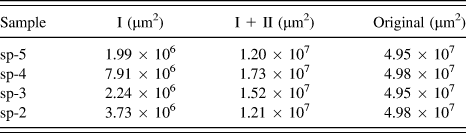
As also shown in Table II, the depths of extended fatigue stable cracks varied from each other. To further analyze the fatigue fracture characteristics during the different stages of stable crack propagation under different conditions of pre-straining rates, the areas of the stable crack propagation regions I and II were measured and are listed in Table III.
Measured areas of the stable crack propagation I, II, and original area.

With increase in the pre-straining rate, the measured area of the stable crack propagation I region showed an overall decreasing trend after an initial increase, even though the specimens sp-3 and sp-2 deviated slightly from this trend. Moreover, the changing regular of the total area measure of stable crack propagation I and II was strictly in compliance with the increment of the pre-straining rate. A comprehensive examination of the areal features of stable crack propagation I and II regions is needed to provide a basis to model the process of fatigue.
E. Deformed microstructure under the fracture surface
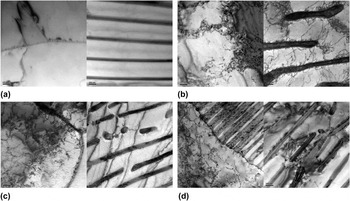
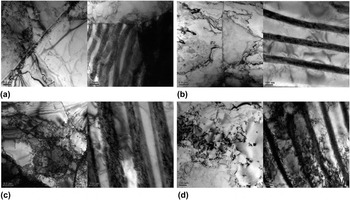
To reveal the potential effect of the pre-straining rate on the HCF behavior, dislocation microstructures on the cross-sectional area beneath the fracture surface of the specimens have been imaged. These are shown in Fig. 9.
Dislocation microstructure in failure samples that experienced different periods of pre-straining rate-HCF. (a) Dislocation microstructure in sp-5. (b) Dislocation microstructure in sp-4. (c) Dislocation microstructure in sp-3. (d) Dislocation microstructure in sp-2.

With increase in pre-straining rate, greater dislocation multiplications and higher dislocation density were the main observed features. Interestingly, an increasing number of dislocations were accessed, wound, and pinned within the different organizational structures. It can be clearly seen that with increasing pre-straining rate, a higher local microscopic plastic strain was produced in the internal structure of the cells.
1. In the ferrite structure
In sp-5 that has the lowest pre-straining rate, there were mainly low-density dislocations such as dislocation lines and entangled dislocations. These were mostly confined to the interfaces and had not yet formed a dislocation cell. While there was a clearer trend of forming dislocation cells and dislocation cell walls in sp-4, a small number of dislocation lines appeared within the dislocation cells. In sp-3, the dislocation structure formed a clear context of dislocations, dislocation walls, and dislocation cells. Increasing number of dislocation lines were extended into cells. Furthermore, in sp-2, which has the highest pre-straining rate, a greater number of dislocations were entangled in the dislocation cells.
2. In the pearlite structure
With increase in the pre-straining rate, the pattern of dislocations inside the cementite lamellae was clearer. Simultaneously, many more dislocations were wound and pinned at the interface between the phases. Certain dislocations traveled across the phase interface and entered into the ferrite phase within the pearlite structure [Fig. 9(d)].
IV. DISCUSSION
Indeed, there are more complex and uncertain harsh conditions experienced undergo regular cyclic loading process, such as high strained immediately. As seen from the results in Sec. III, there is a clear impact of the pre-straining rate on the process of HCF. The low yield stress of the specimen varied monotonously with the pre-straining rate. However, the impact of the pre-straining rate on HCF damage was non-monotonic, which indicated the presence of at least two different mechanisms in action.
A. Crack source and stable crack propagation
For homogeneous materials, FCI is mainly related to the presence of non-homogeneous plastic regions that result in large slip offsets at the surface, commonly known as persistent or permanent slip bands (PSBs). Reference Polak38 It was assumed that only the stress normal to the critical plane where microscopic plastic straining takes place was responsible for fatigue damage. Reference Gaier, Unger and Dannbauer5 In the crack initiation and the initial cyclic deformation stages in HCF, the response of microscopic strain was mainly controlled by friction stress Reference Srinivasan, Sandhya, Bhanu Sankara Rao, Mannan and Raghavan39 that led to the rapid increase in temperature. However, the presence of dislocations between two adjoining boundaries with different orientations on the PSBs was the main reason for crack initiation. In our work, on the other hand, we have focused on the impact of the pre-straining rate on the location, or the area where microscopic plastic strain occurred during HCF.
Fracture morphology is a good indicator of the local microscopic plastic strain and is influenced by both the pre-straining rate and the subsequent HCF process. As seen from Fig. 8 and Table II, in the crack source and stable crack propagation I regions, for sp-5 and sp-4, secondary microcracks appeared near the source location reminiscent of the occurrence and dominance of ‘locally’ brittle failure mechanisms at the fine microscopic level, Reference Bendstra, Koss, Geltmacher, Matic and Everett40,Reference Van Stone, Cox, Low and Psioda41 and the stable crack propagation path displayed in the 3D images was relatively rough. Wang et al. Reference Luo, Huang, Tian and Wang42 had also found that secondary cracks were prevalent at lower strain rates. On the other hand, as shown in Fig. 7, at relatively lower pre-straining rates, before fatigue testing, the dislocations tended to stay at the grain boundaries and played a role in the strengthening of the grain as a whole, where the microscopic plastic strain deformation was generated and evolved during the subsequent HCF process (Fig. 9). Therefore, secondary microcracks were prevalent on the condition that more scales of microscopic plastic strain on the path of fatigue crack propagation. Compared with sp-5 and sp-4, no significant secondary microcracks were seen in the microscopy images of sp-3 and sp-2, and not too many abrupt temperature changes were observed during the crack source or stable crack propagation I stages. It had been reported that a higher strain rate produced a higher density of dislocations inside the cell walls with smaller size. Reference Lee and Liu36 This has indeed been observed for our specimen, as verified from Fig. 9, and leads to a lower mobility of dislocations at higher strain rates, which makes it more difficult to observe plastic deformation.
Thus, in the crack initiation and stable crack propagation I stages, due to friction and heat, more irreconcilable strains were generated in the metastable expansion period. This enables a larger energy release, especially in sp-5, the temperature of which initially increased rapidly during the process after which it decreased gradually. The maximum height values were observed in the stable crack propagation II stage of sp-5 and sp-4. One main reason for speculation was caused by inertia of crack propagation energy and the second one was the high crack growth rates. In contrast, for sp-3 and sp-2, the fracture surface heights showed a regular layer by layer increase, and the temperature increased slowly during the stable crack propagation stage. As seen from the fracture morphology, there were a lot of fatigue strips, which resulted from the alternating plastic passivation-opening and closing-sharpening at the crack tip. Reference Zhang, Zhu, Hu, Wang, Chen and Qin43 From a microscopic viewpoint, the cleavage crack nucleates when the stress is locally increased to the level required for the separation of two neighboring atomic planes (cohesive or theoretical strength). Reference Šmida and Bošanský7 Therefore, cross slips causing the macroscopic plastic flow of critical shear stress became larger and hardened up at lattice sites, leading to a lower crack growth rate.
The height variations in the 3D images were highly random, indicating that these are closely related to the crack propagation mode, rapid energy release, together with higher energy accumulation and internal quality attenuation. Crack propagation was mainly caused by shear stress, as reflected in the fracture morphology characteristics. Therefore, the measured stable crack propagation I and II areas had a certain rationality. In parallel, we have carried out depth-sensing indentation tests. HV hardness of sp-5 and sp-4 was clearly lower than that for the other two samples in the crack source and stable crack propagation I regions. The value of HV hardness is directly related to the resistance to microscopic plastic deformation Reference Ye, Xu, Xiao and Cha44 due to fatigue damage evolution, which cannot be clearly ascertained from the fracture morphology characteristics. In addition, this parameter revealed the deterioration of the inherent material properties. The values of HV hardness can be further related to the total cyclic plastic strain that is ultimately responsible for fatigue damage Reference Sandor45 and is a promising tool to study the pre-straining rate-HCF fatigue model.
On the other hand, from TEM investigations, it was verified that with increasing pre-straining rate, more dislocations were accessed, wound, and pinned within different organizational structures of pre-fatigued samples, but these did not just tend to aggregate at the interface positions or tried to form dislocation walls or dislocation cells. Different dislocation structures appeared in the material before the process of HCF, which provided different sites and locations for the occurrence of heterogeneous microscopic strain that played a role in the subsequent fatigue tests. Under a lower strain rate of pre-deformation, slip dislocations pile up at the grain boundary during fatigue, leading to intense strain localization at the grain boundary [Fig. 9(a)]. Moreover, the dislocations lodged in grain boundaries can facilitate grain sliding and rotations across the grains, Reference Cheng, Zhao, Wang, Li, Wang, Liaw and Lavernia46 which is bound to increase the fatigue crack growth rate. On the contrary, with increase in pre-straining rate, slip dislocations are accessed, wound, and pinned within organizational structures [Fig. 9(b)], further improving the deformation homogeneity and delaying the nucleation of micro-scale fatigue cracks. Reference Guo, Chun, Lee, Heo and Lee47,Reference Liu, Zhang, Zhang and Zhang48 However, the non-equilibrium microscopic strain produced by higher pre-straining rate-HCF with a high density of extrinsic dislocations entangled in the dislocation cells [Figs. 9(c) and 9(d)] and the ease of cross slip render the cell boundaries thermodynamically unstable and readily moveable, leading to an increase in the local strain energy during long-term to-and-fro deformation. Reference Huang, Zhu, Jiang and Lowe49–Reference An, Lin, Wu and Zhang51 In fact, these cell boundary activities can be readily activated by the stress field built up by the high density of extrinsic dislocations in the non-equilibrium cell boundary. Reference Cheng, Zhao, Wang, Li, Wang, Liaw and Lavernia46,Reference Huang, Zhu, Jiang and Lowe49,Reference Tucker and McDowell50 It is unavoidable that some energy is lost in these internal processes, due to irreversible changes in the internal structure of the cells. Reference Lage, Cachão, Reis, Fonte, De Freitas and Ribeiro52 This may decrease the mechanical properties of the pre-strained specimens and the inelastic strain generated can result in earlier fatigue damage. However, a higher density of dislocations inside the cells facilitated the cross slip mechanism, which helped to reduce the fatigue crack growth. On the other hand, it has been shown theoretically Reference Firstov, Danilenko, Kopylov and Podrezov53 and experimentally Reference Danylenko, Podrezov and Firstov54 that the force and energetic parameters of the fracture process and fracture toughness are affected by the deformation substructure. It was found that the fracture toughness tends to decrease under only two conditions: when there exists a random distribution of dislocations within grains and when dislocation cells have low angle boundaries that prevail with the deformation growth. On the contrary, the origin of cells with misoriented angle boundaries results in a sharp increase in fracture toughness. From this point of view, we can clearly understand that under conditions of higher pre-straining rates, the fracture toughness is greatly increased as a result of the microstructure instability within cells and misoriented angle cell boundaries, leading to a sharper reduction in fatigue life.
Several factors influence the initiation of fatigue, such as material microstructure (grain size, microscopic flaws at grain boundaries, twin boundaries, and inclusions) and loading conditions such as sequence of loading and path effects (pre-strained, variable amplitude problem). Reference Li, Aubin, Rey and Bompard55 It is well established that the cyclic deformation behavior of SAE 1050 is essentially related to two fundamental fatigue damage mechanisms: the homogeneity of deformation within grain boundaries and the integrity of the boundary structure. In view of these different mechanisms related to the effect of the pre-straining rate on crack initiation and crack propagation, N f did not show a monotonous variation with increasing pre-straining rate.
B. Attribute reduction of characteristic parameters
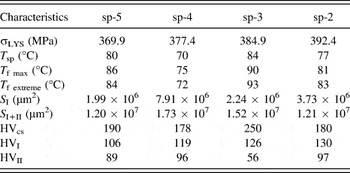
In Sec. IV. A, we have analyzed the variation of material characteristics during the HCF process of pre-strained steel samples. These specific characteristic parameters are summarized in Table IV.
Characteristic parameters. a

a where σLYS: low yield stress; T sp: stable temperature point of the specimen cyclically deformed in the fatigue stable crack propagation stage; T f max: maximum temperature point during the entire HCF; T f extreme: extreme temperature point of the specimen in the fatigue stable crack propagation stage; S I, S I+II: measured areas of the fatigue stable crack propagation I and fatigue stable crack propagation regions; HVcs, HVI, HVII: HV hardness (obtained from the average of the three corresponding values summarized in Table II) in fatigue crack source and fatigue stable crack propagation I and II, regions, respectively.
Each of these parameters and differences in their evolution for the four different cases were vital to the present work. We have normalized certain characteristic parameters and have redefined some new characteristic parameters, namely σLYS/406 (ratio of low yield stress to 406 MPa, which is the estimated low yield stress under the operating conditions in the HCF process), the product of S I/S ori. (ratio of the measured area of stable crack propagation I and the original area) and S I+II/S ori. (the ratio of sum of the measure areas of stable crack propagation I and II, and the original area), and the product of HVI/HVcs and HVII/HVcs. Moreover, it is interesting to note that the difference between the point of maximum temperature in the intermediate stage and the extreme point before fatigue failure was positive in sp-5 and sp-4, but negative in the other two cases. Based on our observations, the difference between the two temperature points (T f max and T f extreme) was also used as a new characteristic parameter. The new characteristic parameters, the number of which is reduced to five now, are summarized in Table V.
New characteristic parameters.

Next, the rough sets theory model was introduced to account for the attribute reduction in the new characteristic parameters during the pre-straining-HCF process, to export the decision of issues under the premise of maintaining the same classification ability. Therefore, it was necessary to first define the decisions in the rough sets model. The relationship between the value of N f and that for the previous case was used as a decision which was set to 1 in this paper, on the condition that the number N f for the particular sample case was higher than that for the previous one, or in the case of sp-5, the first case. This value is set to 0 when this condition is not satisfied. Secondly, the value of the new characteristic parameters should be decentralized. The method to do this was to classify equally every attribute into two types, namely discrete and distinguishable attributes. The decision table is shown in Table VI.
Decision table.

“a1” represents the value of the attribute σLYS/406 when relatively lower, which otherwise is “a2”. Other representative codes of attributes have a similar meaning. Next, we calculated the attribute reduction of rough sets theory model.
The divisions of the attributes are as follows:
 $${U \mathord{\left/ {\vphantom {U {{\rm{ind}}}}} \right. \kern-\nulldelimiterspace} {{\rm{ind}}}}\left( {{\rm{specimen}}} \right) = \left\{ {\left\{ {{\rm{sp - 5}}} \right\}{\rm{,}}\;\left\{ {{\rm{sp - 4}}} \right\}{\rm{,}}\;\left\{ {{\rm{sp - 3}}} \right\}{\rm{,}}\;\left\{ {{\rm{sp - 2}}} \right\}} \right\}\quad ,$$
 $${U \mathord{\left/ {\vphantom {U {{\rm{ind}}}}} \right. \kern-\nulldelimiterspace} {{\rm{ind}}}}\left( d \right) = \left\{ {\left\{ {{\rm{sp - 5,\ sp - 4}}} \right\},\;\left\{ {{\rm{sp - 3,\ sp - 2}}} \right\}} \right\}\quad ,$$
 $${\rm{Po}}{{\rm{s}}_{{\rm{sample}}}}\left( d \right) = \left\{ {\left\{ {{\rm{sp - }}5} \right\},\;\left\{ {{\rm{sp - 4}}} \right\},\;\left\{ {{\rm{sp - 3}}} \right\},\;\left\{ {{\rm{sp - 2}}} \right\}} \right\}\quad .$$
The distinguish matrix is as follows:
 $$\matrix{ {} & {{\rm{sp - 5}}} & {{\rm{sp - 4}}} & {{\rm{sp - 3}}} & {{\rm{sp - 2}}} \cr {{\rm{sp - 5}}} & \emptyset & {} & {} & {} \cr {{\rm{sp - 4}}} & {\left\{ {c,e} \right\}} & \emptyset & {} & {} \cr {{\rm{sp - 3}}} & {\left\{ {a,b,f} \right\}} & {\left\{ {a,b,c,e,f} \right\}} & \emptyset & {} \cr {{\rm{sp - 2}}} & {\left\{ {a,b} \right\}} & {\left\{ {a,b,c,e} \right\}} & {\left\{ f \right\}} & \emptyset \cr} \quad {\rm{.}}$$
The distinguish function is:
 $$\eqalignb{ & \Delta = \left( {c \vee e} \right) \wedge \left( {a \vee b \vee f} \right) \wedge \left( {a \vee b \vee c \vee e \vee f} \right) \wedge \left( {a \vee b} \right) \wedge \left( {a \vee b \vee c \vee e} \right) \wedge f \cr & \;\;\; = \left( {c \vee e} \right) \wedge \left( {a \vee b} \right) \wedge f \cr & \;\;\; = \left( {\left( {c \wedge f} \right) \vee \left( {e \wedge f} \right)} \right) \wedge \left( {a \vee b} \right) \cr & \;\;\; = \left( {\left( {\left( {c \wedge f} \right) \vee \left( {e \wedge f} \right)} \right) \wedge a} \right) \vee \left( {\left( {\left( {c \wedge f} \right) \vee \left( {e \wedge f} \right)} \right) \wedge b} \right) \cr & \;\;\; = \left( {a \wedge c \wedge f} \right) \vee \left( {a \wedge e \wedge f} \right) \vee \left( {b \wedge c \wedge f} \right) \vee \left( {b \wedge e \wedge f} \right)\quad . \cr}$$
Hence, the sets of attribute reductions based on the decision are as follows: {a,c,f}, {a,e,f}, {b,c,f}, and {b,e,f}. In the current situation, it is practical to choose a combination of characteristic parameters for attribute reductions, which reflected the inter-relationships between the boundary conditions of the experiment, continuous data collections during the process, and the microscopic characteristics of the ultimate failure fracture. The sets of attribute reductions so obtained would help to provide a scientific support for the establishment of the fatigue model.
C. Fatigue model
A comprehensive understanding of the characteristic parameters in combination with developing new methods to reliably calculate fatigue lifetime is of great importance. According to a previous work, Reference Degrieck and Paepegem56 the models describing fatigue behavior are divided into three categories. We have constructed a phenomenological model belonging to the second category Reference Degrieck and Paepegem56 in dealing with the characteristic parameters reduced by the rough sets theory model discussed in Sec. IV. B.
In accordance with the results in Sec. IV. B, there are four combinations of characteristic parameters of attribute reduction used to feasibly predict N f. In this work, the {a, c, f} characteristic parameter combination was selected to predict N f as an indicator and based on this, a totally new fatigue model is presented in Eq. (6).
 $${\left( {a + \delta \times c} \right)^\alpha } = {\left( {{{{N_{\rm{f}}}} \over {{{10}^7}}}} \right)^\beta } \times \exp \left( {f - \mu } \right)\quad{\rm{.}}$$
δ, α, β, and μ are four unknown material parameters that were determined using the Newton–Raphson method wherefrom the fatigue model is written using the following Eq. (7):
 $${\left( {a + 0.0066 \times c} \right)^{ - 6.0254}} = {\left( {{{{N_{\rm{f}}}} \over {{{10}^7}}}} \right)^{0.3866}} \times \exp \left( {f - 1.5074} \right)\quad{\rm{.}}$$
Additional experiments were carried out to validate the predictive ability of this fatigue model.
As shown in Table VII, the new fatigue model presented in this paper is able to make a good prediction for the lifetime of the process of HCF in a pre-strained material. The model is also able to explain and establish the connection between the characteristic parameters and the fatigue model, which addressed the intimate inter-relationship between factors such as the boundary conditions of the experiment, continuous data collection during the process, and the microscopic characteristics of the ultimate failure fracture.
Additional experiments.

V. CONCLUSIONS
The effects of the pre-straining rate under conditions of a low pre-strain deformation of 0.16% on subsequent HCF were investigated at room temperature. Our experiments proved that the damage mechanism was different, even at low pre-deformation conditions.
-
(1) In the pre-process of tensile strain tests, the strain rate had a clear effect on the low yield stress in SAE 1050 and showed a strictly monotonic increase. However, the impact of the pre-straining rate on HCF that followed was non-monotonic, which indicated the presence of at least two different mechanisms in action.
-
(2) It was found that different dislocation structures appeared in the material just after the process of tensile elastic pre-deformation, which provided different sites and locations for the occurrence of heterogeneous microscopic strain during the subsequent fatigue tests.
-
(3) Cyclic deformation behavior of SAE 1050 is essentially pertinent to two fundamental fatigue damage mechanisms: the homogeneity of deformation within the grain boundaries and the integrity of the boundary structure. Under a low strain rate of pre-deformation, slip dislocations pile up at the grain boundary during fatigue, facilitating grain sliding and rotations across the grains. With increase in the pre-straining rate, the microstructure homogeneity within cells and lower fracture toughness help to delay the nucleation of FCI and fatigue propagation. However, at higher pre-straining rates, factors such as the microstructure instability within cells, the presence of misoriented angle cell boundaries, and the higher fracture toughness result in a sharper reduction in fatigue life.
-
(4) Alternative and faster methods of fatigue characterization were adapted to save time. Normalization and rough sets theory model were used for the attribute reduction in characteristic parameters. Four sets of attribute reductions based on decisions were obtained, and each one had only three characteristic parameters. A totally new fatigue model was presented, which was able to make a good lifetime prediction of the process of HCF following different pre-straining rates. The fatigue model addressed the inter-relationship between factors such as the boundary conditions of the experiment, continuous data collections during the process, and the microscopic characteristics of the ultimate failure fracture.
The effects of the pre-straining rate on the property of SAE 1050 are evident, even when the strain is completely in the elastic regime. Hence, the pre-straining rate should be an important boundary condition in further studies.
ACKNOWLEDGMENTS
The authors would like to thank the Joint Funds for basic research of High Speed Railway of the National Natural Science Foundation of China (No. U1334204) for providing financial support.