INTRODUCTION
According to Gauldie (Reference Gauldie1991) it can be difficult to define the term ‘stock’. Several definitions have been presented in the literature (Gulland, Reference Gulland1969; Jamieson, Reference Jamieson and Hardin1973; Booke, Reference Booke1981; Ihssen et al., Reference Ihssen, Booke, Casselman, McGlade, Payne and Utter1981; Gauldie, Reference Gauldie1988; Carvalho & Hauser, Reference Carvalho and Hauser1994; Begg & Waldman, Reference Begg and Waldman1999), but in the modern definition of a stock it is desirable to incorporate the genotypic and phenotypic components (Cadrin et al., Reference Cadrin, Kerr and Mariani2013). In fisheries, the delineation of stock is crucial (Waldman, Reference Waldman, Cadrin, Friedland and Waldman2007; Cheilari & Rätz, Reference Cheilari and Rätz2009) as an integral component (Tracey et al., Reference Tracey, Lyle and Guy Duhamelb2006) of modern fisheries assessment and management.
Several techniques are used for the discrimination of stocks (Cadrin et al., Reference Cadrin, Kerr and Mariani2013). Otolith shape analysis is one of the techniques in the morphometric analysis group used as a tool of stock discrimination, because the otolith is influenced by both genetic heterogeneity and environmental factors (Campana & Casselman, Reference Campana and Casselman1993; Cadrin & Friedland, Reference Cadrin and Friedland1999; Torres et al., Reference Torres, Lombarte and Morales-Nin2000; Cardinale et al., Reference Cardinale, Doering-Arjes, Kastowsky and Mosegaard2004; Swan et al., Reference Swan, Geffen, Gordon, Morales-Nin and Shimmield2006; Vignon & Morat, Reference Vignon and Morat2010).
This technique has been used widely with success in stock identification studies of several species in the Atlantic and the Mediterranean Sea, but has never been used for Oblada melanura stock identification studies.
The saddled bream, Oblada melanura (Linnaeus, 1758) belongs to the family of Sparidae, known for its high commercial value, although their importance by weight in catches remains low in the Mediterranean fisheries (Harmelin-Vivien et al., Reference Harmelin-Vivien, Harmelin and Leboulleux1995). The saddled bream is also among the species trialled for possible fish farming (Suquet et al., Reference Suquet, Divanach, Hussenot, Coves and Fauvel2009). This species presents a wide geographic distribution that extends in tropical and temperate regions of the Atlantic Ocean and throughout the Mediterranean, the Black Sea (Fisher et al., Reference Fischer, Bauchot and Schneider1987) as well as in Tunisia in the south central of the Mediterranean Sea from the north to the south.
The saddled bream moves on rocky and sandy seabeds or on seagrass of posidonia or zostera to depths of 30–40 m (Harmelin-Vivien et al., Reference Harmelin-Vivien, Harmelin and Leboulleux1995). The recruitment of saddled bream juveniles occurs in rocky micro-habitats with a variable slope, characterized by the presence of overhangs. Afterwards, at the advanced stages, juveniles settle in different deeper zones (Harmelin-Vivien et al., Reference Harmelin-Vivien, Harmelin and Leboulleux1995) and adopt gregarious and benthopelagic behaviour.
In the Mediterranean Sea, several studies have researched saddled bream population and stock discrimination using genetic, parasites, otolith chemistry and morphometric analyses (Summerer et al., Reference Summerer, Hanel and Sturmbaue2001; Calarza, Reference Calarza2007; Roques et al., Reference Roques, Galarza and Macpherson2007a, Reference Roques, Galarza, Macpherson, Turner and Ricob; Smrzlić et al., Reference Smrzlić, Valić, Kapetanović, Kurtović and Teskeredžić2012; Gkafas et al., Reference Gkafas, Tsigenopoulos, Magoulas, Panagiotaki, Vafidis, Mamuris and Exadactylos2013; Nilolioudakis et al., Reference Nikolioudakis, Koumoundouros and Somarakis2014; Caló et al., Reference Calò, Muñoz, Pérez-Ruzafa, Vergara-Chen and García-Charton2016a, Reference Calò, Di Franco, De Benedetto, Pennetta, Pérez-Ruzafa and García-Chartonb).
In Tunisia, some studies dealing with the stock assessment and fisheries management of this species are in progress. A stock identification constitutes a first step for fisheries management. For this purpose, we focus our interest in studying the relationship between the otolith shape with geographic distribution for the stock of Oblada melanura along the Tunisian coast in three sites.
MATERIALS AND METHODS
Study areas and sampling
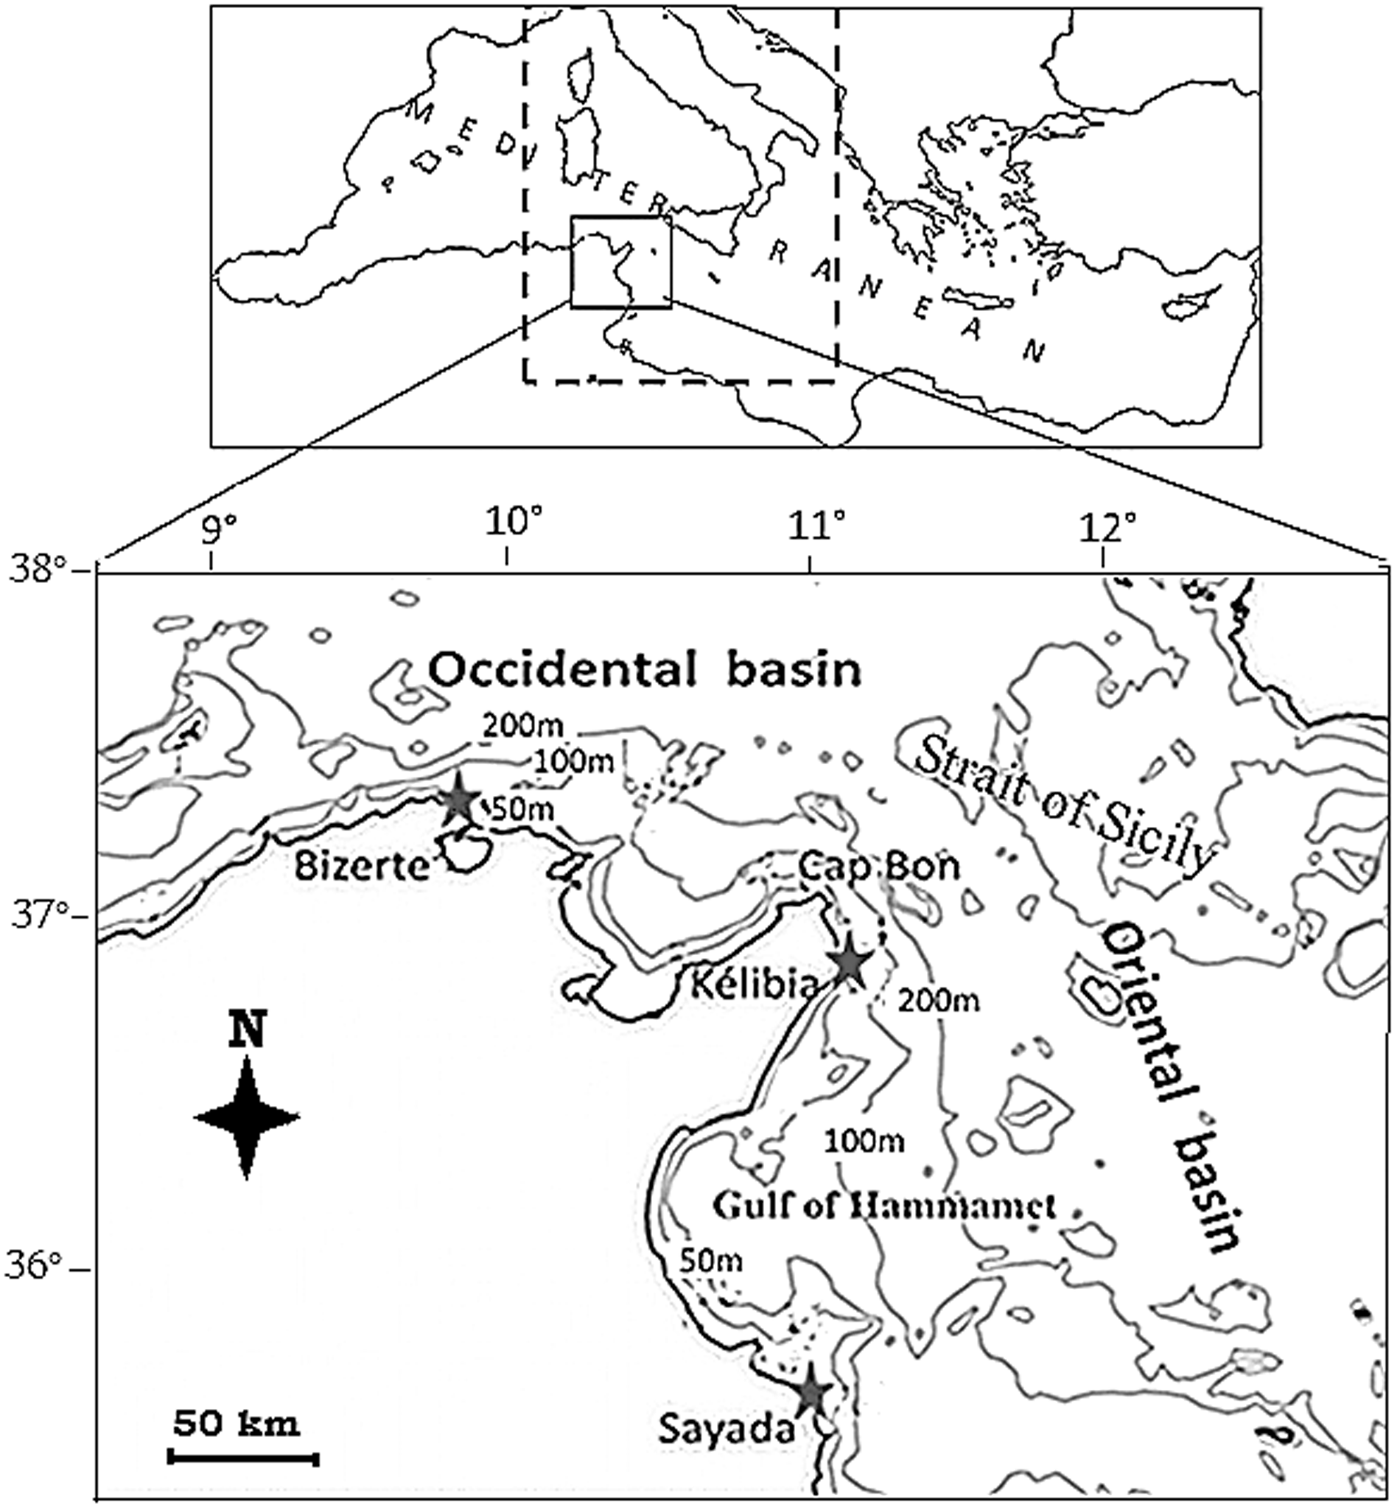
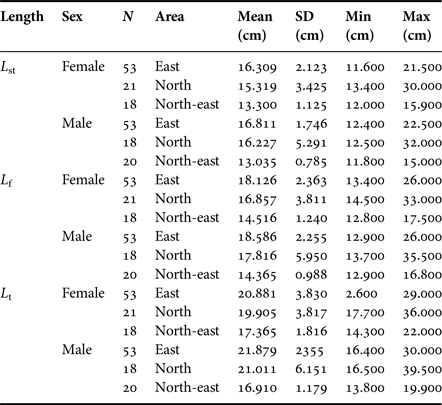
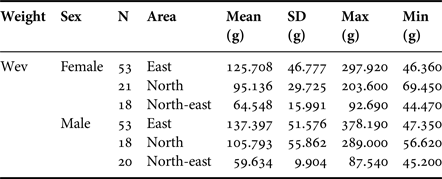
In accordance with the distribution of the species, three fishing landing sites: Bizerte (B), Kélibia (K) and Sayada (S) were chosen for the collection of samples and data along the Tunisian coast, in the south central Mediterranean Sea. Bizerte is located at 37°16′N 9°52′E and is at a distance of 188.6 km from Kélibia. Kélibia is located at 36°51′N 11°05′E and is at a distance of 211.4 km from Sayada. Sayada is located at 35°40′N 10°54′E and is at a distance of 255.9 km from Bizerte (Figure 1). A total of 183 individuals were collected (Table 1), of which 90 specimens were used for otolith shape analysis. All specimens were measured in cm (standard length L st; fork length L f; total length L t) and weighed (eviscerated fish: W ev) with a precision of 0.1 g (Table 2).
Map showing the sampling sites (star symbols).

Length characterization of specimens collected along the Tunisian coasts.

L st, standard length; L f, Fork length; L t, total length; SD, standard deviation; Max, maximum; Min, minimum.
Weight characterization of specimens collected along the Tunisian coasts.

Wev, weight of the eviscerated fish; N, number of fish; SD, standard deviation; Max, maximum; Min, minimum.
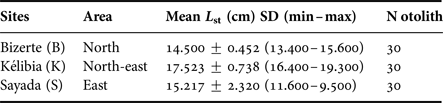
The specimens were sampled between April and June 2014, which corresponds to the reproductive period (May to July). This period allowed minimization of any mixing effects of fish due to migration between spawning areas to reduce the effects of ontogeny; the analysis was performed on a restricted range of fish lengths that included only fish between 13 and 19 cm in standard length (Table 3).
Data on otolith collected for shape analysis.

L st, standard length; SD, standard deviation; Max, maximum; Min, minimum; N, number of otoliths.
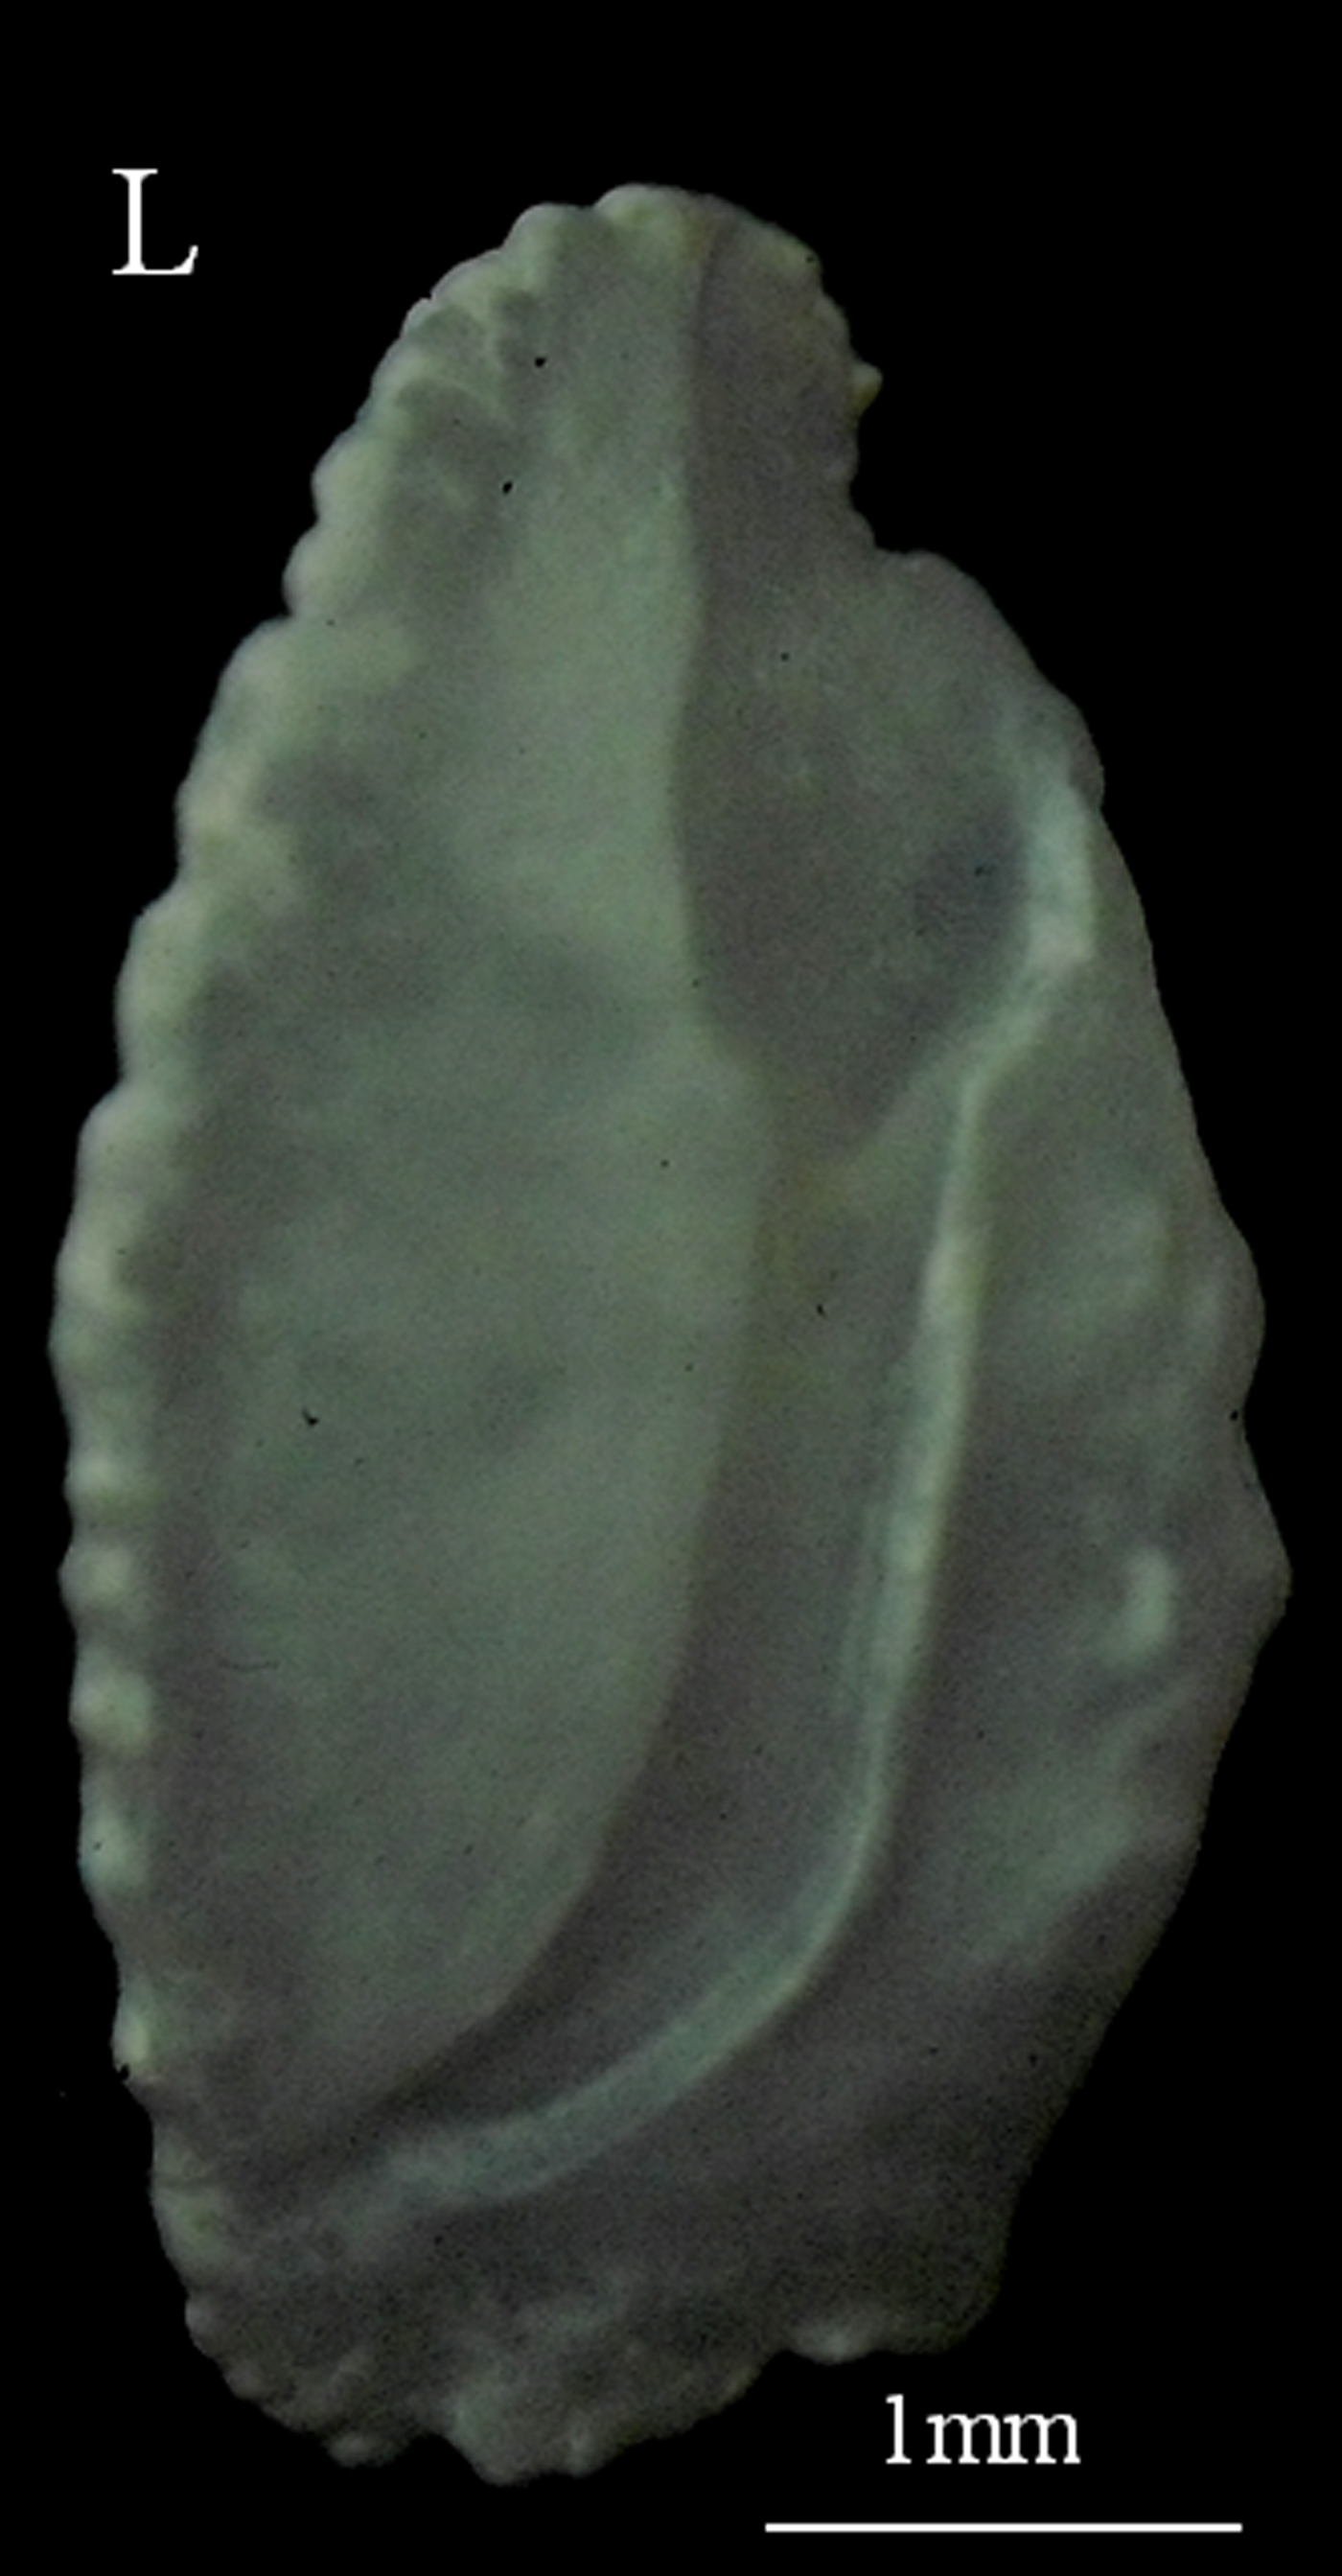
Otoliths, Sagittae left (Figure 2) were extracted, rinsed with distilled water and kept dried in an Eppendorf tube for further treatment.
The left otolith of Oblada melanura. L, left.

Image acquisition
To avoid the probable effect of a morphological asymmetry of the pair of otoliths (right and left), we choose the left otolith to conduct the shape analysis. The otolith was placed on a slide on a dark background and the outlines were digitized to minimize the distortion error using a digital camera (type Leica DFC 280) connected to a monitor with Photoshop software. All the otolith images obtained were stored in a database to be treated by the software SHAPE (Iwata & Ukai, Reference Iwata and Ukai2002). SHAPE is widely used to describe the otolith shape (Turan, Reference Turan2004; Galley et al., Reference Galley, Wright and Gibb2006; Megalofonou, Reference Megalofonou2006; Jemaa et al., Reference Jemaa, Bacha, Khalaf, Dessailly, Rabhi and Amara2015; Libungan et al., Reference Libungan, Slotte, Husebø, Godiksen and Pálsson2015; Trojette et al., Reference Trojette, Ben Faleh, Fatnassi, Marsaoui, Mahouachi, Chalh, Quignard and Trabelsi2015; Mahé et al., Reference Mahé, Oudard, Mille, Keating, Gonçalves, Clausen, Petursdottir, Rasmussen, Meland, Mullins, Pinnegar, Hoines and Trenkel2016).
Shape analysis
The shape evaluation method is based on an elliptic Fourier descriptor (EFD) that is used to delineate the shape with a closed two-dimensional contour as suggested by Kuhl & Giardina (Reference Kuhl and Giardina1982). From digital images, the program extracts the contours of the otolith and stores the information as chain code. From the chain-coded contour, the program extracts and normalizes elliptical Fourier harmonics (Hi) with respect to the first harmonic as suggested by the software. Sufficient number of harmonics has been used to reconstruct the otolith outline.
To determine the number of harmonics needed to reconstruct the otolith contour, the Fourier Power (PF), the percentage and the cumulative are calculated using formulae (1), (2) and (3).
 $${\rm FP} = \displaystyle{{A_n^2 + B_n^2 + C_n^2 + D_n^2} \over 2}$$
FP: Fourier power; A n, B n, C n, D n: coefficients of Fourier.
 $${\rm FP}\% = \left( {\displaystyle{{{\rm FP}} \over {\mathop \sum \nolimits{\rm FP}}}}\right) \times 100$$
FP%: percentage of FP.
 $${\rm F}{\rm P}_n\% _c = \mathop \sum \limits_1^n {\rm F}{\rm P}_n\% $$
FPn%c: cumulative percentage of FP.
The otolith shape of the studied samples was reconstructed at 100% of the Fourier power corresponding to the first 20 harmonics. Each harmonic was composed of four coefficients, which correspond to values of the projection of the binary image on the two axes (X) and (Y) (Kuhl & Giardina, Reference Kuhl and Giardina1982). A total of 80 coefficients were allocated to each otolith.
Statistical analysis
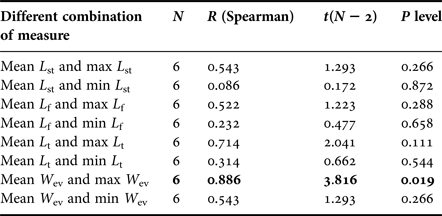
A non-parametric test, the Spearman's rank correlation coefficient (Gibbons, Reference Gibbons1985), was carried out between the mean and the maximum and the minimum of length (L st, L f, L t) and weight (W ev) to evaluate the effect of sampling on the variability of these different measures.
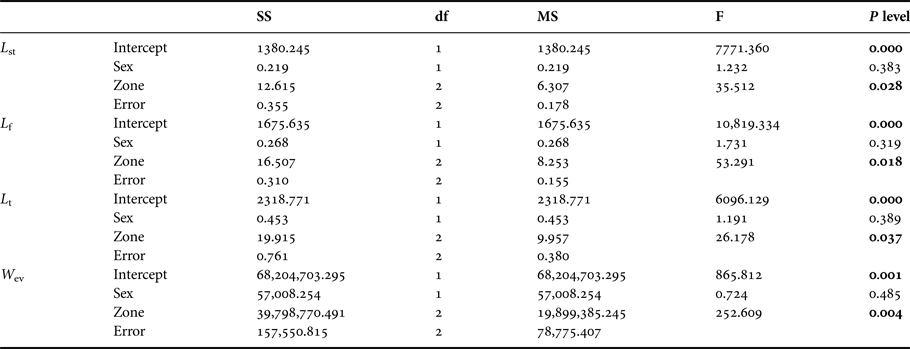
An analysis of variance test (ANOVA) of the applied General Linear Model (GLM) was carried out to evaluate the significance of differences in mean length (L st, L f, L t) and weight (W ev) according to sex and sampling site.
The normality distribution of the three groups was performed using the Shapiro–Wilk's test.
An analysis using covariance test (ANCOVA) was applied to test for significant differences in the length-weight relationship by area.
To determine whether otoliths collected in three sites could be distinguished based on their shapes, two multivariate analyses were used, allowing the visualization of shape variations corresponding to the otolith: (1) a principal component analysis (PCA) (Rohlf & Archie, Reference Rohlf and Archie1984) and (2) a discriminant factor analysis (DFA) were performed using the variance-covariance matrix of the coefficients.
RESULTS
The analysis of the different fish length measures (L st, L f, L t) and weight (W ev) according to sex and sampling site are shown in Table 4. The lengths of the three fish samples showed, statistically, non-significant differences between the mean length and the maximum as well as the mean length and the minimum. However, in weight, a significant effect was observed between the mean weight and the maximum of the eviscerated fish, against significant differences between the mean weight and the minimum.
Spearman correlation and test of significance between the mean and the maximum and minimum measures.

L st, standard length; L f, Fork length; L t, total length; W ev, weight of the eviscerated fish.
Given this reason, the analysis of otolith shape was realized for a limited interval to eliminate the sample effect on results for the three sampling sites. The analysis of variance test (ANOVA) of the applied General Linear Model (GLM) showed that the fish mean length differed statistically between the sampling areas but was not affected by the sex (Table 5).
ANOVA test showing the sex and the sampling area effect on different measure.

L st, standard length; L f, Fork length; L t, total length; W ev, weight of the eviscerated fish.
For the three groups, the Shapiro–Wilk's test showed that all specimens from Bizerte (W = 0.978, P < 0.778) and Kélibia (W = 0.950, P < 0.168) come from a normally distributed population, however, individuals coming from Sayada (W = 0.923, P <0.032) do not show a normal distribution.
Moreover, the length-weight relationship between standard length and eviscerated weight was showing a significant difference between the different areas (P = 0.0177).
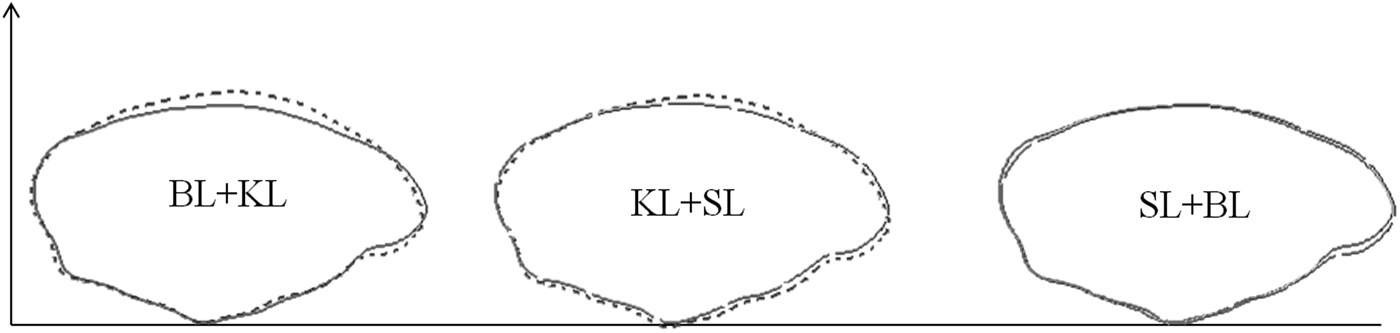
The standardized elliptic Fourier coefficients of 90 otoliths from the three areas were calculated. The mean otolith shape of Oblada melanura was then drawn using the mean values of the standardized elliptic Fourier coefficients for each area, showing a variation of the otolith shape (Figure 3).
Mean left otolith shapes of Oblada melanura sampled in three areas. B: Bizerte (solid line); K: Kélibia (dotted line) and S: Sayada (dashed line).

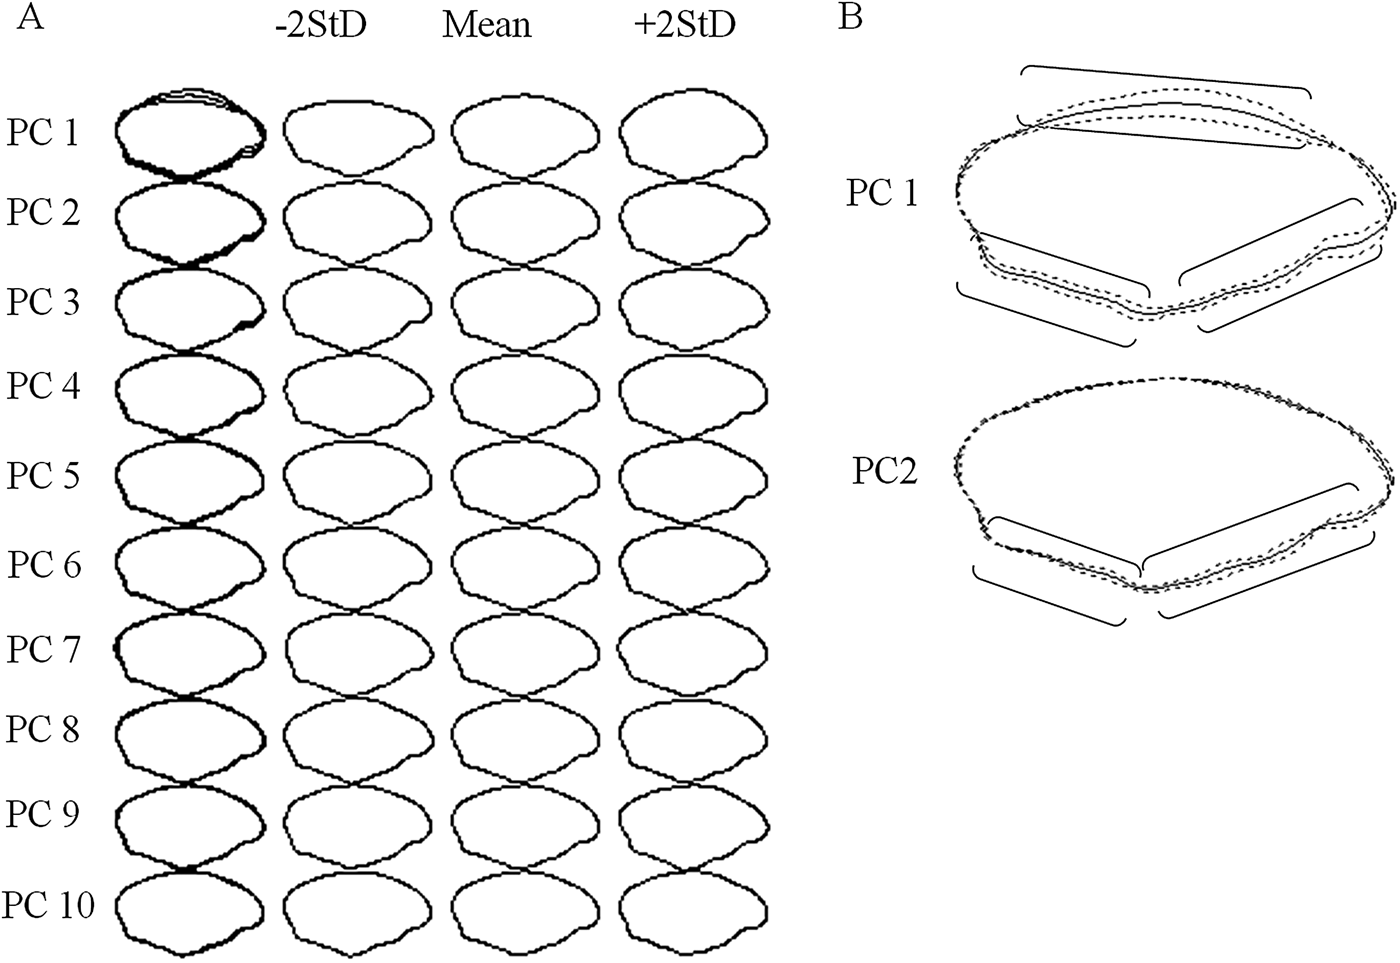
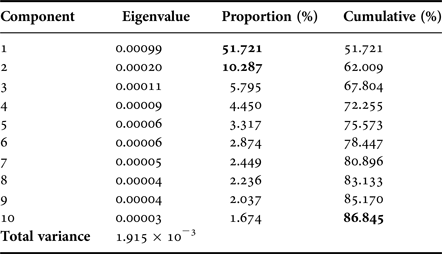
The 10 principal components provide a summary of the data, accounting for 87% of the total variance (Table 6, Figure 4). The effect of each principal component on otolith shape was visualized (Figure 4A). These reconstructed shapes indicate that the first principal component is good measure of the dome dorsal, the dome posterior ventral and the dome anterior ventral and expresses the depth of notch of the side of the dome anterior ventral parts of the otolith (Figure 4B). The second component is associated with the dome posterior ventral and the dome anterior ventral part of the otolith (Figure 4B). From the third to the 10th component, the variation is not easily explained (Figure 4A).
Effect of each 10 and the two main principal components on otolith shape. (A) The columns show from the right the case where the score takes +2 SD, mean, and −2 SD as presented, and in the left of (A), the last column showing the overlaid drawings of all three cases for each 10 principal component (PC) where the mean is drawn by solid line, −2 and +2 SD (standard deviation) is drawn by dot line. (B) Effect of two main principal components on otolith shape with the localization of shape variation accounted by the principal component.

Eigenvalues and contributions of principal components realized for otolith shape for Oblada melanura sampled in three areas.

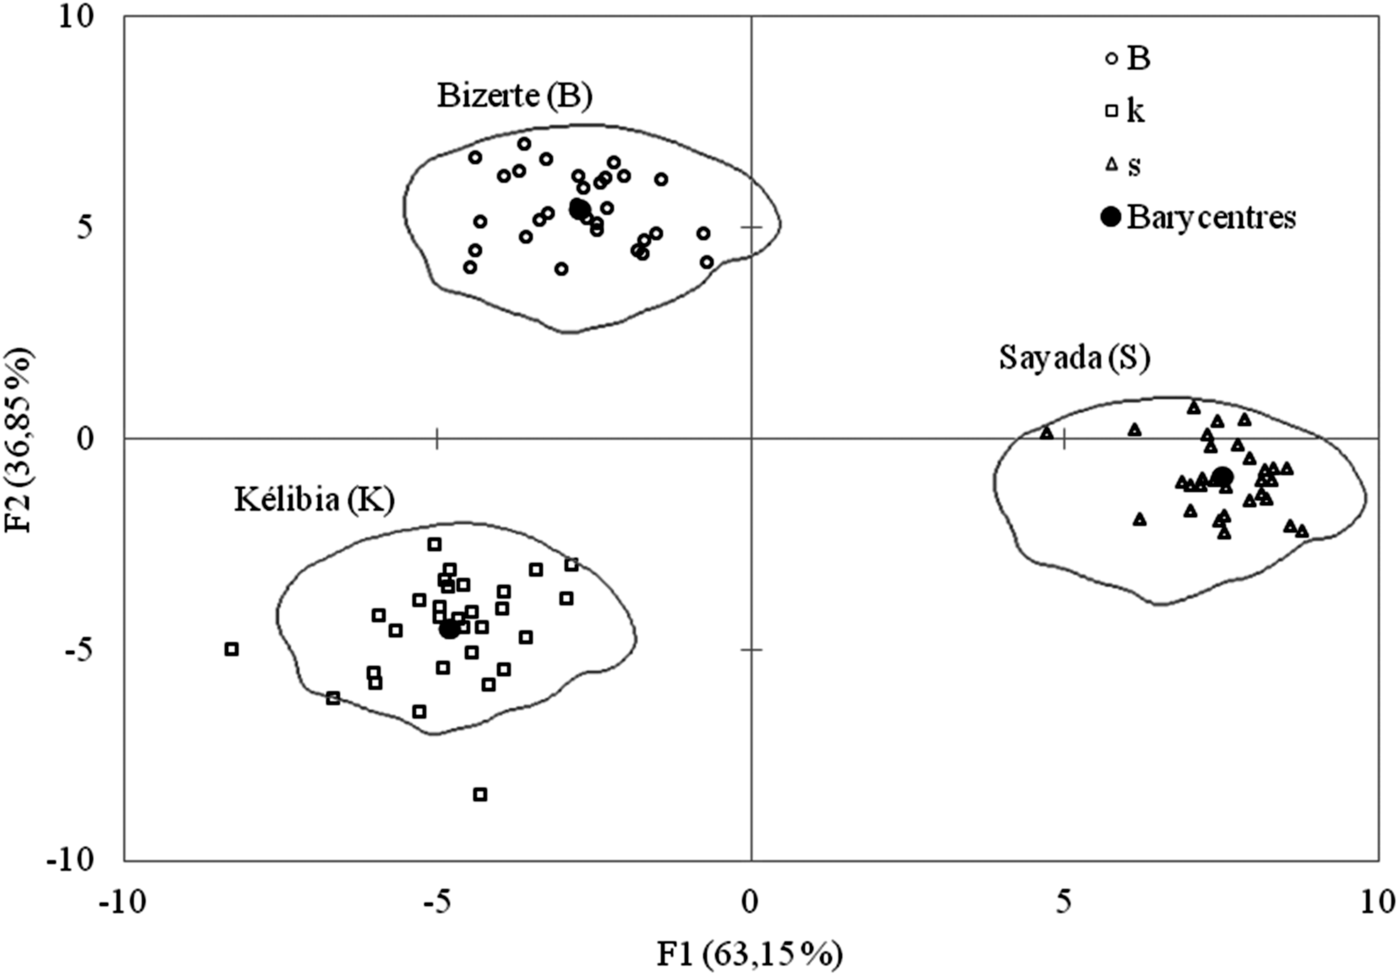
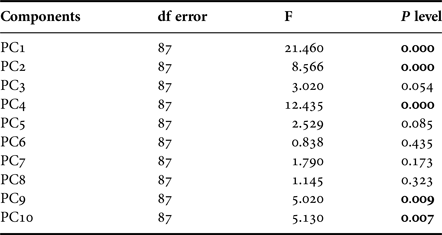
Table 7 shows the results of the ANOVA performed on the principal component scores of groups as well as the sampling area. The shape variation shown in Figure 3 was significant for the two first, the fourth and the two last principal components, as was confirmed by the discriminant factor analysis (DFA) (Wilk's lambda = 0.002, F = 1.826, P < 0.001, Figure 5). According to per cent correct classification, 100% of samples were correctly classified indicating that otoliths differed from the northern to the eastern coasts of Tunisia.
Graphical representation of discriminant factor analysis for the classification of Oblada melanura left otolith according to the sampling areas based on normalized elliptic Fourier descriptor with the mean shape for each region.

Results of ANOVA for the first 10 principal components (PC) of group coefficients and sampling area.

DISCUSSION
According to our results, considering the length, the weight and the sex effect on the samples, the shape analysis of the otolith showed three groups within the Oblada melanura sampled in the north (Bizerte), the north-eastern (Kélibia) and the east (Sayada) of Tunisian coast.
The analysis was performed for a limit interval of standard length covering 13 and 16 cm corresponding to the adult fraction of Oblada melanura. This choice was helpful to decrease the bias introduced by ontogeny impact on the otolith shape analysis as has been demonstrated at earlier stages for deep-sea eels, whose otolith characteristics occur in the adult stage (Hecht & Appelbaum, Reference Hecht and Appelbaum1982). Saddled bream adults, in contrast with juveniles, do not exhibit any important migration (Gkafas et al., Reference Gkafas, Tsigenopoulos, Magoulas, Panagiotaki, Vafidis, Mamuris and Exadactylos2013). Indeed, at an advanced age, juveniles extended their home range vertically into deeper zones, and laterally in more exposed areas (Harmelin-Vivien et al., Reference Harmelin-Vivien, Harmelin and Leboulleux1995). Along the coastline, this dispersion is limited to 90 km, only for a short period in the pelagic environment (Calò et al., Reference Calò, Di Franco, De Benedetto, Pennetta, Pérez-Ruzafa and García-Charton2016a). Our analysis, carried out during the spawning period, could support the absence of any eventual populations mixing (Cardinale et al., Reference Cardinale, Doering-Arjes, Kastowsky and Mosegaard2004).
Basing on the genetic structure of Oblada melanura, Calò et al. (Reference Calò, Muñoz, Pérez-Ruzafa, Vergara-Chen and García-Charton2016b) suggested a local connectivity between protected and unprotected areas (50–100 km) of the west Mediterranean. Meanwhile, more distant areas have revealed a genetic clustering. The three sites studied here are far away from each other. Taking into account the environmental factors which impact some inter- and intra-specific otolith differences (Lombarte, Reference Lombarte1992) and the genotypic aspects which specify the otolith morphology, Avigliano et al. (Reference Avigliano, Jawad and Volpedo Alejandra2015) revealed that the method of otolith shape analysis applied for this study was among the successful tools for stock discrimination (Campana & Casselman, Reference Campana and Casselman1993; Burke et al., Reference Burke, Brophy and King2008; Cañás et al., Reference Cañás, Stransky, Schlickeisen, Sampedro and Farinã2012; Avigliano et al., Reference Avigliano, Martinez and Volpedo2014) of different species worldwide (Begg & Brown, Reference Begg and Brown2000; Begg et al., Reference Begg, Overholtz and Munroe2001; Brophy & Danilowicz, Reference Brophy and Danilowicz2002; Turan, Reference Turan2004; Galley et al., Reference Galley, Wright and Gibb2006; Megalofonou, Reference Megalofonou2006; Mérigot et al., Reference Mérigot, Letourneur and Lecomte-Finiger2007; Duarte-Neto et al., Reference Duarte-Neto, Lessa, Stosic and Morize2008; Renán et al., Reference Renán, Pérez-Díaz, Colás- Marrufo, Garza- Pérez and Brulé2010; Vieira et al., Reference Vieira, Neves, Sequiera, Paiva and Gordo2014; Jemaa et al., Reference Jemaa, Bacha, Khalaf, Dessailly, Rabhi and Amara2015; Libungan et al., Reference Libungan, Slotte, Husebø, Godiksen and Pálsson2015; Jawad et al., Reference Jawad, Hoedemakers, Ibáñez, Ahmed, Abu El-Regal and Mehanna2017; Mapp et al., Reference Mapp, Hunter, Van Der Kooij, Songer and Fisher2017).
Boundaries extraction of otoliths have been carried out with different methods such as Fourier transforms (Begg & Brown, Reference Begg and Brown2000), the Wavelets, the Curvature-Scale-Space (Parisi-Baradad et al., Reference Parisi-Baradad, Lombarte, García-Ladona, Cabestany, Piera and Chic2005) and the more recent Shapelet transform methods (Hills et al., Reference Hills, Lines, Baranauskas, Mapp and Bagnall2014). However, according to Cadrin & Friedland (Reference Cadrin and Friedland1999), Fourier analysis is an efficient method for describing contour shapes. The elliptical Fourier descriptors were successful applied to Oblada melanura stock in the south central Mediterranean.
Our findings are consistent with those relating to other species (Campana & Casselman, Reference Campana and Casselman1993; Duarte-Neto et al., Reference Duarte-Neto, Lessa, Stosic and Morize2008; Renán et al., Reference Renán, Pérez-Díaz, Colás- Marrufo, Garza- Pérez and Brulé2010; Vieira et al., Reference Vieira, Neves, Sequiera, Paiva and Gordo2014; Jemaa et al., Reference Jemaa, Bacha, Khalaf, Dessailly, Rabhi and Amara2015). Elliptic Fourier descriptors (EFD) and principal component analysis (PCA), using SHAPE, can accurately detect small shape variations and evaluate the shape independently of size (Iwata et al., Reference Iwata, Niikura, Matsuura, Takano and Ukai1998; Yoshioka et al., Reference Yoshioka, Iwata, Ohsawa and Ninomiya2004).
The morphology of the otolith varies clearly between species and within species from different regions (Campana & Casselman, Reference Campana and Casselman1993; Lombarte & Lleonart, Reference Lombarte and Lleonart1993; Renán et al., Reference Renán, Pérez-Díaz, Colás- Marrufo, Garza- Pérez and Brulé2010). The sampled Oblada melanura specimens in the south central Mediterranean presented a clear discrimination between three different Tunisian areas. This result corroborates with genetic diversity and morphometric analyses conducted in different Mediterranean regions as was reported for the same species in the Aegean Sea (Gkafas et al., Reference Gkafas, Tsigenopoulos, Magoulas, Panagiotaki, Vafidis, Mamuris and Exadactylos2013) and in the western Mediterranean (Calò et al., Reference Calò, Muñoz, Pérez-Ruzafa, Vergara-Chen and García-Charton2016b). Similar findings dealing with high levels of genetic diversity of Oblada melanura were observed in gilthead sea bream (Sparus aurata) in Tunisia (Ben Slimen et al., Reference Ben Slimen, Guerbej, Ben Othmen, Ould Brahim, Blel, Chatti, El Abed and Said2004) and Italy (Franchini et al., Reference Franchini, Sola, Crosetti, Milana and Rossi2011).
Several factors are responsible for the group separation among the species, such as the habitat and the environmental conditions (Cardinale et al., Reference Cardinale, Doering-Arjes, Kastowsky and Mosegaard2004). In fact, Bizerte belongs to the western Mediterranean basin; Kélibia and Sayada belong to the eastern Mediterranean basin. The two basins are separated by the Siculo-Tunisian strait characterized by different climatic conditions, current systems and hydrological regimes (Bethoux, Reference Bethoux1979; Borsa et al., Reference Borsa, Naciri, Bahri, Chikhi, Garcia De Leon, Kotoulas and Bonhomme1997; Bas, Reference Bas2009). Oblada melanura is among the species characterized to be sensitive to temperature, salinity and the consumption of oxygen (Antolović et al., Reference Antolović, Kožul, Safner, Glavić, Bolotin and Milan2011). Although the samples from Sayada and Kélibia belonged to the same side, the eastern marine zone, the two groups are different. This could be explained by a second factor – the diet. According to Cardinale et al. (Reference Cardinale, Doering-Arjes, Kastowsky and Mosegaard2004) the diet may also influence otolith morphology. From Kélibia to Sayada, the food choice of Oblada melanura could be different because this species is an opportunistic predator (Pallaoro et al., Reference Pallaoro, Šantić and Jardas2003). The diets of several species have been shown to have an impact on otolith morphology (Ward & Rogers, Reference Ward and Rogers2003; Gagliano & McCormick, Reference Gagliano and McCormick2004; Hüssy, Reference Hüssy2008). In addition to ecological factors, geneticss can be considered to be a third but not significant factor (Galley et al., Reference Galley, Wright and Gibb2006) for populations of the same species (Cardinale et al., Reference Cardinale, Doering-Arjes, Kastowsky and Mosegaard2004).
The study of otolith silhouettes using the elliptic Fourier descriptor and multivariable analyses has successfully shown to be a tool for stock management (Campana & Casselman, Reference Campana and Casselman1993; Cardinale et al., Reference Cardinale, Doering-Arjes, Kastowsky and Mosegaard2004; Galley et al., Reference Galley, Wright and Gibb2006; Pothin et al., Reference Pothin, Gonzalez-Salas, Chabanet and Lecomte-Finiger2006; Vieira et al., Reference Vieira, Neves, Sequiera, Paiva and Gordo2014). From north to east of the Tunisian marine zones, shape analysis of Oblada melanura otoliths has demonstrated that there exists a significant discrimination presenting a heterogenic population depending mainly on the environmental factors, habitat and on the diet. This result will be very useful for stock management of Oblada melanura in the future for the conservation of this resource, by considering the ecological boundaries and not the political limits. In addition, this species is considered among the Sparidae exploited along the Tunisian coast by small-scale fisheries.
ACKNOWLEDGEMENTS
We acknowledge the commercial fishermen. We also thank the anonymous reviewers for their comments to improve the manuscript.