


1. Introduction
The impact of atmospheric aerosols on global climate, radiation budget and biogeochemical cycles has come to be recognised recently. They can exert direct effects on climate by absorbing or scattering sunlight radiation. Aerosol particles can also affect the atmospheric radiation balance by acting as cloud condensation nuclei, modifying cloud radiative properties and cloud lifetimes (Reference CharlsonCharlson and others, 1992).
The Antarctic continent is situated far from important sources of anthropogenic pollution, and so is an ideal site for assessing trends in the concentration of several trace elements, both regionally and globally, by means of long-term studies. in particular, the Antarctic Peninsula is a good site for studying the properties of marine aerosol particles (Artaxo and others, 1990) because it is surrounded by ocean and has a very low soil-dust load (Reference FitzgeraldFitzgerald, 1991).
There are several mechanisms responsible for the production of marine aerosols (Reference Arimoto, Ray, Duce, Hewitt, Boldi and HudsonArimoto and others, 1990; Reference SieveringSievering and others, 1991). of special concern is the sulphur cycle and the significant excess sulphate observed over marine regions, due to optical properties which can influence the radiation budget and to the possibility that these particles act as cloud condensation nuclei (Reference SchwartzSchwartz, 1988). Sulphur-bearing particles consist, in the vast majority, of sulphates. They are produced by several mechanisms of heterogeneous sulphur conversion, including oxidation of dimethyl sulphide produced by biogenic processes.
There are reports of the enrichment of heavy metals at the air-sea interface (Arimoto and others, 1990). Besides the long-range transport of anthropogenic aerosols, biogenic agents may be responsible for part of these enrichments. Among the suggested processes are low-temperature volatilisation processes such as biological methylation, emissions from plants (Reference Cattell and ScottCattell and Scott, 1978) and metabolisation of heavy metals at the sea-air interface by bacteria, phyto-plankton and Zooplankton (Reference Duce, Quinn, Olney, Piotrowicz, Ray and WadeDuce and others, 1972).
This paper reports on concentration measurements made ๒ the fine (rip < 2.0μm, where dp is the aerodynamic diameter of the particle) and coarse (2.0μm < dp < 10μm) particle-size modes of atmospheric aerosol particles collected continuously from 1985 to 1993 on the Antarctic Peninsula. The elemental concentrations were measured by particle-induced X-ray emission (P1XE), and the datasets obtained were examined by principal-factor and cluster analyses.
2. Experimental Procedure
2.1. Sampling site and procedures
The sampling station is located at the Brazilian Antarctic station, Comandante Ferraz (62°05' S, 58°23.5'W), on King George Island, in Admiralty Bay, Antarctic Peninsula. The sampling site is upwind of local sources, about 1 km from the main station, and is located about 300 m from the coast. The station was operated continuously from 1985 to 1993, including during winter. Aerosol particles were collected with stacked filter units (SFUs), yielding a total of 301 samples in the fine and coarse particle-size modes. Particles in the coarse particle-size mode (2μm < dp < 10 μm) were sampled on a 47 mm diameter, 8 μm porc-size apiezon-coated filter, while a 0.4 μm pore-size filter collected the particles in the fine particle-size mode (dp < 2 μm). The collection time per SFU sample was 5-8 days.
2.2. Gravimetric analysis
The fine and coarse particle-size fractions of aerosol mass concentrations were obtained by gravimetric analysis of the filters, which were weighed before and alter sampling in an electronic microbalance with 1μg sensitivity. Before weighing, the filters were equilibrated for 24 hours at 50% relative humidity and 20μC. The detection limit for the aerosol mass concentration is typically 0.3 μ m −3 and the precision is estimated at about 15%. The coarse particle-size mode aerosol mass concentration is termed CPM, and the fine particle-size mode aerosol mass concentration FPM.
2.3. Elemental concentration measurement
The elemental concentrations were measured by PIXE. The samples were irradiated by a 2.4 MeV proton beam, supplied by the isochronous cyclotron of the University of Gent. Details of the experimental set-up are given elsewhere (Maen-haut and Raemdonck, 1984; Maenhaut and others, 1987). The following 23 elements were detected in the samples: Na, Mg, Al, Si, p, S, Cl, K, Ca, Ti, V, Cr, Mn, Fe, Ni, Cu, Zn, Se, Br, Rb, Sr, Zr and Pb. The detection limit was typically 5 ng m −3 for elements with z< 20, and 0.1 ng m −3 for 21 < z< 30. The precision of the PIXE analysis was better than 3% for the major elements, and about 10% for elements with concern rations near the detection limit.
3. Principal Factor Analysis and Cluster Analysis
With the principal factor analysis (PFA) procedure it is possible to build a qualitative source profile using correlations between the measured elemental concentrations (Reference HarmanHarman, 1976). in cluster analysis, the samples are grouped on the basis of geometric criteria involving their elemental concentrations (Reference HopkeHopke, 1991). The more similar two samples are considered to be, the more likely they are to be composed of particles from the same source. These analyses provide independent ways of assessing qualitatively the sources of the atmospheric aerosol.
4. Results
Table 1 shows the average elemental concentrations for all the samples which were above the detection limit for the fine and coarse particle-size modes. The non-sea-salt sulphur (NSSS) concentration is calculated by subtracting the sea-salt sulphur from the total sulphur concentration, taking CI as sea-salt reference element, according with sea-water composition data from Reference Riley and ChesterRiley and Chester (1971). The first column shows the average concentration measured on all samples; the second and third columns show the average on the samples collected during austral summer and winter, respectively. Summer was defined as the period from 1 October JD 274) to 31 March (JD 90), winter as the period from 1 April to 30 September.
Sea-salt elements predominate in both line and coarse particle-size modes. Most of the elements usually associated with soil-dust particles show very low concentrations. The concentrations of some trace elements which could be associated with anthropogenic activities (e.g. Cr, Ni, Cu, Pb) appear low and are affected by regional contributions, since in the region there are transport vehicles and equipment, like diesel generators, that contribute emissions of these elements. There is a seasonality of the average concentrations in both size modes, with most of the summer averages greater than the winter ones. The concentrations of sea-salt elements are lower during winter due to sea-ice formation on the nearby ocean. This seasonality is contrary to observations at most sites situated far inside the Antarctic continent, where the long-range transport mechanism is greatly improved during winter due to strong storms throughout the continent.
Average elemental concentrations for fine and coarse modes of Antarctic aerosol
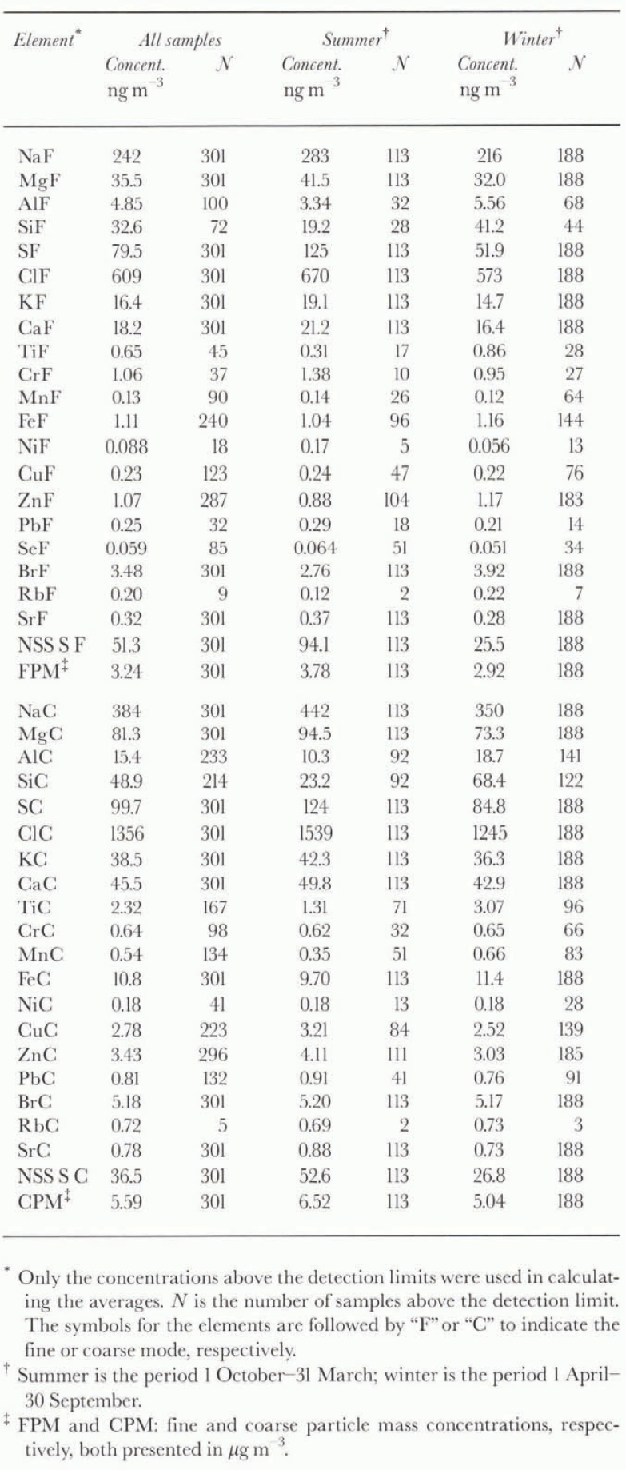
There are relatively few studies reporting elemental concentrations in aerosols collected on coastal sites in Antarctica. The comparisons are not easy to perform, since the measurements are made with different techniques and sampling equipment. in the work of Reference Lawson and WinchesterLawson and winchester (1978, Reference Lawson and Winchester1979) the sulphur concentration in the fine particlesize mode on the southern tip of South America was measured in the range 52-98 ng m −3. The yearly average of 79.5 ng m−3 in this paper falls within this range, the winter average of 51.9 ng m −3 being near the lower limit, and the summer average of 125 ngm−3 somewhat above the higher limit. in Samoa (14° S, 170.5° W) the same authors reported 60ngm −3 for sulphur in the fine particle-size mode and 87ngm −3 for that in the coarse particle-size mode. The measured wintertime fine and coarse particle-size mode averages are near these values. Reference Savoie and ProsperoSavoie and Prospero (1989) reported concentrations of non-sea-salt sulphate ranging from 220 to 400 ng m −3 at various remote sites in the South PacifiC. The results in this paper are near that range: assuming all sulphur to be in the form of sulphates, the yearly average concentration of non-sea-salt sulphate was estimated as 263 ng m−3, with averages of440 ng m −3 during summer and 157 ng m −3 during winter.
Particulate-matter time series.

Averages of non-sea-salt sulphate concentrations for three Antarctic stations were reported by Prospero and others (1991): the yearly mean concentration was 90ngm at Mawson (67°36 S, 62°53' E), 71 ngm −3 at George von Neumayer (GvN; 70°37' S, 08°22' W) and 83 ngm−3 at the South Pole. Non-sea-salt sulphate at Mawson amounted to about 160ngm −3 during summer, and about 30ngm −3 during winter. At GvN, Reference Wagenbach, Görlach, Moser and MúnnichWagenbach and others (1988) reported a summer av erage of about 200 ng m−3. For the South Pole, Reference Bodhaine, Deluisi, Harris, Houmere and BaumanBodhaine and others (1986) reported a winter average of about 30 ngm −3, based on measurements taken during 2 months. Reference Harvey, Fisher, Lechner, Isaac, Flower and DickHarvey and others (1991) reported a summer average of about 340 ngm −3 at Ross Island (77°51'S, 166°45'E), based on 20 days of measurements. From the above, it is seen that the non-sea-salt sulphate concentration values at King George Island are more similar to those in the South Pacific than to those at the other Antarctic sites presented.
Figure 1 shows the time series of fine and coarse particle-size modes of the aerosol mass concentration. Overall, there is little seasonal pattern, although the FPM series seems to bear more resemblance to the changing of the seasons than does the CPM series. Typically the FPM concentration is about 3.78 ng m −3 during summer and 2.92 ng m−3 during winter, and the CPM concentration is about 6.52 ng m −3 during summer and 5.04 ng m −3 during winter.
Figure 2 shows the time series of the NSS S in both particle-size fractions. The fine particle-size mode presents a clear seasonality, in accordance with other studies ( Wagenbach ami others, 1988; Prospero and others, 1991), whereas in the coarse particle-size mode this seasonality is less clear. Typically the NSS S concentration in the fine particle-size mode is about 94.1 ng m −3 during summer and 25.5 ng m −3 during winter. For the coarse particle-size mode the typical concentration values are nearly 52.6 ng m −3 during summer and 26.8 ngm −3 during winter.
Non-sea-salt sulphur time series.

The mass fraction of NSS s on the total measured sulphur was computed for both particle-size modes. in the fine particle-size mode the mass fraction averages 75% during summer and 49% during winter. For the coarse particle-size mode the NSS S accounts for an average of 42% of the total sulphur during summer and for an average of 32% during winter. The NSS S in the fine particle-size mode has a biogenic origin. The coarse particle-size mode NSS s originates mainly from reactions of gaseous sulphur on already existing coarse particle-size mode aerosol particles.
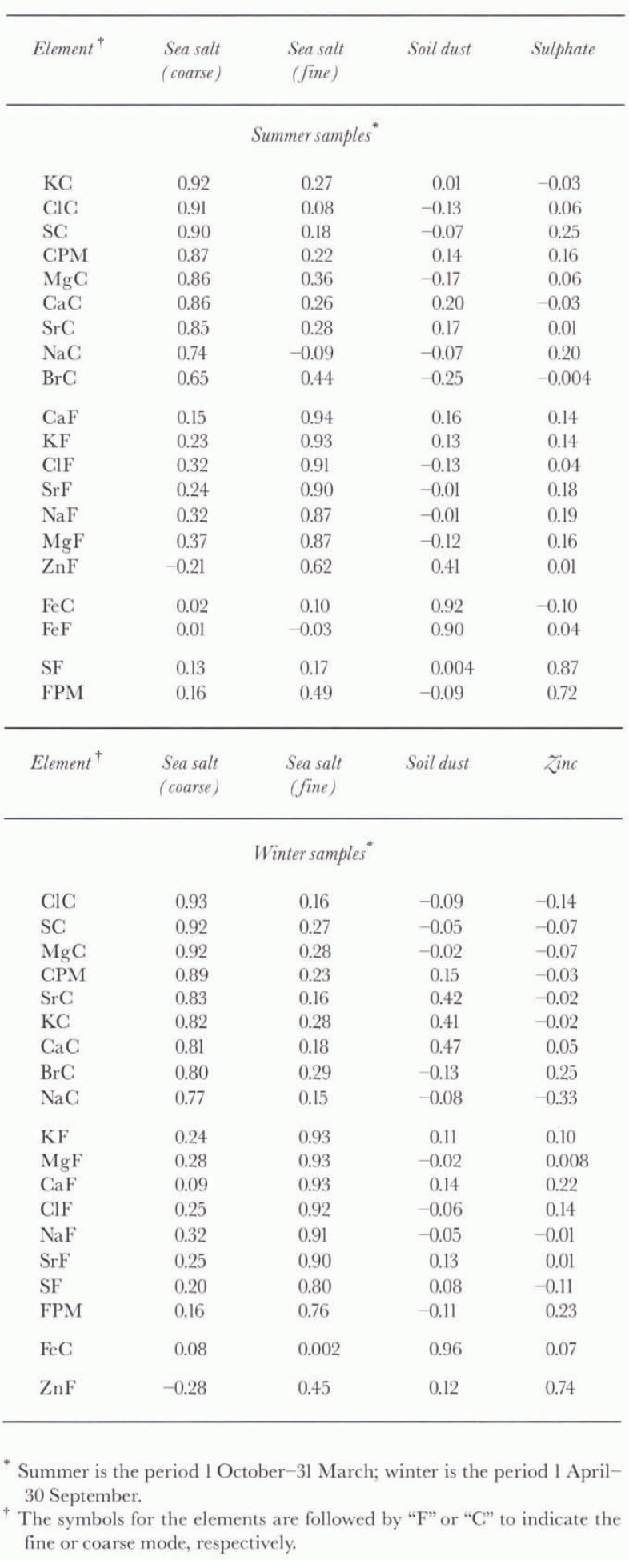
Three PFAs of the elemental concentrations measured were performed: the first considering all the samples collected; the second those collected during summer; and the third those collected during winter. in these three analyses, concentrations of fine and coarse particle-size modes were included. Elements which could be associated with local pollution sources, such as Pb and Cu, were not used. in all three cases, four factors were retained, and they explained nearly 86% to 89% of the data variability. The upper part ofTable 2 shows the factor-loading matrix after the Varimax rotation for the PFA of the samples collected during summer, and the lower part of Table 2 shows the loadings for the samples collected during winter. For both cases the first factor was identified with sea-salt aerosol in the coarse particle-size mode due to the high loadings for the elemental concentrations of K, Cl, S, Mg, Ca, Sr, Na and Br (all in the coarse-particle mode), and also for the CPM. Also for both analyses, the second factor presented high loadings for the elemental concentrations of Ca, K, Cl, Sr, Na and Mg, all in the fine-particle mode, and thus it was identified with sea-salt aerosols in the fine particle-size mode. The third factor was associated with soil-dust aerosol, for the only significant factor loadings were the ones corresponding to the Fe concentration, in both summer and winter. For the summer samples, the last factor presented high loadings for the concentration of sulphur in the fine particle-size mode and, to a lesser extent, for the FPM. This shows that the variability of sulphur in the fine particle-size mode is itself independent of the variability of the fine-mode sea-salt aerosol (second factor), and also that the sulphur concentration variability has a greater importance for the FPM variability than does the fine-mode sea-salt concentration. On the other hand, during winter the variability of both FPM and the fine sulphur concentration is closely associated with the variability of fine-mode sea-salt elements. This kind of seasonality is in accordance with the conjectured biogenic origin of the fine-mode NSSS: during summer, biogenic activity is at a maximum, and the fine-mode NSS S presents a variability which is independent of the fine-mode sea-salt variability. During winter, biogenic activity is at a minimum, such that the fine-mode NSS S variability cannot be further distinguished from the fine-mode sea-salt variability. Also for the winter samples it is shown that the variability of the Zn concentration in the fine particle-size mode is independent of the variability of the other elements, although it has a moderate loading corresponding to the sea-salt aerosol factor in the fine particlc-size mode. This means that part of the Zn is sea-water-related, but there is still a fraction of it that could come from long-range transported anthropogenic sources. The results of these PFAs agree in general with a previous study in which a similar datasct collected until 1988 was analyzed (Artaxo and others, 1992).
Varimax-rotated factor-loading matrix for concentra-tions of the elements present in samples of atmospheric aerosol from the Antarctic Peninsula collected during summer and winter
Cluster analysis of the aerosol samples.

Three cluster analyses were performed, the first considering all the samples collected, and the second and third considering separately the summer and winter samples, respectively. The upper part of Figure 3 shows the dendrogram of the cluster analysis for the summer samples. There is good agreement between this analysis and the PFA: all the coarse particle-size mode sea-salt-related elements identified by the PFA were grouped together in the cluster analysis, the same occurring for the soil-dust and sulphate factors. in the fine particle-size mode sea-salt cluster it can be seen that the Zn concentration is relatively distant from the others, which is in accordance with the PFA since this was the variable with the smallest loading of those related to the fine particle-size mode sea-salt factor. The lower part of Figure 3 shows the dendrogram obtained by the cluster analysis of the winter samples. Aga in the results coincide with the PFA classification.
All the elements which were identified with the coarse particle-size mode sea-salt aerosol source by the PFA were also grouped together in the cluster analysis. The same occurred for the faptors identified with fine particle-size mode sea salt and soil dust, and for the factor associated with Zn.
5. Conclusions
Sea-salt elements predominate in the Antarctic Peninsula aerosol particles. The sulphur concentrations and the non-sea-sall sulphates measured in this paper are similar to those presented by other authors. The NSS S showed a clear seasonal pattern in the fine particle-size mode, probably due to biogenic activities, and its average mass fraction in the total sulphur measured is 75% during summer and 49% during winter. The variability in the concentration of NSS S in the coarse particlc-size mode is partly explained by heterogeneous sulphur conversion on the surface of existing coarse particle-size mode aerosol particles. in this particle-size fraction the NSS S contributes an average of 42% of the total sulphur during summer and 32% during winter. Relatively high concentrations were observed for some heavy metals (Pb, Ni and others) that are the result of regional or long-range-transported anthropogenic air pollution.
PFAs explained nearly 87% of the total variability of the data. During summer, the four factors retained correspond to sea-salt aerosol in the coarse and fine particle-size modes, soil dust and sulphates. in this case, the FPM variability was associated with the sulphur concentration variability in the fine particle-size mode, showing the importance of the sulphur compared to the sea-salt elements concentration variability in this particle-size fraction. This is of special relevance since the sulphur aerosol particles have a well-recognised role in processes related to global-change concern, mainly in the line particle-size mode range. During winter, the four factors retained correspond to sea-salt aerosol in the coarse and fine particlc-size modes, soil dust and zinC. in the fine particle-size mode, the variabilities of the sulphur and the mass concentrations could not be distinguished from the variabilities of the concentrations of the sea-salt-related elements. This may be due to the seasonality of biogenic activities, which are low during winter and could not explain a significant fraction of the variability of the FPM as they did during summer. Cluster analyses were performed and they confirmed the PFAs done, also affording a visual approach in which the dissimilarities of the variables within each cluster or factor can be directly assessed.



