

Introduction
Understanding the past behaviour of the Antarctic Ice Sheet and its contribution to sea level change is an important challenge for scientists and policymakers that requires models that can make reliable, robust predictions of future change. One obstacle in addressing this challenge is the lack of information on past ice sheet behaviour. Ice sheets have long but variable response times to external forcing and so, to have confidence in ice sheet models, we need to know about Antarctic ice sheet history so that its past trajectory or dynamic behaviour can be incorporated. In some cases the long-term millennial trajectory can dominate changes seen today: for example in the Ford Ranges, West Antarctica, the long-term thinning rate of c. 4 cm yr-1 over the last 10 000 yr (Stone et al. Reference Stone, Balco, Sugden, Caffee, Sass, Cowdery and Siddoway2003) closely matches the satellite-altimetry measured rate of recent decades (Davis et al. Reference Davis, Li, McConnell, Frey and Hanna2005). The implication is that we have to know the millennial-scale history of the ice sheets if we are to predict their future.
For Antarctica, the greatest ice volume changes since the Last Glacial Maximum (LGM) have been in the Ross and Weddell Sea regions (Bentley Reference Bentley1999, Denton & Hughes Reference Denton and Hughes2002). Significant progress has been made in deciphering the Ross Sea deglaciation with an emerging consensus that the area has experienced progressive thinning and grounding line retreat through the Holocene (Conway et al. Reference Conway, Hall, Denton, Gades and Waddington1999, Stone et al. Reference Stone, Balco, Sugden, Caffee, Sass, Cowdery and Siddoway2003). It has also been suggested that the grounding line retreated as a ‘swinging gate’, hinged in the eastern Ross Sea (Conway et al. Reference Conway, Hall, Denton, Gades and Waddington1999). In contrast, the pattern and timing of deglaciation of the Weddell Sea embayment (Fig. 1) is less well known, despite accounting for as much as half of the volume change of the West Antarctic Ice Sheet (WAIS) since the LGM (Bentley Reference Bentley1999, Denton & Hughes Reference Denton and Hughes2002). This uncertainty has hampered efforts to understand the LGM volume of the ice sheet in this region, and identify if it made any significant contribution to rapid postglacial global sea level rises such as meltwater pulse 1A (Clark & Mix Reference Clark and Mix2002, Bassett et al. Reference Bassett, Milne, Bentley and Huybrechts2007).
Location map of the northern Pensacola Mountains showing the major mountain ranges, glaciers and other glaciological features including the Dufek Massif and Davis Valley (inset box).

Past ice sheet thickness can be inferred from the glacial geomorphology and geochronology of trim lines, moraines, drift limits and bedrock surfaces flanking the inland mountains of Antarctica. At present the thinning history of the WAIS and East Antarctic Ice Sheet (EAIS) in the Weddell Sea embayment is primarily constrained by glacial geological data from the Ellsworth Mountains (Bentley et al. Reference Bentley, Fogwill, Le Brocq, Hubbard, Sugden, Dunai and Freeman2010) and the Shackleton Range (Fogwill et al. Reference Fogwill, Bentley, Sugden, Kerr and Kubik2004, Hein et al. Reference Hein, Fogwill, Sugden and Xu2011), respectively. In the Ellsworth Mountains geomorphological analysis has shown that the original Quaternary or pre-Quaternary ice thickness change was probably 800–1000 m (Denton et al. Reference Denton, Bockheim, Rutford and Andersen1992) and for the LGM there is geomorphological evidence for a lower trimline that takes the form of a drift limit and/or weathering break at 230–480 m above present-day ice (Bentley et al. 2010). In the Shackleton Range cosmogenic surface exposure dating of bedrock surfaces has shown that exposure ages between 1.16 and 3.0 Ma provide minimum estimates for the last glacial over-riding of the summit plateau (Fogwill et al. Reference Fogwill, Bentley, Sugden, Kerr and Kubik2004). These ages constrained EAIS thickening to < 750 m throughout the last 3 Ma. Fogwill et al. (Reference Fogwill, Bentley, Sugden, Kerr and Kubik2004) also calculated erosion rates of the bedrock and obtained a range of 0.10–0.35 m Ma-1. The value of 0.35 m Ma-1 assumes saturation and so represents the maximum erosion rate possible. Hein et al. (Reference Hein, Fogwill, Sugden and Xu2011) showed minimal thickening in the Shackleton Range during the last glacial cycle. Collectively this work has demonstrated that LGM ice in the region was thinner than previously assumed with many of the upper slopes of the mountains remaining ice-free, implying that sea level contributions from this sector need to be revised. This supports initial analyses of an ice core drilled at Berkner Island which demonstrates that the ice rise forming the island remained a separate ice dispersal centre throughout the last glacial cycle and was not over-ridden by continental ice (Mulvaney et al. unpublished).
The objectives of this study were to map and survey the geomorphological features of two ice-free dry valleys in the northern Dufek Massif and to constrain past ice sheet behaviour, linking with studies in the Ellsworth Mountains to the west and Shackleton Range to the north-east. First we mapped and described the main topographic and geomorphological features, and second we carried out 10Be and 26Al cosmogenic surface exposure dating of glacially transported erratic rocks associated with selected geomorphological features to provide chronological constraints on the glacial history. We discuss the results with reference to published constraints on ice sheet thickness from other exposed mountain ranges around the Weddell Sea embayment.
Site description and previous work
The Dufek Massif centred at 82°24′S, 52°12′W (Fig. 1) is situated at the northern end of the Pensacola Mountains and is part of the Transantarctic Mountain range. It is approximately mid-way between the Support Force Glacier and the Foundation Ice Stream, two of the major glaciers draining northwards from the Polar Plateau into the Filchner-Ronne Ice Shelf. Approximately 60 km to the south-east is the Forrestal Range (also part of the Pensacola Mountains), which is separated from the Dufek Massif by the Sallee Snowfield, a plateau ice field that forms the southern and eastern boundary of the Dufek Massif. To the north and north-west is the Ford Ice Piedmont which separates the Dufek Massif from the Ronne and Filchner ice shelves, c. 50 km to the north-west and 70 km to the north-east respectively. The nearest significant mountain chains are the Ellsworth Mountains 800 km to the west, and the Shackleton Range 400 km to the north-east.
The total area of the Dufek Massif is 11 668 km2 and its highest point is England Peak (2150 m). Its geology has been described by Behrendt et al. (Reference Behrendt, Henderson, Meister and Rambo1974), Ford (Reference Ford1976, Reference Ford1990) and Ford et al. (Reference Ford, Schmidt and Boyd1978) and geophysically surveyed by Ferris et al. (Reference Ferris, Johnson and Storey1998). Studies of its meteorology are limited, but mean annual temperature inferred from nearby ice boreholes lies between -24.96°C, 32 km due north of the Davis Valley on the Ford Ice Piedmont in December 1957 (Aughenbaugh et al. Reference Aughenbaugh, Neuburg and Walker1958), and -9°C in December 1978 in the Enchanted Valley, 26 km to the south (Boyer, personal communication 2000). Near surface winds in winter are predominantly from the WNW with modelled mean winter velocities of c. 10 m s-1 (Van Lipzig et al. Reference Van Lipzig, Turner, Colwell and van Den Broeke2004). It has also been identified as an ablation area comprising two types of wind driven ablation (Van den Broeke et al. Reference Van den Broeke, van de Berg, van Meijgaard and Reijmer2006). Type 1 includes erosion driven ablation areas, caused by 1-D and/or 2-D divergence in the katabatic wind field where solid precipitation and sublimation are small but where divergence in the snowdrift transport can be considerable. Type 2 appears to dominate within the study area and includes sublimation driven ablation areas occurring at the foot of steep topographic barriers, where temperature and wind speed are high and relative humidity low, with individual glacier valleys, serving as gates for air drainage from the plateau to the Filchner-Ronne Ice Shelf. Strongest sublimation rates occur on these localized glaciers in the Transantarctic Mountains, where widespread blue ice areas are known to exist (Van den Broeke et al. Reference Van den Broeke, van de Berg, van Meijgaard and Reijmer2006).
The area was first visited in the International Geophysical Year (1957) and then by the USGS in 1978–79. It was on these expeditions that geologists discovered the Davis Valley and Forlidas valley (unofficial name), dry valleys, occupying 53 km2 with 39 km2 of this being ice-free (Behrendt et al. Reference Behrendt, Henderson, Meister and Rambo1974). Although less than 1% of the area of the McMurdo Dry Valleys, these valleys represent the largest ice-free valley system found south of 80°S in the Weddell Sea sector of Antarctica and were reported to contain a rich geomorphological record of glacial history of the ice sheet (Boyer Reference Boyer1979). Some ice-free areas around the Weddell Sea embayment have scattered erratics or (rare) moraines, but in the Dufek Massif the first visitors identified that the assemblage of drift limits, moraines, abundant quartz-bearing erratics and their intersecting relationships would provide an excellent opportunity to determine constraints on the glacial history of the Weddell Sea margin. For these attributes, and its unusual biological communities (Hodgson et al. Reference Hodgson, Convey, Verleyen, Vyverman, McIntosh, Sands, Fernández-Carazo, Wilmotte, De Wever, Peeters, Tavernier and Willems2010, Fernandez-Carazo et al. Reference Fernandez-Carazo, Hodgson, Convey and Wilmotte2011, Peeters et al. Reference Peeters, Hodgson, Convey and Willems2011a, Reference Peeters, Verleyen, Hodgson, Convey, Ertz, Vyverman and Willems2011b) the area around Forlidas Pond and Davis Valley Ponds is designated as an Antarctic Specially Protected Area (ASPA No. 119). Boyer (Reference Boyer1979) made geomorphological observations not only in Davis Valley but also on Saratoga Table, a plateau nunatak located c. 100 km to the south of the Dufek Massif in the Forrestal Range. He was unable to provide any dates for the glacial record he described, but on the basis of geomorphological relationships he proposed the following sequence of events: 1) a very old sub-polar or temperate-type valley glaciation, 2) a former ice sheet level as much as 400 m higher than today, 3) multiple advance and retreat of local alpine ice since the last major ice advance, and 4) a complex glacial, glaciofluvial and lacustrine history. Boyer (Reference Boyer1979) provisionally correlated the occurrence of Davis Valley erratics above 1000 m altitude with the McMurdo Sound region glacial episodes ‘Taylor V-II’ (Miocene to 1.6 Ma) of Denton et al. (Reference Denton, Armstrong and Stuiver1971), and the Davis Valley ice sheet deposits with the ‘Taylor I’ glacial episode (12 200 yr bp to present).
Methods
Geomorphological mapping and glacial geomorphology
Topographic and geomorphological maps were compiled by the Mapping and Geographical Information Centre (British Antarctic Survey) at 1:25 000 scale using aerial photographs from the United States Geological Survey (Lassiter Station 1-16 and 1-17, 1 February 1958), GPS-surveyed ground control and differential geodetic GPS survey transects were carried out using a Trimble 5700 base station and a Magellan ProMark 10CM rover unit. Altitudes were referenced to the WGS84 reference ellipsoid, and included accurate photogrammetric height measurements of key landforms. Glacial geomorphological mapping was carried out from field observation and aerial photographs. Boyer (Reference Boyer1979) was used as a starting point for interpretations. The main glacial features were described following the glacial land systems methods of Evans (Reference Evans2003).
Glacial chronology
We sampled erratics of Dover Sandstone (Ford et al. Reference Ford, Schmidt and Boyd1978) for 10Be and 26Al cosmogenic isotope dating following the protocols outlined in Gosse & Phillips (Reference Gosse and Phillips2001). Six or seven erratic samples were collected from three of the identified glacial stages. All erratics were of Dover Sandstone which differs from the local (stratiform) middle Jurassic (191–147 Ma) mafic igneous bedrock geology (Ford et al. Reference Ford, Schmidt and Boyd1978). Erratics showed limited rounding of the edges, limited or no spalling or pitting of boulder surfaces, and no clear evidence of previous cover by till or other sediment. This suggests that they were deposited by ice and have not been exhumed from drift sheets. Samples were taken from flat-lying areas to limit the possibility of samples having overturned or moved down-slope. Samples generally consisted of parallel-sided, 5 cm thick horizontal slabs of rock from the top surface of flat-topped boulders ranging from c. 30–80 cm in height. Each sample was marked up with orientation, edge/face details and photographed in detail and in its site context. GPS locations (including differential GPS measured altitudes) were recorded together with details of topographic shielding in 15° azimuth intervals.
Laboratory procedures, and calculations of exposure ages using the CRONUS-Earth online calculator (Balco et al. Reference Balco, Stone, Lifton and Dunai2008) are outlined in the supplemental material. In the calculations the newly determined half-life of 1.389 Ma for 10Be was used (Chmeleff et al. Reference Chmeleff, von Blanckenburg, Kossert and Jakob2010, Korschinek et al. Reference Korschinek, Bergmaier, Faestermann, Gerstmann, Knie, Rugel, Wallner, Dillmann, von Gostomski, Kossert, Maiti, Poutivtsev and Remmert2010).
Results
Large-scale bedrock geomorphology
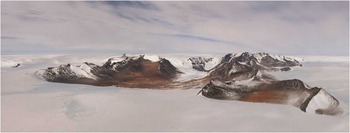
The study area is located on the northern edge of the Sallee Snowfield, a 100 km long plateau ice field (Fig. 1). The Dufek Massif is part of an escarpment that descends from the Sallee Snowfield to the Ford Ice Piedmont to the north. The northern edge of the escarpment forms an alpine landscape characterized by alpine peaks, cirques and intervening arêtes (Figs 2 & 3). At its northern end are two distinctive dry valleys. In places the bedrock ridges show large-scale ice moulding including asymmetric rounded summits (roche moutonnée forms), plucked faces and prominent U-shaped breaches in the ridge - particularly Wujek Ridge to the east (Figs 2 & 3). We interpret the landscape exposed at the plateau edge as one of alpine glaciation that was subsequently completely over-ridden by an erosive (warm-based) ice sheet that formed breaches and roches moutonnées.
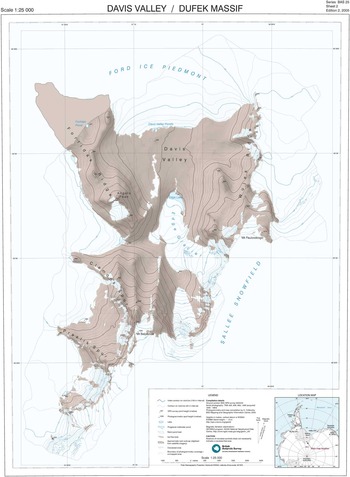
Topographic map of the northern Dufek Massif and Davis Valley. A high-resolution version of this map can be downloaded from the SCAR map catalogue at http://data.aad.gov.au/aadc/mapcat/.

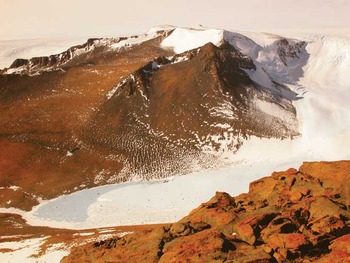
The Davis Valley and adjacent Forlidas valley are Antarctic ‘dry valleys’, with their valley floors being lower in elevation than the surrounding ice, with some over deepening, for example around Edge lake (Figs 2 & 3). For example the Davis Valley descends c. 160 m over 2 km between the northern ice sheet front of the Ford Ice Piedmont and Edge lake (unofficial name) and more than 1000 m from the Sallee Snowfield to the south. The northern ice sheet front is characterized by distinctive lobes of blue ice which ‘flow’ into the valley (Fig. 4). The shape and surface contours of the ice front are probably influenced by the morphology of the valleys directing wind patterns and hence differential ablation and sublimation. The southern part of the valley rises steeply to the escarpment edge with a number of small outlet glaciers descending from the plateau ice field through the lower saddles into the valley (Fig. 3), the largest of which is the c. 4 km long Edge Glacier which occupies the southern end of the Davis Valley. The valleys are therefore affected by ice both from the north and south.
Panorama of the Davis Valley (left) and Forlidas valley (unofficial name, right), looking south. The panorama shows the Stage 1 alpine glaciation cirques and arêtes, and Stage 2 moulded ridges, summits and breached arêtes from ice sheet over-riding. The prominent Stage 2 U-shaped breaches in the arête of Wujek Ridge can be seen on the left of the photograph. Towards the middle of the photograph small outlet glaciers can be seen descending through similar breaches into the Davis Valley, the largest of which is the c. 4 km long Edge Glacier.

The distinctive blue ice lobes of the Ford Ice Piedmont (left) discharging into the Davis Valley.

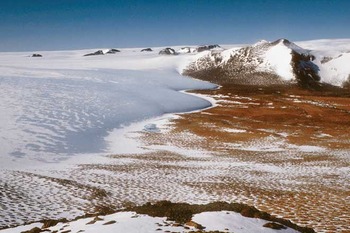
In Forlidas and Davis valleys bedrock surfaces and boulders above the drift sheet limits share characteristics of long-term wind erosion, including sculpting of bedrock, and tafoni more than a metre in diameter (Fig. 5) but give way to glacial erosion features in the valleys below the drift limit. At the time of visiting there was limited windblown debris on the lake ice surfaces, local snow patches, or the neighbouring glacial surfaces.
Tafoni and weathered bedrock in local gabbro and pyroxenite bedrock above the upper Stage 4 drift limit on Forlidas Ridge.

Depositional features
Within the valleys there is an extensive glacial geomorphological record of multiple glacial advances and retreats (Boyer Reference Boyer1979). Features include overlapping valley glacier moraines, ice sheet moraines, lake shorelines, ice eroded surfaces, well developed patterned ground and glacial erratics (Fig. 6).
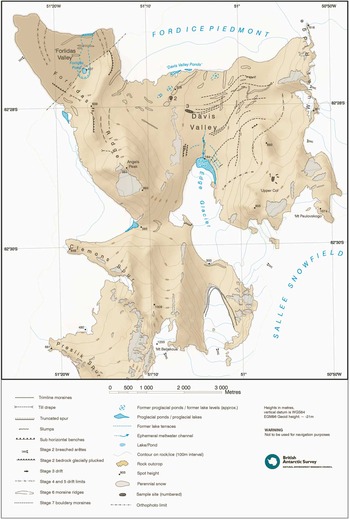
Geomorphological map of the northern Dufek Massif and Davis Valley. Sampling sites for cosmogenic isotope exposure age dating are marked with cross-hatched areas labelled 1–3 on the map. A high-resolution version of this map can be downloaded from the SCAR map catalogue at http://data.aad.gov.au/aadc/mapcat/.

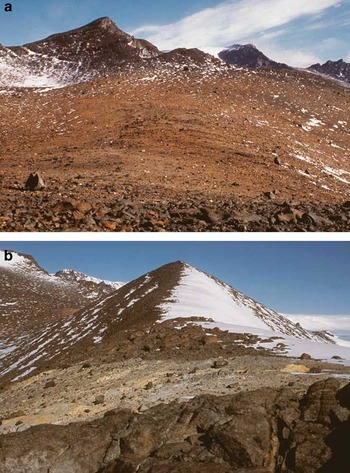
In at least two high areas of the valleys there is depositional evidence of glacier advance to limits over 600 m altitude. The first of these is at ‘Upper Col’ (Fig. 6, informal name), at 760 m, and consists of a yellowish brown drift deposit occupying the edge of a shallow depression to the west of the Wujek Ridge (Fig. 7a). The drift has a well-defined upper limit and is characterized by distinctive colour and lithological composition, containing abundant erratics of yellow Dover Sandstone. Outside and above this drift, the surface debris cover is composed exclusively of the local gabbro and pyroxenite bedrock (Ford et al. Reference Ford, Schmidt and Boyd1978). The second site is on Forlidas Ridge (Fig. 6, marked as Stage 3 drift; Fig. 7b) just south of the bedrock summit at 639 m. It consists of a pale creamy band of regolith, probably derived from weathering of a pegmatite or aplite dyke (Ford et al. Reference Ford, Schmidt and Boyd1978) that cuts across the ridge, over which are scattered numerous erratic clasts of local bedrock and occasionally of Dover Sandstone. Both deposits sit on areas of relatively level terrain away from steep slopes and so the surface cover was more probably transported by ice rather than rock fall. Field observations from a distance suggest that there may be equivalent units in the unvisited high southern parts of the valleys around Clemons Spur and Presilik spur (unofficial name). The Upper Col drift deposit records a glacier advance that spilled down from Wujek Ridge to 760 m altitude whilst the drift deposit on Forlidas Ridge records a glacier advance spilling over the ridge from the west.
a. ‘Upper Col’ drift from Stage 3 ice sheet advance showing Dover Sandstone erratics. b. Stage 3 drift on Forlidas Ridge.

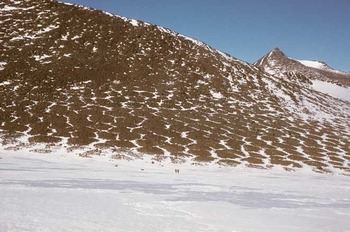
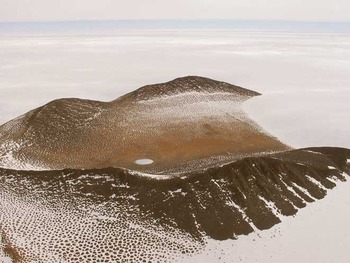
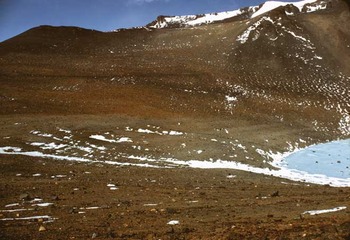
Below these sites the valleys are occupied by two distinctive drift sheets marked by the presence of frost sorted polygons consisting primarily of large clasts and boulders (Fig. 8). The larger polygons are typically > 35 m diameter, c. 2 m high and grade into sorted stripes as slopes increase and the networks become more elongate down-slope (cf. Kessler & Werner Reference Kessler and Werner2003). The upper extent of the upper drift (altitude < c. 600 m) is dark reddish brown, distinct, abrupt and can be traced along the margins of both Davis and Forlidas valleys. A second lower drift limit (altitude c. 550 m) can be distinguished on the basis of a minor change in the degree of weathering, and a marked increase in the diameter and height of the polygons (Figs 8 & 9). This limit cannot be traced as extensively as the upper drift, but where they are both present their upper limits are sub-parallel. A further series of less distinctive drift limits marked by subtle changes in polygon morphology (diameter, height, weathering) are also evident. The drift sheets extend under the present-day ice sheet margin, and also under the Edge Glacier (Fig. 10).
Stages 4 and 5 drift sheet in Davis Valley. Note the change in the diameter and relative height of the frost sorted polygons approximately mid-way across the photograph which marks the boundary between the Stage 4 and 5 drift limits. Two people are present on snow in the middle foreground for scale.

Drift limits in Forlidas valley showing the two distinctive Stage 4 and 5 drift limits marked by changes in polygon morphology and rock colour, and a series of less distinct limits defined by relatively minor changes in polygon morphology, in this case picked out by a light dusting of snow. Forlidas Pond can be seen in the middle of the photograph. The higher Holocene water levels have resulted in an area in the base of the valley in which large-scale frost sorted polygons are absent.

Stages 4 and 5 drift limits extending under Edge lake and the Edge Glacier. The transition between the sloping ice of the glacier and the sub-horizontal surface of Edge lake can be seen on the left of the image. Supraglacial debris and boulders are present both on the glacier and the lake.

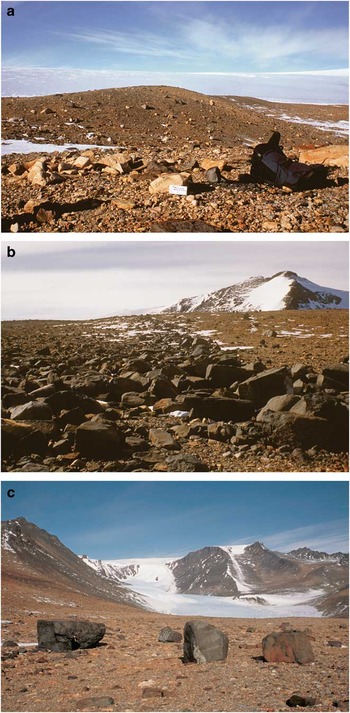
The floor of Davis Valley contains a complex set of intersecting moraine ridges. The largest of these are large moraine ridges, 50–200 m wide and 15–20 m high extending for more than 1 km just south of the Davis Valley ponds (Fig. 3, Stage 6; Fig. 11a). The moraines are symmetrical with rounded crests and composed of relatively well sorted cobble to small boulder surface material. The ridges do not show advanced development of frost sorted polygons, although there are occasional cracks (ice wedges?) on the ridge flanks. In the central part of the Davis Valley close to the present-day ice sheet margin we mapped some of the more prominent of these moraines including an arcuate western ridge and a linear eastern ridge. Both these ridges extend under the ice sheet (Fig. 6). There is a complex of smaller ridges with similar morphology in two areas located outside of these larger ridges towards the sides of the valley. These are less continuous and orientated obliquely to the ice sheet margin. On the western side of the valley some of these moraines also extend under the ice sheet margin (Fig. 6). Minor moraine ridges also occur in similar orientations in the northern part of Forlidas valley but unlike Davis Valley these are overprinted by the drift sheet polygons. Small moraine ridges with similar morphology occur at 82°29′40′′S, 051°09′00′′W, just north of Clemons Spur, between the eastern margin of the ice sheet and the Edge Glacier, and at 82°28′S, 051°19′W, along the west flank of Forlidas Ridge, close to the eastern margin of the ice sheet.
a. Stage 6 Davis Valley outlet glacier moraine ridges. b. Stage 7 bouldery moraine in the Davis Valley. c. Examples of the larger boulders in the bouldery moraine. The figure standing in front of the left boulder is for scale.

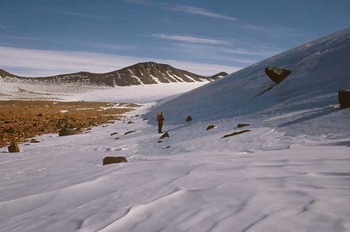
Superimposed over the floor of the Davis Valley are a series of distinctive bouldery moraines (Fig. 11b). The moraines can be traced for over 2 km in some parts of the valley and are made up predominantly of large boulders of the local bedrock (Fig. 11c), together with a much smaller component of Dover Sandstone blocks. The proportion of the dark local rock in these bouldery moraines is much larger than that of the drift sheets and moraine ridges over which they are draped, and so from a distance they stand out as dark grey linear features. The individual moraines are concentric and sub-parallel to the present-day margin of the Ford Ice Piedmont, including the two distinctive blue ice lobes that penetrate into Davis Valley (Fig. 4). Deposition of boulders of the same lithology can be seen at the present-day ice front (Fig. 12). These moraines are confined to the eastern side of Davis Valley and extend to just over 400 m altitude. They are not present in Forlidas valley. To the south the small outlet glaciers have small moraine loops parallel to their current margins, consistent with deposition at expanded positions.
A boulder emerging from the blue ice margin of the Ford Ice Piedmont in the Davis Valley, illustrating the process that forms the Stage 7 bouldery moraine. A person is in the middle of the image for scale.

Lacustrine and glaciofluvial features
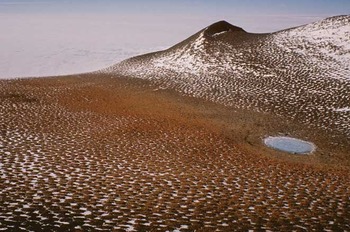
Both valleys contain frozen water bodies. In Forlidas valley, Forlidas Pond (51°16′48′′W, 82°27′28′′S) is a perennially frozen, shallow pond 1.63 m deep and 90.3 m in diameter (Figs 9 & 13). Forlidas Pond is an isolated remnant of a formerly much more extensive proglacial lake. This lake formerly had water levels up to 17.7 m above present - delineated by salt efflorescence on the rocks and a series of lake terraces at 11.6 m, 8.61 m, 4.16 m and 1.25 m above the present lake level (Hodgson, unpublished data). Evaporation of this once larger water body has resulted in the accumulation of a hypersaline slush (c. 4 x greater than the salinity of seawater), underlying the ice at the bottom of the pond. An ephemeral proglacial meltwater pond also occurs where the valley meets the Ford Ice Piedmont, and two further ponds are present west of Forlidas Ridge. A series of small extant proglacial meltwater ponds, the Davis Valley Ponds, similarly occurs along the blue ice margin of the northern Davis Valley at 51°05.5′W, 82°27.5′S and 51°07′W, 82°27.55′S (Figs 3 & 4) whilst south of this a number of remnant pond beds mark the position of former proglacial ponds, probably formed during periods of ice advance into the valley (Hodgson et al. Reference Hodgson, Convey, Verleyen, Vyverman, McIntosh, Sands, Fernández-Carazo, Wilmotte, De Wever, Peeters, Tavernier and Willems2010). Edge lake, a perennially frozen pro-glacial lake at the terminus of the Edge Glacier is surrounded by a series of four or five depositional proglacial lake ice-push shorelines cut into the valley side, particularly near the eastern terminus of the glacier (Fig. 14). On the western side a series of sub-horizontal benches in bedrock may mark former limits of the Edge Glacier. The surface of the lake ice on Edge lake has an uneven domed surface topography suggesting that it has accumulated from successive surface meltwater refreezing events, and has experienced enhanced ablation near the edges. Seasonal meltwater was observed on the eastern margin of the glacier during the sampling campaign. Supraglacial debris in the form of boulders and cobbles is present both on the Edge Glacier and Edge lake (Fig. 14).
Forlidas Pond. The higher water level of the much larger proglacial lake from which the pond originated is 17.7 m above the present water level and is delineated by salt efflorescence on the rocks and the absence of well-formed frost sorted polygons. A series of lake terraces that can be seen immediately around the pond marks a series of lower lake levels formed in the mid-Holocene before the present water level was reached.

Palaeoshorelines above the current shoreline of Edge lake looking from west to east. These are overlain by the most distal of the Stage 7 bouldery moraines, and bisected by a meltwater gully across the middle of the image. The ‘Upper Col’ sampling site and Stage 3 drift are visible at the top of the image, with the main arête behind.

Incised dry stream channels and water erosion features are evident within Davis Valley (Fig. 6). Some appear to have been recently active, fed by glacial meltwater but most do not appear to be related to present-day snow or ice masses and so are probably relict features. The presence of liquid water at or near the surface of all the water bodies, and even small glacial melt streams on the Edge Glacier, illustrates the ability of the relatively large areas of bare rock and soil to absorb solar radiation and emit heat causing local ice and snow melt.
Glacial chronology: cosmogenic isotope exposure ages
In order to provide a chronology for the glacial history we sampled some of the landforms described above for cosmogenic isotope analyses. We concentrated on clearly defined landform limits without disturbance by polygonisation and periglacial activity, and in order to encompass the greatest possible age range of the glacial history. We were also constrained in the current study to 10Be and 26Al analysis and so have focussed solely on those quartz-bearing lithologies, especially the Dover Sandstone erratics found throughout the valley. Sites included the following three areas (see numbered cross hatched areas in Fig. 6 for locations):
1) Erratics lying on bedrock on the Upper Col at c. 700 m altitude (the lowest point in the Davis Valley is 184 m altitude) were used to constrain the age of the drift that was deposited in Upper Col and marks the last major over-riding of the ridges surrounding Davis Valley (cross hatched area labelled 1 on Fig. 6; Fig. 7a). This was the oldest event that could likely be dated using 10Be since earlier events were erosional and affected the gabbro bedrock.
2) Erratics lying on the largest outlet glacier moraine ridges in northern Davis Valley (cross hatched area labelled 2 on Fig. 6; Fig. 11a), recording expansion of the Edge Glacier and other outlet glaciers discharging into the Davis Valley. Although the geomorphology shows that these moraines were over-ridden by the final ice sheet advance, our interpretation was that if the ice sheet advance was short-lived (and non-erosive?) with limited burial then we might be able to obtain a reasonable estimate of the outlet glacier moraine age.
3) Erratics deposited in bouldery moraines in the Davis Valley that mark the most recent retreat of the Ford Ice Piedmont (cross hatched area labelled 3 on Fig. 6; Fig. 11b). We selected the most prominent of a series of these bouldery moraines deposited across the valley floor sub-parallel with the current ice sheet margin. The aim of sampling these moraines was to provide age constraints on the most recent ice sheet retreat.
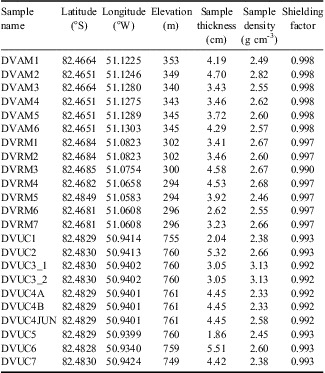
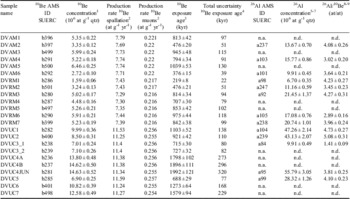
Sample data are in Table I and cosmogenic isotope data are shown in Table II. In order to understand periods of exposure and re-burial during sample history we analysed 26Al-10Be pairs for most samples, and used a two-isotope plot (Fig. 15) (Bierman et al. Reference Bierman, Marsella, Patterson, Davis and Caffee1999). The location of individual samples on this plot can indicate (but not mandate) whether they have had continuous exposure histories (those samples that plot within the erosion island). Samples that plot below the erosion island have complex exposure histories, with at least one period of burial. We discuss below the samples on each of the three landforms that we attempted to date. In each case the ages we discuss are minimum ages because they assume zero erosion: accounting for the (unknown) amount of erosion would increase the ages.
Cosmogenic isotope sample data. All samples are erratics of Dover Sandstone.

Cosmogenic isotope data.

at = atom, n.d. = not determined.
1Based on normalization according to Nishiizumi et al. (Reference Nishiizumi, Winterer, Kohl, Klein, Middleton, Lal and Arnold2007): 2.79 * 10-11 as 10Be/9Be for NIST SRM4325.
2One sigma uncertainty including 2.5% for uncertainty of Be concentration of carrier solution.
3CRONUS-Earth calculator (Balco et al. Reference Balco, Stone, Lifton and Dunai2008), wrapper script 2.2, main calculator 2.1, constants 2.2.1, muons 1.1, production rates related to 10Be half-life of 1.39 Myr and Antarctic air pressure.
4CRONUS-Earth calculator, wrapper script 2.2, main calculator 2.1, constants 2.2.1, muons 1.1; related to a 10Be half-life of 1.39 Myr; constant production rate scheme Lal/Stone.
5One sigma analytical uncertainty (does not include uncertainty of production rate).
6Based on normalization to Purdue standard material Z92-0222 with a nominal 26Al/27Al ratio of 4.11 * 10-11 - in agreement with Nishiizumi's standards (Nishiizumi Reference Nishiizumi2004).
7One sigma uncertainty including the uncertainty of the determination of Al in quartz.
8Related to an initial production rate ratio of 6.75.
9One sigma uncertainty.
10Be-26Al co-isotopic diagram.

Davis Valley Upper Col erratics (DVUC)
We sampled seven erratics from Upper Col. The two least weathered samples plot within the erosion island, namely DVUC1 (10Be age = 1.1 Ma, altitude = 755 m) and DVUC2 (0.9 Ma, altitude = 760 m). One other sample plots close to the erosion island, namely DVUC4JUN (1.99 Ma, altitude = 761 m). Two other Upper Col samples for which there are both Al and Be data do not plot in the erosion island (DVUC5 (0.7 Ma, altitude = 760 m) and DVUC3_1 (0.7 Ma, altitude = 760 m)), and indeed the latter sample sits the furthest away from the erosion island of any sample in Davis Valley. However, there are several DVUC samples that do not have Al data but have 10Be ages consistent with the oldest of the samples lying within the erosion island (Table II, Fig. 15). Replicates on sample DVUC4 (altitude = 761 m) show it has a minimum exposure age of 1.8–1.9 Ma, whilst DVUC6 (altitude = 759 m) and DVUC7 (altitude = 749 m) yield minimum ages of 1.3 and 1.6 Ma, respectively. Given these consistently old ages, and the fact that a majority of DVUC samples with combined Be-Al data have isotopic ratios that are consistent with continuous exposure then we suggest that the Upper Col has been exposed for well over 1 Ma since the advance to this location (to 750 m altitude or higher), and perhaps for as much as 2.0 Ma.
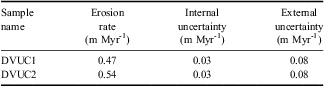
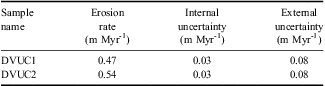
It is also possible to take this one step further and calculate maximum long-term erosion rates for those samples within the erosion island. This requires the assumption that the samples have reached secular equilibrium. These yield rates of 0.47–0.54 m Myr-1 (Table III).
Maximum erosion rate for Upper Col samples. Calculated with the CRONUS online calculator (Balco et al. Reference Balco, Stone, Lifton and Dunai2008) with data from Table I and Table II.
Davis Valley outlet glacier moraine ridges (DVAM)
We sampled six erratics on a prominent moraine ridge that was deposited by a formerly expanded Edge Glacier flowing north. The two-isotope plot shows that all three of the samples for which we have paired Be-Al analyses have complex exposure histories with at least one period of burial (Fig. 15). Those samples with Be-Al paired analyses show consistently younger Al ages than Be, implying burial and probable reworking and that these ages cannot be used to infer the precise timing of glacier advances. Even the youngest of these paired ages is highly discordant. It is also clear from the 10Be ages alone that there is a large spread of ages (376–1039 ka), which can be an indicator of a (partly) reworked deposit.
Davis Valley Ford Ice Piedmont bouldery moraines (DVRM)
Five of the seven samples from the bouldery moraines associated with advance and retreat of the Ford Ice Piedmont margin have paired Be-Al analyses and all of these show complex exposure histories. Ages range between 219 and 975 ka, but they show consistently younger Al ages than Be ages, and even the youngest sample (DVRM1) shows a discordant age pair, implying that it cannot be used to estimate the age of this deposit. We suspect that the high recycling ratio is probably due to our selection of quartz-bearing lithologies (Dover Sandstone) for analysis. The moraines are dominantly composed of igneous clasts, and indeed that is the lithology we have observed emerging at the present-day margin (Fig. 12).
Discussion
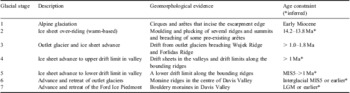
We have mapped the glacial geomorphology of two dry valleys in the northern Dufek Massif, building on the work of Boyer (Reference Boyer1979). We interpret the intersecting relationships between bedrock landforms, drift limits, and moraines as the result of seven stages of glaciation (Table IV). The evidence for these is described below:
Glacial stages inferred from geomorphological evidence in the Davis Valley.

Glacial stages
Stage 1: Alpine glaciation
The alpine glaciation that formed the cirques and arêtes that incise the escarpment edge is the earliest part of the glacial history that can be identified. At this time the plateau was probably occupied by a small ice field - the precursor to the Sallee Snowfield. The age of this alpine glaciation is unknown.
Stage 2: Ice sheet over-riding
The moulding and plucking of several ridges and summits, and breaching of some pre-existing arêtes suggest that following the alpine glaciation the area was over-ridden by a warm-based ice sheet. This ice flow was directed to the north. The strongly weathered higher surfaces (tafoni, ventifacts, honeycombing, etc) formed after ice retreat are similar to those found in the Shackleton Range on the higher summits. It may be that this over-riding glaciation dates to a major expansion of the Antarctic Ice Sheet which elsewhere has been dated at the middle Miocene climate transition (MMCT), 14.2–13.8 million years ago (Shevenell et al. Reference Shevenell, Kennett and Lea2004), and the rapid cooling at 13.9 million years ago in the McMurdo Dry Valleys (Lewis et al. Reference Lewis, Marchant, Ashworth, Hedenas, Hemming, Johnson, Leng, Machlus, Newton and Raine2008).
Stage 3: Outlet glacier and ice sheet advance
At some time after the warm-based ice sheet had retreated there was a minor re-advance when an outlet glacier breached the Wujek Ridge to occupy the Upper Col at 760 m, 576 m higher than the lowest part of the Davis Valley, and the ice sheet margin spilled over Forlidas eastern ridge just south of the peak at 639 m. If these drift limits are related then it suggests ice thickening and expansion occurred from the south and the west, involving both the Sallee Snowfield and the Ford Ice Piedmont. Equivalent advances may have occurred elsewhere in the high southern parts of the valleys but were not surveyed. The cosmogenic isotope data suggests that this advance to the Upper Col occurred > 1.0 Ma (Table IV).
Stage 4: Ice sheet advance to upper drift limit in valley
The drift sheets in the valleys and drift limits along the bounding ridges shows that the valleys were occupied by ice from an expanded ice sheet margin and extended outlet glaciers breaching the southern escarpment. The upper drift limit demonstrates that these ice masses merged depositing a thick drift sheet which may not have reached the heights of the earlier advances of the Sallee Snowfield over Wujek Ridge and across the Upper Col sampling site, or the advance of the ice sheet over Forlidas Ridge. After retreat, periglacial activity initiated the development of frost sorted polygons across the surface of the drift sheet. This drift includes evidence of rocks that have been disintegrated to clay and rock particles forming soils which elsewhere in Antarctica occur in areas that have been exposed for more than a million years (Fogwill et al. Reference Fogwill, Bentley, Sugden, Kerr and Kubik2004).
Stage 5: Ice sheet advance to lower drift limit in valley
A second advance or still stand to closely parallel limits deposited the lower drift sheet. The colour difference and different frost polygon ‘texture’ suggests a significantly different weathering history (age) to the upper drift. On retreat periglacial activity again initiated the development of a new set of frost sorted polygons. A number of less distinctive and discontinuous drift limits marks possible still stands during this retreat. The apparent extension of the polygonised drift sheets under the margins of the present-day ice sheet and the margins of the Edge Glacier implies that between these two advances, and after the second, the Ford Ice Piedmont and Edge Glacier retreated to less extensive positions than the present-day.
Stage 6: Advance and retreat of outlet glaciers
The large moraine ridges in the centre of Davis Valley are not polygonised and so we interpret them as postdating the Stage 5 drift sheet. The orientation of the moraine ridges and the absence of well developed frost sorted polygons in the central Davis Valley are consistent with an expanded Edge Glacier combined with the other outlet glaciers from the Sallee Snowfield that flowed north to meet and merge with the Ford Ice Piedmont. The outermost (westernmost and easternmost) ridges record the former margin where the Edge Glacier merged with the ice sheet piedmont and thus spread laterally. The central ridges record a former limit of the expanded Edge Glacier. The fact that these ridges extend under the ice sheet margin shows that Edge Glacier expanded when the Ford Ice Piedmont was less extensive than it is now. The minor moraine ridges in Forlidas valley, immediately west of Forlidas Ridge, and north of Clemons Spur are interpreted as marking a formerly more expanded ice sheet margin. There is a strong association between the location of ice-marginal melt ponds and these moraines: we discuss this in more detail below. The outer oblique moraines record the merging of the Edge Glacier and the ice sheet margin of the Ford Ice Piedmont, and the inner moraines record the subsequent retreat front of the Edge Glacier. The final retreat of the Edge Glacier probably resulted in the deposition of the lake shorelines and possibly the sub-horizontal benches around Edge lake. To the west of the Edge Glacier a similar expansion of the ice sheet extended the western lobe into the valley below Clemons Spur. A looping recessional moraine marks the limit of this advance.
The cosmogenic isotope data cannot be used to infer minimum ages for this advance and retreat of the outlet glaciers because the erratics have most probably been transported between different locations on the valley floor and so the most recent time of exposure cannot be calculated. In theory it is possible to estimate minimum total exposure history (i.e. exposure time plus minimum burial time) for each erratic. However, this requires two assumptions: i) that erratics have not been exposed at substantially higher elevations in their history, and ii) that larger (> 10 cm thick) erratics have not been turned over during their complex history. Given that the nearest outcrops of Dover Sandstone are tens of kilometres away and at 1000 m altitude the first assumption is difficult to sustain. Similarly, it seems unlikely that individual erratics would not be turned or rolled by over-riding ice during reworking.
Stage 7: Advance and retreat of the Ford Ice Piedmont
The most recent stage has been the advance and retreat of the Ford Ice Piedmont ice sheet margin into the northern part of Davis Valley. This is particularly well-recorded by the bouldery moraines in the eastern half of the valley. The lack of bouldery moraines in the western half of the Davis Valley and in Forlidas valley probably relates to differences in supraglacial debris supply, which may be derived from the west side of Wujek Ridge. We interpret these moraines as marking an expanded ice margin extending at least 2.5 km down valley to (and presumably under) the current location of the Edge Glacier terminus at proglacial Edge lake, which then retreated with a series of at least seven to ten still stands. The most distal of these boulder moraines overlies the Edge lake shorelines described above (Fig. 14). The present-day ice front of the Ford Ice Piedmont is a blue ice margin where boulders are being transported to the face of the ice and subsequently fall off (Fig. 12). The bouldery moraines would have formed during periods of equilibrium between the advance of the glacier and continued ablation and melting of the ice front. There is no concentration of boulders along the present-day ice front suggesting that it is not currently in an equilibrium position. Radiocarbon dating of the former shorelines of Forlidas Pond shows that the ice sheet had retreated from Forlidas and Davis valleys prior to the mid-Holocene (Hodgson, unpublished data). This suggests that the bouldery moraines record the maximum advance position of the Ford Ice Piedmont at the LGM and its subsequent retreat, although with no LGM age constraint, we cannot rule out their formation during an earlier glaciation. The outlet glaciers to the south are also currently in retreat as evidenced by abandoned looping recessional or trimline moraines.
The results of cosmogenic isotope analyses of the Dover Sandstones within these bouldery moraines suggests that they may all be reworked from earlier glacial advances into the valley from the south, rather than deposited directly from the ice margin to the north. The range of exposure ages suggest that these Dover Sandstone erratics may have been moving around the valley between ice sheet and glacier margin for upwards of 1 Ma. We can, however, provide minimum age constraints on these moraines by using the evidence for formerly more extensive water bodies over the drift surface. For example, radiocarbon dating of the former water levels of Forlidas Pond shows that the highest water levels occurred in the mid-Holocene before 2625 calendar yr bp, postdating the final retreat and formation of the ice sheet moraines (Hodgson et al., unpublished data).
In summary, our data show that the erratics in the floor of the Davis Valley have had a complex exposure history and may well be reworked in turn by alternating outlet glacier and ice sheet advances. The cosmogenic isotope analysis can demonstrate that the advance to the Upper Col occurred at > 1 Ma (Table IV), but that the ages of the outlet glacier and ice sheet advances remain unclear because of a high recycling ratio. We suggest that, for the case of the ice sheet moraines at least, this is because the Dover Sandstone erratics are probably not derived from the ice sheet margin itself, but instead are reworked from earlier deposits. We also suggest that only the most extensive over-riding advances, with substantial flow out of the valley will be capable of transporting significant quantities of material away from the valley.
Basal regime of the ice sheet and the role of marginal water ponding
The glacial history above, based on observations of striations and erosional features, shows that there have been both dry-based and wet-based glacial episodes. Erosional landforms suggest that early glacial episodes (Stages 1 and 2) were wet-based, whist the later phases (Stages 3–5 and 7) are all consistent with a dry-based ice sheet. In this context the landforms associated with Stage 6 are puzzling. The large constructional moraine ridges with relatively little bouldery material are more characteristic of a temperate glacial margin. We have mapped a strong association between marginal melt ponds and the Stage 6 moraine ridges in the dry valleys. One possible explanation is that, like today, both ice fronts were characterized by the occasional presence of meltwater and melt ponds. If there was substantial water around the margin then this could have promoted subglacial erosion and deformation of pre-existing sediment at the margin of the ice, and/or mobilization and deposition by meltwater, and thus enable deposition of these large ridges. The unusual orientations may have resulted from the interaction of the two respective ice fronts of the Ford Ice Piedmont and the Edge Glacier. Some evidence for this role of water in moraine deposition is the close association of moraines and ice marginal ponds west of Forlidas Ridge and north of Clemons Spur and northern Forlidas valley (Fig. 6). Moraines are not found anywhere else along this margin.
Regional comparisons
The closest sites in the region for which the glacial history has been studied are the Shackleton Range (Kerr & Hermichen Reference Kerr and Hermichen1999) and Ellsworth Mountains (Denton et al. Reference Denton, Bockheim, Rutford and Andersen1992, Bentley et al. Reference Bentley, Fogwill, Le Brocq, Hubbard, Sugden, Dunai and Freeman2010). At each of these sites there is evidence of an alpine glaciated landscape that has been over-ridden (Shackleton Range - as evidenced by the more rounded nature of the mountains, more limited development of cryoturbation features, and general uniformity of the terrestrial habitat) or partly submerged (Ellsworth Mountains) by a thicker warm-based ice sheet. In the Shackleton Range the warm-based over-riding is interpreted to date from at least 1–3 Ma (Fogwill et al. Reference Fogwill, Bentley, Sugden, Kerr and Kubik2004). Our data from the erratics in the Upper Col of Davis Valley are consistent with these results as they give a minimum age for the drift in the col of > 1.0 Ma. This drift postdates the over-riding warm-based glaciation, and so this date is also a minimum estimate of the timing of the shift in basal ice sheet regime from warm- to cold-based.
The calculated maximum erosion rates for Davis Valley (0.47–0.54 m Ma-1) are slightly higher than those for the Shackleton Range (0.1–0.35 m Ma-1) (Fogwill et al. Reference Fogwill, Bentley, Sugden, Kerr and Kubik2004) but might be accounted for by lithological contrasts - the Dover Sandstone we sampled may be more susceptible to granular disaggregation than the quartzite and gneiss samples in the Shackleton Range. These are still exceptionally low erosion rates by global standards but comparable to some of the rates measured in the Transantarctic Mountains (0.2–1 m Ma-1, Summerfield et al. Reference Summerfield, Stuart, Cockburn, Sugden, Denton, Dunai and Marchant1999), especially those of low relief, high altitude surfaces.
In the Shackleton Range and Ellsworth Mountains ice sheet expansion during the LGM caused thickening of < 340 m (Shackleton Range) or < 480 m (Ellsworth Mountains). In the Ellsworth Mountains the West Antarctic ice sheet thinned from this upper limit progressively through the Holocene (Bentley et al. Reference Bentley, Fogwill, Le Brocq, Hubbard, Sugden, Dunai and Freeman2010). In Forlidas valley the mid-Holocene ages of the higher shorelines present around Forlidas Pond show that the ice sheet had retreated from Forlidas and Davis valleys prior to the mid-Holocene. Our interpretation is that the bouldery moraines in northern Davis Valley therefore mark the LGM position and subsequent retreat of the ice sheet, representing only a 2.5–3 km maximum advance, to an altitude of 400 m which is 216 m above the lowest part of the Davis Valley, but of similar altitude to the surface of the Ford Ice Piedmont c. 1 km north of the Davis Valley (Fig. 3). This suggests an ice advance into the valley occurred but did not involve any substantial thickening, perhaps consistent with this being an ablation area (Van den Broeke et al. Reference Van den Broeke, van de Berg, van Meijgaard and Reijmer2006). An alternative would be that the drift sheets on the valley sides represent the LGM but this seems unlikely because it would imply a complex sequence of advance and retreat (Stages 4–7) during the glacial-interglacial transition, and such a pattern has not been observed at other better dated sites in the Transantarctic Mountains. Similar drift sheets occur in the north-western part of the Shackleton Range in the Haskard Highland and Mount Provender regions and predate the LGM (Höfle & Buggisch Reference Höfle and Buggisch1995, Fogwill et al. Reference Fogwill, Bentley, Sugden, Kerr and Kubik2004). However, with the age constraints available we cannot precisely identify an LGM position of the ice sheet margin.
Although the other stages remain undated we can speculate by analogy to the McMurdo Dry Valleys that Stage 6 (advance and retreat of outlet glaciers) may date from a previous interglacial. Higgins et al. (Reference Higgins, Hendy and Denton2000) showed that interglacial advances of EAIS outlet glaciers have been a persistent feature of that sector of the EAIS inland of the McMurdo Dry Valleys, due to increased precipitation (inferred from the presence of large proglacial lakes) compared with glacial periods. This differs from outlet glaciers in the McMurdo Dry Valleys which are linked to the sea and responded to a fall in sea level and expanded during glacial periods. The Salle Snowfield probably responded more to precipitation change than to any sea level forcing that may have contributed to ice sheet change.
Being at the junction between the west and the east Antarctic ice sheets, constraining the ice history of the Dufek Massif, and the Weddell Sea embayment more generally, contributes to understanding long-term ice sheet history, and ice sheet contributions to sea level (Fogwill et al. Reference Fogwill, Bentley, Sugden, Kerr and Kubik2004). In terms of the Miocene–Pleistocene evolution of the East Antarctic ice sheet the results presented here suggest a relatively stable ice sheet in this sector after Stage 1. Although ice expanded into the over-deepened valleys it did not reach altitudes substantially thicker than occurs today on the Ford Ice Piedmont within c. 1–2 km of the Davis Valley. The geomorphological evidence in the Dufek Massif certainly shows both ice sheet fluctuations and periods of deglaciation but these were of a relatively modest scale, unless non-erosive cold-based glaciation has been pervasive, but we have no field evidence to suggest such a complication. Our data constrained ice thickening to < 760 m altitude throughout the last > 1 Ma with LGM ice in the region representing only a 2–3 km advance to an altitude of 400 m with many of the upper slopes of the mountains remaining ice-free. This is consistent with an emerging dataset from around the Weddell Sea rim that imply only rather modest thickening at the LGM (Mulvaney et al. unpublished, Fogwill et al. Reference Fogwill, Bentley, Sugden, Kerr and Kubik2004, Bentley et al. Reference Bentley, Fogwill, Kubik and Sugden2006, Reference Bentley, Fogwill, Le Brocq, Hubbard, Sugden, Dunai and Freeman2010, Hein et al. Reference Hein, Fogwill, Sugden and Xu2011). This implies a limited sea level contribution from areas between the major ice streams of this sector and supports initial analyses of an ice core drilled at Berkner Island which demonstrated that the ice rise forming the island remained a separate ice dispersal centre throughout the last glacial cycle and was not over-ridden (Mulvaney et al. unpublished). Further work is required to more fully constrain the glacial history, and to incorporate these data into robust ice sheet models of the Weddell Sea embayment.
Because the glacial geomorphology of this region holds such a rich record of ice sheet fluctuations more detailed study of the area could provide further insights into the history of the ice sheet around the Weddell Sea embayment, and complement understanding of the better studied sectors of the Transantarctic Mountains in the Ross Sea embayment, and elsewhere in East Antarctica (e.g. Moriwaki Reference Moriwaki1992, Mackintosh et al. Reference Mackintosh, White, Fink, Gore, Pickard and Fanning2007, Altmaier et al. Reference Altmaier, Herpers, Delisle, Merchel and Ott2010). Some obvious priorities for further work in the Dufek Massif would be: i) to attempt to date some of the older landscape-forming events (Stages 1 and 2) through detailed landform and soil development studies (cf. Bockheim Reference Bockheim2002), ii) to use some combination of 3He, 21Ne and 36Cl cosmogenic isotopes to date the bouldery moraines (Stage 7), and thus avoid the problem of re-working of Dover Sandstone erratics. Dating the mafic boulders stands a better chance of success because of the observation that these are emerging from the present-day ice margin and so at least some of them may thus possibly be free of inheritance, and iii) dating of depth profiles within drift using a suite of isotopes may provide constraints on some of the older deposits (Stages 3–6).
Conclusions
We have mapped the glacial geomorphology of two dry valleys in the northern Dufek Massif, and building on previous work, we propose a seven stage glacial history. From oldest to youngest these stages were:
• Alpine glaciation of the escarpment edge
• Over-riding warm-based glaciation
• Glacier advance to an upper limit (760 m)
• Two ice sheet advances to closely parallel limits in the valleys
• Advance of the plateau outlet glaciers (including Edge Glacier) to merge with the ice sheet
• Finally an advance and retreat of the main ice sheet margin of the Ford Ice Piedmont.
We have attempted to provide age constraints for some of these glacial events using paired cosmogenic 10Be-26Al exposure ages on erratic boulders, composed of Dover Sandstone. Some of these samples yield results implying continuous exposure without evidence of complex burial-exposure events. In the case of our oldest mapped depositional feature (high level drift deposits marking Stage 3) the cosmogenic data provide a minimum age for the glacier advance (and the preceding events) of > 1.0 Ma. Analyses of samples from other depositional landforms lower down in Davis Valley have yielded complex exposure histories and we cannot precisely constrain the ages of these glacier and ice sheet advances. Radiocarbon dating shows that the most recent ice sheet advance and retreat must predate the mid-Holocene.
Our results therefore suggest only a minor LGM (or earlier) ice sheet advance and are consistent with an emerging dataset from around the Weddell Sea rim that imply only rather modest ice sheet thickening in this region at the LGM.
Acknowledgements
This work was funded by the UK Natural Environment Research Council through the British Antarctic Survey and the Cosmogenic Isotope Analysis Facility. Richard Burt (BAS) provided invaluable support in the field. Logistics were provided by the British Antarctic Survey Air Unit and support staff working from Rothera Research Station. Allan Davidson (NERC CIAF) carried out the mineral separation steps and assisted with the chemical sample preparation. The constructive comments of the reviewers are gratefully acknowledged.
Supplemental material
Supplemental material describing laboratory procedures and calculations will be found at http://dx.doi.org/10.1017/S0954102012000016.