I. INTRODUCTION
Advances in materials and processing technologies during the past decades triggered development in information access and wireless communication industries. Dielectric materials found applications as dielectric resonators and filters. There are three main requirements for dielectric materials to be used in device applications: low losses in the microwave range to reduce demands for high power consumption, near-zero temperature coefficient of the resonant frequency, which enables device applications in different environmental conditions, and reduction in size of components, which is achieved by using materials with a high value of dielectric constant. It is challenging to obtain dielectrics with all three optimal properties. A number of materials suitable for microwave devices including Ba2Ti9O20,Reference Plourde, Linn, O’Bryan and Thomson1–Reference O’Bryan, Thomson and Plourde3 ZrTiO4-Zn2Nb2O7,Reference Cava4 and BaO-R2O3-TiO2 [R, rare-earth element (Nd, La, Sm, Pr)]Reference Wakino, Minai and Tamura5 have been studied and used in industrial applications. Dielectric materials with perovskite structure have been extensively investigated. Tantalum-based Ba(B1/3Ta2/3)O3 (B = Mg or Zn) material exhibiting ultra low losses at microwave frequencies was one of the first complex perovskites that satisfied all requirements for dielectric materials.Reference Kawashima, Nishida, Ueda and Ouchi6, Reference Matsumoto, Hiuga, Tanada and Ichimura7 Substitution of Nb5+ for Ta5+ with identical ionic radiusReference Shannon8 produced complex perovskites Ba(B′1/3Nb2/3)O3 (B′ = Mg, Co, Ni, or Zn) with moderate values of quality factor, higher values of dielectric constant, and positive temperature coefficient of resonant frequency. Extensive research on complex perovskites revealed a number of structural factors influencing the material’s microwave performance, such as disorder-1:2-order phase transition, presence of point defects, formation of second phases, and ceramic densification.Reference Davies, Tong and Negas9–Reference Molodetsky and Davies11
Structurally, A(B′1/3B″2/3)O3 consists of a network of corner-sharing BO6 octahedra with an A atom occupying the central position in the cavity formed by BO6 octahedra. Raman spectra are very sensitive to the local cation order and it was demonstratedReference Chia, Chen, Cheng and Lin12–Reference Chia, Chang, Chen, Lin, Ikawa and Lin14 that oxygen octahedra breathing–type mode involving collective motion of oxygen atoms correlates with the quality factor in the microwave range. For example, Chia et al.Reference Chia, Chen, Cheng and Lin12 and Shimada et al.Reference Shimada13 studied changes in the line shape of Raman modes in Ba(Mg1/3Ta2/3)O3 (BMT) and Ba(Mg1/3Nb2/3)O3 (BMN) perovskites and established that materials containing uniform rigid octahedra possess lower losses in the microwave range. The authors concluded that changes in the structure of oxygen octahedra could modify microwave properties.
The uniqueness of the perovskite structure is its ability to tolerate a broad range of cation substitutions and vacancy formation on both A and B sites. The stability of the resulting structure is determined by the Goldschmidt’s tolerance factor t:

For Ba(B′1/3B″2/3)O3 (B′ = Mg, Co, or Zn and B″ = Nb or Ta)Reference Reaney, Colla and Setter15 perovskites, the tolerance factor t > 1, indicating compression of Ba–O bonds because of the presence of the oversized Ba atom and stretching of B–O bonds owing to the small size of B-site atoms. The presence of strain in the studied materials can result in structure relaxation, causing distortion of BO6 octahedra. It was reported that structures containing transition metal ions with empty d-shell orbitals are often found in distorted environments caused by an off-center motion of the transition metal.Reference Halasyamani and Poeppelmeier16–Reference Evans18 For example, Ting et al.Reference Ting, Liu, Withers and Noren19 observed an off-center motion of Nb ion in Ba3CoNb2O9 perovskite. Lufaso performed theoretical simulations that were confirmed by experimental measurements on 1:2-ordered Ba(B′1/3B″2/3)O3 (B′ = Mg, Ni, or Zn and B″ = Nb or Ta) perovskites.Reference Lufaso20 He demonstrated that the oxygen environment around Nb5+ and Ta5+ ions is distorted because of the tendency of transition metal ions Nb5+ and Ta5+ with low-lying d0 orbitals to mix with the orbitals of ligands and create more favorable coordination for oxygen.
Here, we used Raman spectroscopy to study structural changes in Ba(B′1/3B″2/3)O3 (B′ = Mg, Co or Zn and B″ = Nb or Ta) perovskites influenced by nonstoichiometry on either Ba or B′ site. Deviation from stoichiometry is expected to introduce vacancies and soften lattice bonds, facilitating cation diffusion and formation of a 1:2-ordered phase during material sintering. Formation of second phases with large deviation from stoichiometry is likely to influence the overall structure of the system.
II. EXPERIMENTAL METHODS
A conventional two-step solid-state method was used to prepare near-stoichiometric compositions of Ba3+3yB′1+xNb2O9 (B′ = Co or Zn) and of Ba3MgNb2O9. Commercially available powders of BaCO3, ZnO, MgO, Co3O4 (99.95%), and Nb2O5 (99.9%) were used in the preparation process. During the first stage, the corresponding columbites of A2+1+yNb2O6 (A2+ = Mg, Co or Zn) have been synthesized. The calcination temperatures of columbite structure were chosen to be 1200, 1150, and 1000 °C, respectively, for Mg, Co, and Zn systems. During the second stage, corresponding amounts of BaCO3 were added. The sintering of final materials was performed in air for 8 h at 1540, 1470, and 1440 °C, respectively, for Mg, Co, and Zn perovskites. The phase composition and crystal lattice parameters of the sintered ceramics were examined at room temperature in the 2θ = 10°–45° range on powdered samples by a PANalytical X’pert Pro diffractometer with an X’Celerator detector and Cu Kα1 radiation.
Raman measurements were done at room temperature on a Renishaw 2000 spectrometer by using a 514 nm Ar+ ion laser as an excitation source. During the sintering process, evaporation of constituent materials was observed. To eliminate the influence of the surface layer having different compositions because of the evaporation of oxides before measurements, surfaces of all samples were polished with diamond paste (9, 3, 1 μm). Studies on microstructure were done by transmission electron microscopy (TEM). Discs of 3-mm diameter were cut from the sintered samples. After mechanical dimpling to a thickness of 30 μm in the center, the specimens were ion-milled by a Gatan Precision Ion Polishing System (PIPS) to electron transparency. TEM measurements were done on a Philips CM12 system operating at 120 kV.
III. RESULTS
A. Crystal structures of nonstoichiometric perovskites
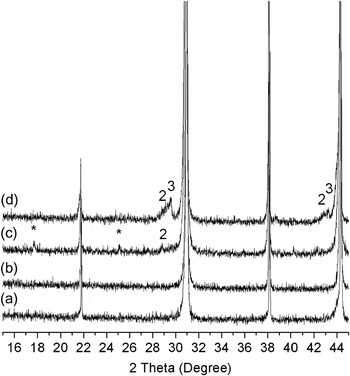
Formation of a 1:2-ordered phase having P-3m1 space group when B′ and B″cations are ordered in –B′–B″–B″–B′– sequence along [111] direction of the perovskite cubic cell is characterized by a unit cell distortion and an increase in c/a lattice parameter as a result of electrostatic repulsion between two neighboring B″ cations. In the x-ray diffraction (XRD) pattern, 1:2 cation order manifests itself in a series of diffraction peaks, the strongest of which is at 2θ = 17.7°. Results of XRD patterns of Ba3Co1+xNb2O9 perovskites with variable Co concentrations are shown in Fig. 1. Samples with nominal Co concentration and an excess of Co, according to the XRD pattern represent single-phase materials. Upon close examination, superlattice diffraction peaks appear in samples with small Co deficiencies (1 + x = 0.93) and decrease with further reduction in the Co content. Disappearance in the x-ray peak responsible for the 1:2-ordered phase is accompanied by the appearance of extra peaks that were attributed to the Ba-rich Ba5Nb4O15 phase for moderate values of Co deficiency and a phase isostructural to Ba8ZnTa6O24 for higher values of Co deficiencies. So, gradual decrease in Co concentration results in the formation of a Ba5Nb4O15 structure, the concentration of which increases with reduction in Co content and appearance of Ba8CoNb6O24 structure with high Co deficiencies.
X-ray diffraction (XRD) patterns of Ba3Co1+xNb2O9 (a) 1+x = 1.03, (b) 1+x = 1, (c) 1+x = 0.93, (d) 1+x = 0.85. * superlattice splitting; 2, Ba5Nb4O15; and 3, Ba8CoNb6O24.

Ba5Nb4O15 structures belong to the family of AnBn -1O3n perovskites in which BO6 corner-sharing octahedra forming infinite perovskite slabs of (n − 1) thickness are separated by a layer of cation vacancies.Reference Vanderah, Collins, Wong-Ng, Roth and Farber21 The Ba8CoNb6O24 structure represents a mixture of corner-sharing and face-sharing BO6 octahedra, with the latter randomly occupied by Nb, Co, and cation vacancies.Reference Moussa, Claridge, Rosseinsky and Clarke22 Both structures are reported to have the same space group, P-3m1.
Materials containing ZnO are well known for difficulties during sintering at high temperatures because of the volatility of ZnO Reference Kim, Kim, Cheon, Kim, Nahm and Byun23, Reference Davies, Borisevich and Thirumal24 and consequent formation of a number of zinc-deficient second phases, such as BaTa2O6,Reference Tolmer and Desgardin25 Ba3Ta2O8,Reference Desu and O’Bryan26 Ba5Nb4O15,Reference Davies, Borisevich and Thirumal24, Reference Hughes, Azough, Freer and Iddles27 and Ba8ZnTa6O24.Reference Moussa, Claridge, Rosseinsky and Clarke22
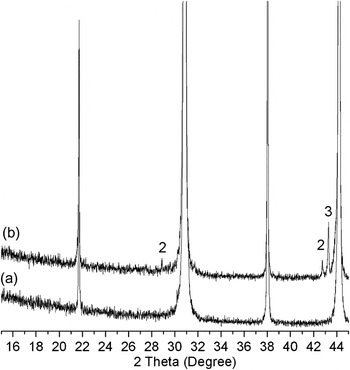
X-ray data of Ba3Zn1+xNb2O9 perovskites are shown in Fig. 2. The single-phase stoichiometric Ba3ZnNb2O9 composition was refined in terms of a cubic unit cell with space group Pm-3m. By reducing the Zn content, formation of Zn-deficient Ba5Nb4O15 and Ba8ZnNb6O24 was promoted. Contrary to the Co system, in samples with Zn nonstoichiometry, second phase formation starts at smaller values of Zn deficiencies that would be expected in the light of ZnO volatility. No evidence of superstructure reflection peaks was found in any of the studied samples with Zn nonstoichiometry.
XRD patterns of Ba3Zn1+xNb2O9. (a) Stoichiometric composition; (b) zinc-deficient sample (1+x = 0.93); 2- Ba5Nb4O15; and 3-Ba8ZnNb6O24.

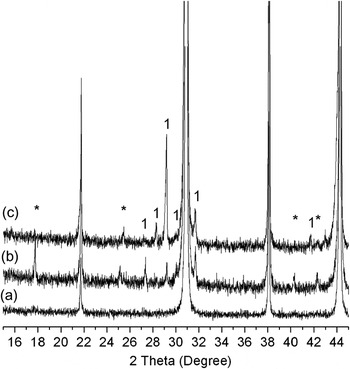
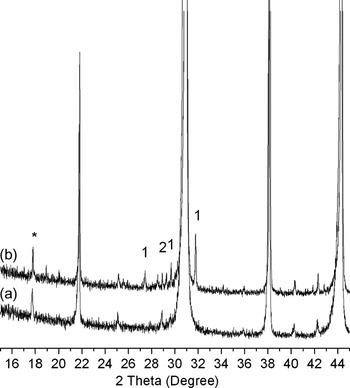
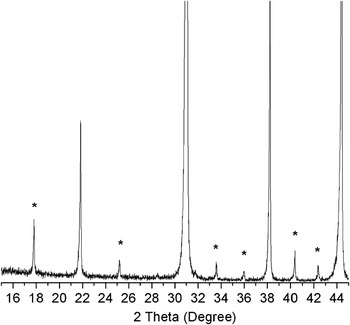
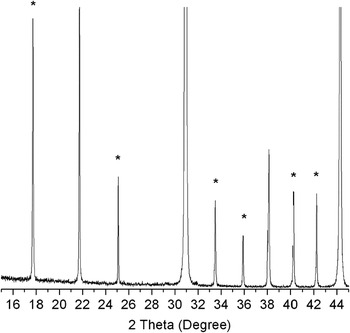
Figures 3 and 4 show diffraction patterns of, respectively, Ba3+3yCoNb2O9 and Ba3+3yZnNb2O9 perovskites with changes in Ba concentration. Both materials are characterized by the appearance of superlattice diffraction peaks and peaks originating from the formation of second phases. In the case of the Ba3+3yCoNb2O9 system, according to the XRD results, samples with excess of Ba represent single-phase material. By reducing the Ba content, peaks indicating the formation of a 1:2-ordered phase appear. The intensity of the superstructure-reflection peaks increases toward intermediate values of Ba deficiencies (3 + 3y = 2.94) and then decreases with further decrease in Ba content (3 + 3y = 2.7). Reduction in Ba content from the nominal value is accompanied by the appearance of additional peaks that were attributed to the Ba6CoNb9O30 system, as reported by Foster et al.Reference Foster, Brown, Nielson and Abrahams28 The concentration of a Ba6CoNb9O30 phase representing a tungsten–bronze ferroelectric with space group P4bm increases with the decrease in Ba content. From Fig. 4, it can be seen that the Ba3+3yZnNb2O9 system exhibits similar behavior, except that ZnO evaporation promotes the formation of an additional Ba5Nb4O15 phase.
XRD patterns of Ba3+3yCoNb2O9. (a) 3+3y = 3; (b) 3+3y = 2.94; (c) 3+3y = 2.7; *- superlattice splitting; and 1- Ba6CoNb9O30.

XRD patterns of Ba3+3yZnNb2O9. (a) 3+3y = 2.985; (b) 3+3y = 2.94; *- superlattice splitting; 1- Ba6ZnNb9O30; and 2- Ba5Nb4O15.

From Figs. 5 and 6, one can see that Ba3MgNb2O9 (BMN) and Ba3MgTa2O9 (BMT), respectively, contain 1:2-ordered structure without any evidence of second phase formation.
XRD of Ba3MgNb2O9 (BMN).

XRD pattern of Ba3MgTa2O9 (BMT).

B. Raman spectra
Raman spectra of complex perovskite–type materials are often analyzed based on the different types of cation ordering inherent to this class of oxides. The starting point is that an ideal centrosymmetric disordered cubic A(B′1/3B″2/3)O3 structure is expected to have a total of five modes: three infrared active modes, one acoustic and one silent mode.Reference Siny, Tao, Katiyar, Guo and Bhalla29, Reference Moreira, Matinaga and Dias30 In the first-order vibrational spectrum, disordered perovskites having Pm-3m space group are not Raman active. Perovskite-type materials with 1:2 B-site cation ratio often exhibit partial 1:1 ordering. 1:1 ordering was found in Ba and Pb systems, such as Ba(Zn1/3Nb2/3)O3Reference Lee, Lin, Huang, Su and Hu31 and Pb(Mg1/3Nb2/3)O3.Reference Chen, Chan and Harmer32, Reference Hilton, Barber, Randall and Shrout33 Despite the 1:2 cation ratio of B-site cations, no evidence of a 1:2-ordered structure in Pb(B′1/3B″2/3)O3 materials has been reported. In the case of partial 1:1-cation order with space group Fm-3m, group-theory analysis predicts the existence of four Raman active modesReference Smolensky, Siny, Pisarev and Kuzminov34:

B-site cation ordering resulting in trigonal distortion and formation of a 1:2-ordered phase with P-3m1 space group according to the group-theory analysis is anticipated to show nine Raman active modesReference Siny, Tao, Katiyar, Guo and Bhalla29, Reference Moreira, Matinaga and Dias30

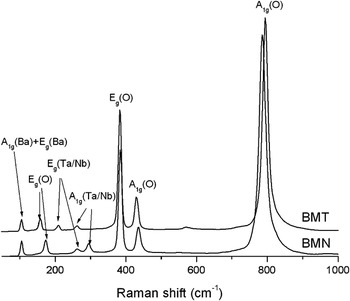
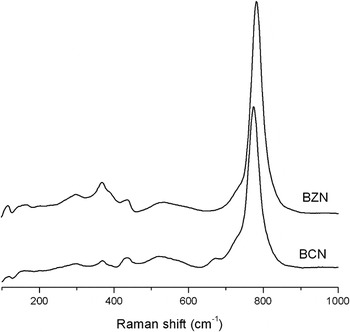
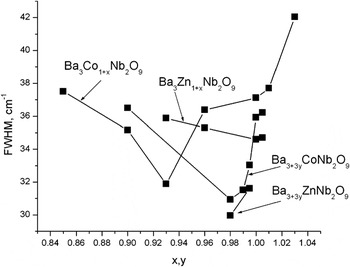
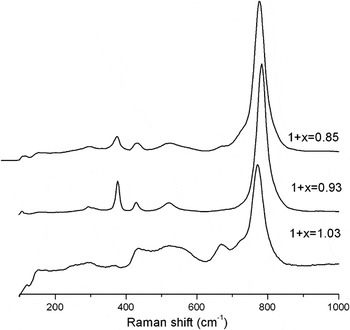
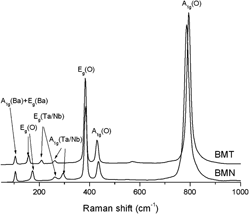
An important feature of the group-theory prediction in the case of the P-3m1 space group is the dependence of the Raman frequencies on the masses of A and B″ cations.Reference Siny, Tao, Katiyar, Guo and Bhalla29 Typical Raman spectra of Ba3MgNb2O9 (BMN) and Ba3MgTa2O9 (BMT) are shown in Fig. 7. BMN and BMT samples exhibit seven distinct sharp modes. Recent simulations done by Dai et al.Reference Dai, Zhao and Liu35 demonstrated that all modes could originate from 1:2 ordering. Close examination of the measured Raman spectra indicates that all modes (except for the high frequency mode) in perovskites containing heavier Ta5+ cation are shifted toward lower energies in comparison to the Nb-counterpart. Dependence of the position of peaks on the mass of heavier Ta5+ cation indicates that observed Raman modes are due to the formation of the 1:2-cation order. According to the work by Dai et al.,Reference Dai, Zhao and Liu35 the mode assignment is as follows: The low frequency mode at 105 cm−1 is assigned to the A1g + Eg Ba vibrations. In the case of heavier Pb atoms on the A site, the frequency of this mode reduces to around 60 cm−1.Reference Setter and Laulicht36 Substitution by lighter Sr atoms on the A-site shifts the mode to higher values (150 cm−1 in SrAl1/2Nb1/2O3Reference Tao, Guo, Tu, Siny, Katiyar, Guo and Bhalla37). The mode at 157 and 174 cm−1, respectively, for BMT and BMN samples corresponds to the internal oxygen vibration Eg. Low intensity modes at 209 and 262 cm−1 in BMT perovskites that shift to higher energy values of 262 and 295 cm−1 with substitution of the heavier Ta atom for Nb correspond to the A1g and Eg vibrations of Ta/Nb. The modes at 383 and 430 cm−1 are assigned to Eg and A1g internal oxygen vibrations. The most intense A1g mode around 800 cm−1 is due to the collective oxygen-breathing type motions. Comparison of the Raman spectra of BMN and BMT samples presented in Fig. 7, where the 1:2-ordered phase is formed according to the XRD data, to those of Ba3CoNb2O9 (BCN) and Ba3ZnNb2O9 (BZN) materials (Fig. 8), where no 1:2 ordering was detected by the XRD technique, supports the idea that the above mentioned modes originate from the 1:2-ordered structures. BCN and BZN spectra presented in Fig. 8 are diffuse and do not contain distinct peaks except at 800 cm−1, indicating the disappearance of 1:2 order in Co and Zn systems. It is worth mentioning that the oxygen octahedra breathing-type mode also changes its line shape with substitution of Nb for Ta and Zn and Co for Mg. The full width at half maximum (FWHM) of the A1g(O) mode increases with a decrease in the degree of the 1:2 ordering. In the Refs.Reference Molodetsky and Davies11 and Reference Lee, Lin, Huang, Su and Hu31, the authors correlated the FWHM of A1g(O) as well as of the Eg, and A1g modes originating from Ta/Nb vibrations with the microwave quality factor. Ta-based perovskites demonstrate a larger quality factor in comparison to their Nb counterparts.Reference Akbas and Davies38 The quality factor of Nb stoichiometric perovskites of Co and Zn used in our current studies is smaller than their Mg analog.Reference Belous, Ovchar, Kramarenko, Bezjak, Jancar, Suvorov and Annino39 Because of the diffused character of the modes between 200 and 300 cm−1 in BZN and BCN materials, we were able to correlate the FWHM with the microwave quality factor reported by Belous et al.Reference Belous, Ovchar, Kramarenko, Bezjak, Jancar, Suvorov and Annino39 only for the oxygen breathing-type mode: the FWHM is the smallest for the BMT system and increases through BMN and BZN perovskites toward the BCN system. The position of A1g(O) also changes with different atomic substitutions. In the case of Co-based materials, the oxygen octahedra mode is at 773 cm−1. Its energy increases to 784, 786, and 795 cm−1, respectively, for BZN, BMN, and BMT materials, indicating the formation of octahedra with stronger B–O bonds. The FWHMs of the A1g(O) mode of Ba(B′1/3Nb2/3)O3 perovskites (B′ = Zn or Co) with near-stoichiometric compositions are shown in Fig. 9. In the Ba3+3yCo1+xNb2O9 system, the maximum Qxf value (product of the quality factor and the measuring frequency) corresponding to the smallest FWHM is observed for 1 + x = 0.93 and 3 + 3y = 2.94 in the case of Co and Ba nonstoichiometry, respectively. By substituting Zn for Co, the FWHM remains nearly constant with a variation in Zn content and decreases with an increase in Ba deficiency. The A1g(O) peak position follows the same trend: a decrease in the FWHM (larger values of Qxf) shifts A1g(O) mode to higher frequencies. As an illustrative example, we provide here Raman spectra of BCN perovskites with nonstoichiometry on the Co site (Fig. 10). The sample with the highest degree of 1:2 cation ordering (1 + x = 0.93) is characterized by the formation of sharp peaks described above. Changes in the Co concentration from 1 + x = 0.93 decreases the ordering degree and produces Raman spectra with diffused modes. Ba-deficient Co perovskites and the Zn system demonstrate similar features: Raman modes become more diffuse with a decrease in the ordering degree, but are still present in the disordered cubic phase. To understand the origin of the changes in the Raman spectra of the studied materials, we should look at structural changes that occur in the system with variations in the composition.
Raman spectra of stoichiometric BMN and BMT perovskites.

Raman spectra of stoichiometric Ba3CoNb2O9 and Ba3ZnNb2O9 perovskites.

Change in FWHM of A1g(O) mode for different nonstoichiometrical compositions.

Raman spectra of Ba3Co1+xNb2O9.

C. Stability of perovskite structure: 1:1 ordering
As has already been mentioned, systems under consideration represent strained structures with tolerance factors t > 1, meaning that Ba–O bonds are too long and B–O bonds are too short for the given geometrical arrangement of atoms. The presence of highly charged transition metal ions with d0 electronic configuration can distort the structure through off-center motion of the d0 ion and consecutive creation of bonds with different B–O lengths. The perovskite structure A(B′1/3B″2/3)O3 (where the B″ cation has d0 electronic configuration) with two different cations on the B-site represents corner sharing arrangement of two nonequivalent BO6 octahedra (B = B′ and B″). Changes within one unit cell containing a d0 transition metal ion are accommodated via a cooperative displacement of neighboring atoms.Reference Kunz and Brown40 In the case of the disordered Pm-3m cubic structure where B′ and B″ cations are randomly distributed inside the oxygen octahedra, an off-center motion of the B″ cation is difficult to accommodate by neighboring octahedra containing B′ ions. 1:1 partial ordering or 1:2 ordering can more easily accept changes caused by the d0 ion. Thus, the tendency to create an unstrained environment can be a driving force during structure modification.
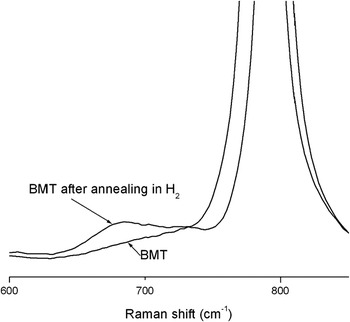
The onset of disorder–order phase transition occurs at the atomic level. The ordering process involves B-site cation motion between two neighboring sites. By introducing B-site vacancies, one can more easily “swap” two cations facilitating an ordering process. According to the XRD measurements, deviation from stoichiometry results in an appearance of 1:2 ordering. Diffraction peaks corresponding to 1:1 ordered regions were not found. Formation of partial 1:1 B-site cation ordering in perovskites with a 1:2 cation ratio would create an excess of negative charge that should be compensated by the surrounding composition. Requirements for local charge compensation by the rest of the material limits the formation of 1:1-ordered regions on a nanometer scale.Reference Harmer, Chen, Peng, Chan and Smyth41 Small volumes of the partially ordered structure explain the insensitivity of x-ray technique to detect it. To reveal the presence of 1:1 order, we examined the Raman spectra of BMT (sintered at 1650 °C and annealed at 1350 °C with 100 ccm H2) sample annealed in hydrogen atmosphere. Annealing in an oxygen-deficient atmosphere can introduce oxygen vacancies that will compensate for local charge imbalance created by 1:1 order. Raman spectra of samples annealed in H2 contain one additional peak at ∼670 cm−1 (Fig. 11). We attribute this peak to the formation of the 1:1-ordered phase. As the most intense peak in Raman spectra comes from the collective motion of oxygen atoms, it would be reasonable to assume that the 670 cm−1 peak originates from the breathing-type mode of oxygen octahedra in the 1:1-ordered structure. Introduction of oxygen vacancies promotes the formation of partial ordering through charge compensation around 1:1 nanoregions, but still leaves charged areas inside the ordered domains. It will destabilize oxygen octahedra making B–O bonds softer and shifting the frequency of the breathing type mode to lower values. Samples Ba3+3yCo1+xNb2O9 with compositional variation on the positions of Ba and Co also exhibit peaks at 670 cm−1 (Fig. 10). In the case of Co nonstoichiometry, the intensity of this peak slowly reduces toward 1 + x = 0.93 (maximum in 1:2 order) and increases again with further reduction in Co concentration. For the samples with variations in Ba content, the minimum intensity of the 670 cm−1 peak was observed for 3 + 3y = 2.94 (maximum in 1:2 order). So, increases in one type of ordering result in decreases of the other. No evidence of formation of 1:1 order was found in the Zn system. This can be explained by ZnO vaporization during the sintering process and the formation of Zn-deficient phases.
Raman spectra of stoichiometric Ba3MgTa2O9 annealed in H2.

D. TEM measurements
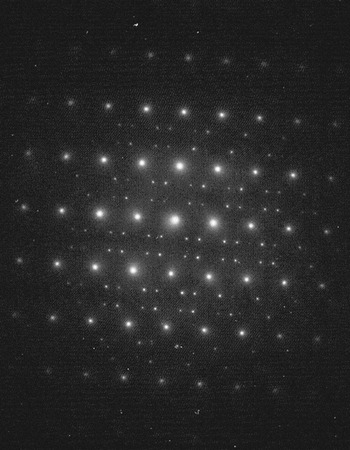
TEM proved to be sensitive to short-range cation ordering.Reference Barber, Moulding, Zhou and Li42–Reference Kim, Kim and Chung44 To support our assumption about the origin of the 670 cm−1 mode, several BCN and BZN samples were examined by means of TEM. Figures 12 and 13 show the results of TEM measurements of Ba3Co0.85Nb2O9 and Ba3Co0.93Nb2O9 samples. Selected-area electron diffraction (SAED) of Ba3Co0.85Nb2O9 perovskites exhibiting intense 670 cm−1 peaks is characterized by the appearance of {h ± 1/2, k ± 1/2, l ± 1/2} reflections, indicating the formation of 1:1 ordering. On the contrary, SAED of the Ba3Co0.93Nb2O9 system shows {h ± 1/3, k ± 1/3, l ± 1/3} lattice reflections, demonstrating the formation of the 1:2-ordered phase, which is in agreement with X-ray measurements. No evidence of partial order was found in BZN samples and materials with high degree of 1:2 order. Similar behavior was observed in Ba(B′1/3B″2/3)O3 perovskites (B′ = Zn or Mg and B″ = Nb or Ta).Reference Lee, Lin, Huang, Su and Hu31, Reference Barber, Moulding, Zhou and Li42 The authors reported the appearance of 1:1 ordering during the initial stages of the ordering process that changes into long-range 1:2 B-site cation order. Small traces of 1:1 order were found in highly 1:2-ordered BMT samples.
Electron diffraction pattern collected from Ba3Co0.85Nb2O9 sample showing {h ± 1/2, k ± 1/2, l ± 1/2} lattice reflections.

Electron diffraction pattern collected from Ba3Co0.93Nb2O9 sample showing {h ± 1/3, k ± 1/3, l ± 1/3} lattice reflections.

IV. DISCUSSION
Theoretical calculations by Ting et al. on the example of the Ba(B′1/3B″2/3)O3 (B′ = Co and B″ = Nb) perovskite demonstrated that the formation of a disordered phase with random distribution of the B-site cations is unfavorable because of the overbonding of the B′ cation and underbonding of the B″ cation.Reference Ting, Liu, Withers and Noren19 The authors showed that 1:2-cation order accompanied by trigonal distortion results in expansion of the B′O6 oxygen octahedra and contraction of the B″O6 ones, thus creating a more favorable cation–anion environment.
Deviation from stoichiometry on B′-sites creates cation vacancies that serve as a starting point for 1:1 ordering. This partial ordering relaxes the lattice structure through off-center motion of d0 transition metal ions. Strong internal electric fields created by 1:1 domains and the rest of the materialsReference Grebennikov, Ovchar, Belous and Mascher45 can facilitate cation diffusion, resulting in the formation of 1:2 ordering, which further accommodates distortions around the d0 cations. At some point, when cation deficiencies are high enough to form an additional Zn- or Co-deficient phase, the Ba5Nb4O15 second phase appears. Ba5Nb4O15 has slab structure separated by an ordered layer of cation vacancies. It has been reportedReference Vanderah, Collins, Wong-Ng, Roth and Farber21 that the bond network around the octahedra containing cation vacancies is relaxed in comparison to the rest of the system. This part of the system is more flexible and able to accommodate distortions from the rest of the material. So, the requirements to maintain mass balance result in the formation of the structurally flexible Ba5Nb4O15 system and the disappearance of the 1:2 order. In the system with Zn nonstoichiometry, ZnO evaporation leads to the formation of Zn-deficient phases at small values of Zn deficiencies, which might be the reason for the absence of superlattice peaks originating from 1:2 cation order in the XRD pattern (Fig. 2). Bieringer et al.Reference Bieringer, Moussa, Noailles, Burrows, Kiely, Rosseinsky and Ibberson46 and Mallinson et al.Reference Mallinson, Claridge, Rosseinsky, Ibberson, Wright and Fitch47 observed formation of a Zn-deficient Ba8ZnTa6O24 phase as a result of the loss of ZnO during the sintering of Ba3ZnTa2O9 perovskite. Studying the kinetics of cation ordering, Mallinson et al. mentioned that the ideal perovskite structure itself can tolerate some level of B-site cation deficiencies that influence the kinetics of the ordering process. Excessive amounts of cation vacancies cannot be accommodated by the perovskite structure and result in precipitation of second phases.Reference Mallinson, Claridge, Rosseinsky, Ibberson, Wright and Fitch47 Bieringer et al.Reference Bieringer, Moussa, Noailles, Burrows, Kiely, Rosseinsky and Ibberson46 reported observing two distinct ordered domains having different degrees of cation order as well as different unit cell volumes. The first, fully ordered, domains have large unit cell volume, whereas partially ordered domains were characterized by reduced unit cell volumes. The difference in volumes was attributed to the formation of vacancies on the B-site. The less ordered phases containing B-site cation vacancies were reported to facilitate the ordering process.
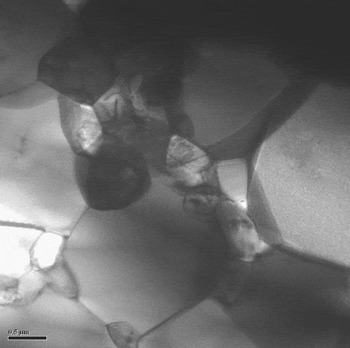
Lattice softening caused by the reduction in Ba content destabilizes oxygen octahedra, promoting the formation of 1:2-ordered domains. The appearance of the Ba6B′Nb9O30 (B′ = Co or Zn) phase in samples with high Ba deficiencies seems to stop the 1:2-ordering process. The reason for this is a change in the microstructure. Ba6B′Nb9O30 (B′ = Co or Zn) was found to form between grains acting as a “liquid” phase.Reference Ahn, Nahm, Lim, Choi, Park and Lee48 The growth rate of grains during the sintering process depends on the surface energy of the material from which the grains are composed. The surface energy between two solids is less than the surface energy between solid and air.Reference Kingery49 Thus, sample preparation involving a “liquid” phase is expected to produce materials with higher density and coarser grains. Figures 14 and 15, respectively, show TEM images of Ba2.7CoNb2O9 and Ba2.94CoNb2O9 samples, demonstrating the difference in grain sizes. The former contains the “liquid” phase with Ba6CoNb9O30 composition and has grains larger in diameter. Increase in the grain size reduces the amount of defects that are often present on the surface of grains and participate in the ordering process.
Transmission electron microscopy (TEM) image of Ba2.7CoNb2O9 sample showing grain coarsening.

TEM image of Ba2.94CoNb2O9 sample showing more homogeneous distribution of grains and formation of different kinds of defects inside the grains (note difference in scale with Fig. 14).

V. CONCLUSIONS
Near-stoichiometric compositions of Ba(B′1/3B″2/3)O3 (B′ = Mg, Co, or Zn and B″ = Nb or Ta) were studied by means of Raman spectroscopy and TEM measurements. Measured Raman-active modes have been ascribed to the 1:2 cation order based on the changes in the ordering degree (revealed by XRD) and predicted mode dependence on the mass of B″-cation. The degree of cation order depends on the appearance of Ba- and Nb-rich phases that change the material microstructure. The FWHM of the most intense A1g(O) mode representing collective motion of oxygen anions correlates with microwave losses. As has been demonstrated by Raman spectroscopy, the 1:2 cation ordering process decreases the FWHM of the A1g(O) mode and shifts the A1g(O) mode to higher energies, indicating the formation of more rigid BO6 octahedra with stronger metal–oxygen bonds.
The tendency of highly charged transition metal ions with d0 electronic configuration to create a distorted environment resulted in the formation of “partially” 1:1-ordered structure, the amount of which increases with the reduction in 1:2 cation order. Uncompensated charge within 1:1-ordered domains lead to “softening” of oxygen octahedra and shifting of the A1g(O) vibration from 1:1-ordered structure toward lower energies.
ACKNOWLEDGMENT
The authors thank Dr. A.G. Belous and Dr. O.V. Ovchar (V.I. Vernadskii Institute of General and Inorganic Chemistry NAS of Ukraine, Kiev, Ukraine) for providing selected Nb-based samples, Dr. T. Kolodiazhnyi (National Institute for Materials Science, Tsukuba, Japan) for providing the tantalum-based samples, Dr. A. Dabkowski and Mr. Evgueni Chelomentsev for discussions and advice in the preparation of the samples. This work was funded through the Natural Sciences and Engineering Research Council of Canada (NSERC).