





Impact statement
Plant litter decomposition is a critical process that regulates carbon and nutrient cycling in ecosystems. Researchers have long struggled to predict decomposition rates in dryland ecosystems, and this limits our ability to predict rates of carbon and nutrient turnover. Part of the measurement-model disconnect appears to be that simple climate predictors, such as monthly or annual rainfall and temperature, are effective at predicting litter microbial processes in wet systems but fail in drylands due to the very short time scales that litter is sufficiently wet for microbial decomposition. In addition, drylands are spatially heterogeneous and litter frequently accumulates in locations where microclimate conditions differ substantially from mean values. By exploring patterns of litter moisture in the hyperarid Namib Desert, this study provides key data on how litter moisture responds to rainfall and atmospheric humidity. Results from this study illustrate the highly dynamic nature of litter moisture in hyperarid systems and the role of litter traits and degradation condition, atmospheric humidity, and burial in influencing the litter moisture patterns. These results suggest that rainfall alone may not adequately predict litter decay dynamics in the Namib and other drylands, which is a contrast to more predictable relationships between precipitation and soil microbial processes. As a result, consideration of short-term patterns of precipitation pulses and non-rainfall moisture may be required to improve the accuracy of decomposition models in these extreme environments. In addition, consideration of litter burial in models appears important given the role of burial as a key mediator of litter moisture and subsequent microbial decomposition. Improving predictions of litter decomposition in global drylands is critical to improved characterization of biogeochemical cycling in these globally extensive systems.
Introduction
Plant litter decomposition is a key biogeochemical process that mediates the fate of dead organic material and its movement into soil, plant, or atmospheric pools (Prescott, Reference Prescott2010). The controls over this critical process, which alters nutrient availability and carbon storage, are well-described in mesic ecosystems. However, there is a long-standing model-measurement mismatch for decomposition in dryland ecosystems (Whitford et al., Reference Whitford, Meentemeyer, Seastedt, Cromack, Crossley, Santos, Todd and Waide1981). This mismatch may be explained partly by the greater importance of abiotic factors (solar radiation, thermal degradation) in drylands than mesic systems (Song et al., Reference Song, Peng, Jiang, Zhu and Wang2013; Barnes et al., Reference Barnes, Throop, Archer, Breshears, McCulley and Tobler2015), although the majority of decomposition still appears to be driven by biotic activity (King et al., Reference King, Brandt and Adair2012). An additional reason for this mismatch is the generally poor characterization of litter distribution and decomposition relative to the extreme spatial heterogeneity of drylands (Throop et al., Reference Throop, de Graaff and Belnap2025) as well as temporal heterogeneity of conditions supporting microbial activity (Evans et al., Reference Evans, Allison and Hawkes2022). Lack of a detailed spatio-temporal context for where litter accumulates, and microclimate conditions in those locations may underestimate decomposition rates (Throop et al., Reference Throop, de Graaff and Belnap2025).
Hyperarid ecosystems (locations where annual rainfall divided by annual potential evapotranspiration is <0.05 mm mm−1; Middleton and Thomas, Reference Middleton and Thomas1992) are some of the most extreme locations on Earth, where biological processes are rarely released from moisture constraints. Decomposition is poorly understood in these systems (Zhao et al., Reference Zhao, Lu, Shi, Huang and Fu2025), with a global synthesis providing no litterfall or litter pool data (Holland et al., Reference Holland, Post, Matthews, Sulzman, Staufer and Krankina2014). This is a substantial gap in quantifying global biogeochemical cycles, because hyperarid systems account for 13% of dryland area and ~6% of total land area globally (Prăvălie, Reference Prăvălie2016).
The pulsed nature of moisture inputs driving bursts of biological activity is a well-known paradigm in drylands (Noy-Meir, Reference Noy-Meir1973; Austin et al., Reference Austin, Yahdjian, Stark, Belnap, Porporato, Norton, Ravetta and Schaeffer2004; Huxman et al., Reference Huxman, Snyder, Tissue, Leffler, Ogle, Pockman, Sandquist, Potts and Schwinning2004) and should be particularly relevant to hyperarid systems. Biotic decomposition can occur in short windows of opportunity following rainfall (Lee et al., Reference Lee, Fitzgerald, Hewins, McCulley, Archer, Rahn and Throop2014), but timing and amount matter as pulses may dry before stimulating microbial activity (Joly et al., Reference Joly, Kurupas and Throop2017). Precipitation is a reasonable proxy of moisture availability in mesic systems, but microbial activity in hyperarid systems can also be activated by non-rainfall moisture inputs, including fog (Jacobson et al., Reference Jacobson, van Diepeningen, Evans, Fritts, Gemmel, Marsho, Seely, Wenndt, Yang and Jacobson2015), dew (Dirks et al., Reference Dirks, Navon, Kanas, Dumbur and Grünzweig2010) and high atmospheric humidity (Evans et al., Reference Evans, Todd-Brown, Jacobson and Jacobson2020). Non-rainfall moisture inputs may account for a substantial portion of the time when litter is sufficiently wet for microbial activity, in systems spanning from hyperarid deserts to mesic grasslands (Evans et al., Reference Evans, Todd-Brown, Jacobson and Jacobson2020). We therefore expect biotic decomposition to be driven at short time scales (hours to days) in hyperarid systems, during windows of opportunity with sufficient litter moisture derived from both rainfall and non-rainfall moisture inputs. Given the critical importance of moisture pulses and non-rainfall moisture in drylands globally, improved understanding of moisture dynamics in a hyperarid system will provide insight into mechanistic decomposition controls in globally extensive drylands.
Litter characteristics may influence the water-holding capacity (WHC) and the time that litter is moist enough for microbial activity. Physical structure such as cuticle integrity, surface and internal chemistry, leaf area, and trichome presence influence litter WHC (Talhelm and Smith, Reference Talhelm and Smith2018; Rajão et al., Reference Rajão, Berg, Cornelissen and Dias2023; Feng et al., Reference Feng, Zhao, Zhang, Zhang, Fan, Han and Zhao2025), with the potential to influence ecosystem processes such as microbial decomposition rates, runoff and hydrological cycling, and forest floor flammability (Kane et al., Reference Kane, Kreye, Barajas-Ramirez and Varner2021; Rajão et al., Reference Rajão, Berg, Cornelissen and Dias2023). These characteristics change during litter degradation, which in turn modifies litter WHC (Castagnolli et al., Reference Castagnolli, Boggiani, Lima, Lima and Tonello2023). In addition, partial or complete burial of litter by wind, water, or animal activity (Throop and Belnap, Reference Throop and Belnap2019) can slow moisture loss and extend windows of opportunity for microbial decomposition (Lee et al., Reference Lee, Fitzgerald, Hewins, McCulley, Archer, Rahn and Throop2014; Joly et al., Reference Joly, Kurupas and Throop2017). As a result, soil-litter mixing can accelerate litter decomposition (Throop and Archer, Reference Throop and Archer2007; Hewins et al., Reference Hewins, Archer, Okin, RL and Throop2013; Liu et al., Reference Liu, Wang, Jiang, Pan, Huang, Dong and Cornelissen2018).
Although moisture plays a key role in regulating dryland decomposition, we have few estimates of the short-term windows of moisture availability that presumably drive most of the microbial activity in these systems. The lack of instrumentation to measure short-term litter microclimate variables exacerbates this problem (Wang et al., Reference Wang, Throop and Gill2015). Both measurements and models indicate that non-rainfall moisture can sufficiently moisten standing dead litter to activate decomposer activity, and that even hourly wet periods can drive microbial decomposition (Dirks et al., Reference Dirks, Navon, Kanas, Dumbur and Grünzweig2010; Gliksman et al., Reference Gliksman, Rey, Seligmann, Dumbur, Sperling, Navon, Haenel, De Angelis, Arnone and Grünzweig2017; Evans et al., Reference Evans, Todd-Brown, Jacobson and Jacobson2020). In fact, non-rainfall moisture can account for a substantial proportion of the time that standing dead litter is sufficiently wet for decomposition, even in hyperarid systems (Evans et al., Reference Evans, Todd-Brown, Jacobson and Jacobson2020).
Study overview
We conducted three experiments in the hyperarid Namib Desert to evaluate how litter moisture responded over short time scales to moisture inputs and how this response differed with litter physical characteristics and by burial in soil. We carried out a laboratory study assessing litter WHC from different plant species and litter degradation conditions. We then carried out field studies assessing litter moisture content for both surface and buried litter following simulated rainfall events. We tested three hypotheses: 1) litter WHC would differ among litter species and degradation conditions, with partially degraded litter holding more water than fresh litter proportionally due to changes in leaf physical structure with decomposition (Talhelm and Smith, Reference Talhelm and Smith2018; Rajão et al., Reference Rajão, Berg, Cornelissen and Dias2023; Feng et al., Reference Feng, Zhao, Zhang, Zhang, Fan, Han and Zhao2025), 2) litter moisture following simulated rainfall would vary with rainfall pulse size, litter species, and litter condition based on differential WHC (Castagnolli et al., Reference Castagnolli, Boggiani, Lima, Lima and Tonello2023), and 3) soil burial would extend the time that litter remained wet following a rainfall event, with a larger rainfall event and deeper burial having additive effects on litter moisture retention (Joly et al., Reference Joly, Kurupas and Throop2017). This research aims to advance our understanding of litter moisture and decomposition dynamics in globally important hyperarid systems.
Methods
Study site
We worked at the Gobabeb Namib Research Institute within the Namib-Naukluft Park in the central Namib Desert of Namibia. The climate is hyperarid, with mean annual rainfall of 27.2 mm and mean annual temperature of 21.1 °C (Lancaster et al., Reference Lancaster, Lancaster and Seely1984). Gobabeb lies at the inland edge of the fog belt from the Atlantic Ocean (mean annual potential fog precipitation is 20.8 mm; Lancaster et al., Reference Lancaster, Lancaster and Seely1984). We used litter from Stipagrostis sabulicola, the dominant hummock-forming grass in the Namib Sand Sea near Gobabeb, and Salvadora persica, a dominant broad-leaved shrub in the Kuiseb River floodplain. Stipagrostis spp. are a major food source for macroinvertebrate and vertebrate detritivores (Pietruszka et al., Reference Pietruszka, Hanrahan, Mitchell and Seely1986; Crawford and Seely, Reference Crawford and Seely1993) and play a controlling role in soil C dynamics (Throop et al., Reference Throop, Seely and Marufu2020). Salvadora persica is widely distributed through arid and semi-arid regions in Africa and Asia and is widely used for traditional and modern ethnobotanical purposes (Aumeeruddy et al., Reference Aumeeruddy, Zengin and Mahomoodally2018). Neither species appears able to obtain moisture directly from fog (Wang et al., Reference Wang, Kaseke, Ravi, Jiao, Mushi, Shuuya and Maggs-Kölling2019).
We obtained data on ambient conditions (air temperature and relative humidity at 2 m height, soil temperature, potential fog precipitation via a Juvik cylinder at 1.5 m height) from established meteorological stations run by Gobabeb (open-source data from sasscalweathernet.org). Data were from the Gobabeb station except for 1000 h to 2300 h on 31 July 2022 when the Gobabeb station was not recording and the Aussinanis station was used. Aussinanis is 13 km north of Gobabeb (405 and 406 m elevation, respectively), at a similar distance inland from the coast, and we determined from data comparisons that the meteorological data were comparable between these stations.
Water holding capacity among litter types
We collected litter exhibiting two degradation conditions for each species, litter that had undergone senescence (hereafter “brown” litter) and fresh material that simulated greenfall (hereafter “green” litter). For the grass, both brown and green litter were collected by clipping standing or recently fallen grass stems. Stems were separated into brown and green conditions based on color. Stems were cut into 5–8 cm sections, discarding inflorescences and stems >3 mm diameter. We discarded brown stems with visible evidence of fungal colonization (black spots) or where the color had changed to grey, which is characteristic of stems that have been senesced more than a year (Jacobson et al., Reference Jacobson, van Diepeningen, Evans, Fritts, Gemmel, Marsho, Seely, Wenndt, Yang and Jacobson2015). We collected brown shrub litter from the litter layer beneath live shrubs and green shrub litter by clipping live leaves.
We measured litter water holding capacity (WHC) on litter species of both conditions. We first saturated litter by submerging it in water for 2 h. We weighed 1–10 g samples of the saturated litter to determine wet mass, dried at 60 °C until no further mass was lost, and weighed to obtain dry mass (target N = 2 litter species × 2 litter conditions × 20 replicates = 80 samples, actual N = 74 due to losses of 1–2 samples per treatment combination from labeling or sample handling errors). We calculated litter WHC as the percent by mass of water held by saturated litter relative to dry litter mass.
Surface litter responses to rainfall addition and litter type
The surface litter field study took place in a relatively flat area of the gravel plains ~50 m from the Gobabeb meteorological station (−23.5606°, 15.0411°). We bound bundles (2.0 ± 0.2 g) of oven-dried (60 °C) litter for each species × condition combination (hereafter “litter type”; brown or green and grass or shrub) using cotton sewing thread. The bundles were designed to mimic litter clumps that accumulate in drylands (Throop et al., Reference Throop, de Graaff and Belnap2025). We placed bundles into 15 plots (1 × 1 m), with each plot assigned to one of three rainfall treatments (0, 5, and 10 mm). Each plot contained 12 replicate bundles per litter type (Supplementary Figure 1). We deployed 720 bundles (3 rainfall treatments × 5 replicate plots per rainfall treatment × 4 litter types × 12 litter bundle replicates per litter type per plot).
We applied rainfall treatments immediately after setting out the experiment at 1100 h on 24 July 2022. The rainfall treatments were delivered by a watering can with a shower nozzle, applying 0, 5, and 10 mm simulated rainfall to the 1 m2 plots (0, 5, and 10 L volume, respectively). Prior work in the Namib suggested that these pulse sizes would be sufficient to stimulate soil microbial activity but would substantially dry down within 2 days (Throop et al., Reference Throop, Seely and Marufu2020). We collected one bundle per litter type in each plot every 4 h starting 4 h after the rainfall treatment. The four-hour collection time was selected to capture temporal dynamics of dry down while being logistically feasible over two days. Immediately after collecting, we sealed bundles in plastic bags and returned them to the lab. In most cases, we immediately weighed bundles to determine wet mass, although bundles collected between 0000 h and 0500 h were stored for a few hours at 4 °C prior to weighing. We dried litter bundles at 60 °C and obtained dry mass.
A temperature data logger (iButton DS1920, Maxim Integrated Products, Sunnyvale, CA) was positioned under one bundle per litter type for 8 of the 15 plots. This provided two or three replicate loggers for each litter type × rainfall treatment combination. Loggers recorded temperature every 2 min, and data were reduced to hourly means.
Buried litter responses to rainfall addition
The second field experiment characterized litter moisture content in buried and unburied brown grass litter bundles following a rainfall treatment. The field site for this experiment was located at the junction between the gravel plains and the Kuiseb River floodplain in an area where windblown sands accumulate (−23.5631°, 15.0431°). The study site is ~300 m from the Gobabeb meteorological station.
We placed bundles into 15 plots (1 × 1 m), with each plot assigned to one of three rainfall treatments (0, 5, and 10 mm) and containing 21 litter bundles (Supplementary Figure 3). Litter bundles were buried at one of three depths: 0 cm (on the surface), 1 cm burial, and 3 cm burial. Litter bundles were inserted into the soil with a trowel to the specified depth and covered with soil. We deployed a total of 315 bundles (7 litter bundle replicates per burial depth per plot × 3 litter depths × 3 rainfall treatments × 5 replicate plots per rainfall treatment).
We applied rainfall treatments at 1200 h on 30 July 2022. Starting at 1800 h we collected bundles every 6 h for 42 h, storing bundles in sealed plastic bags and determining wet and dry mass. We selected the 6 h collection window (longer than used in the surface experiment), as we expected buried litter to dry down more slowly than surface litter. A temperature data logger was positioned beneath one bundle for each depth treatment in 10 of the 15 plots (8 for the 0 cm treatment). This provided two or three replicate measurements per depth × rainfall treatment combination. We calculated hourly means from data logged every 2 min.
Data analysis
We used R for all data analysis (R Core Team 2020). Data were tested for assumptions of normality and, if warranted, transformed with the optimal parametric function using the package bestNormalize (Peterson, Reference Peterson2021). For all three studies, we used analysis of variance (ANOVA) to assess treatment impacts on litter moisture. For the litter WHC study, we assessed the main effects of litter species, litter condition, and their interactions. For the surface litter moisture experiment, we assessed the main effects of litter type, litter condition, moisture treatment, and their interactions. For the buried litter moisture experiment, we assessed the main effects of moisture treatment, burial treatment, and their interaction. For the surface and buried litter moisture experiments, we ran separate ANOVAs for litter collected at time periods corresponding to transitions between daylight and nighttime periods, which were every 12 h (starting at 8 and 6 h after the start of the experiment, for surface and buried experiments, respectively). We set α = 0.05 for statistical analyses and considered P-values between 0.05 and 0.10 to be marginally significant. Generative AI (ChatGPT and Claude) was used for assistance with code generation and error checking.
For the surface and buried litter moisture experiments, we estimated sufficient litter moisture for microbial activity as >15% litter moisture content relative to litter dry mass (Gliksman et al., Reference Gliksman, Rey, Seligmann, Dumbur, Sperling, Navon, Haenel, De Angelis, Arnone and Grünzweig2017; Evans et al., Reference Evans, Todd-Brown, Jacobson and Jacobson2020). We estimated time above this threshold by linear interpolation of mean values for litter moisture of each treatment combination over consecutive observations. We determined the percentage of time above the threshold for the first and second 24 h period of the two field experiments.
Results
Water holding capacity among litter types
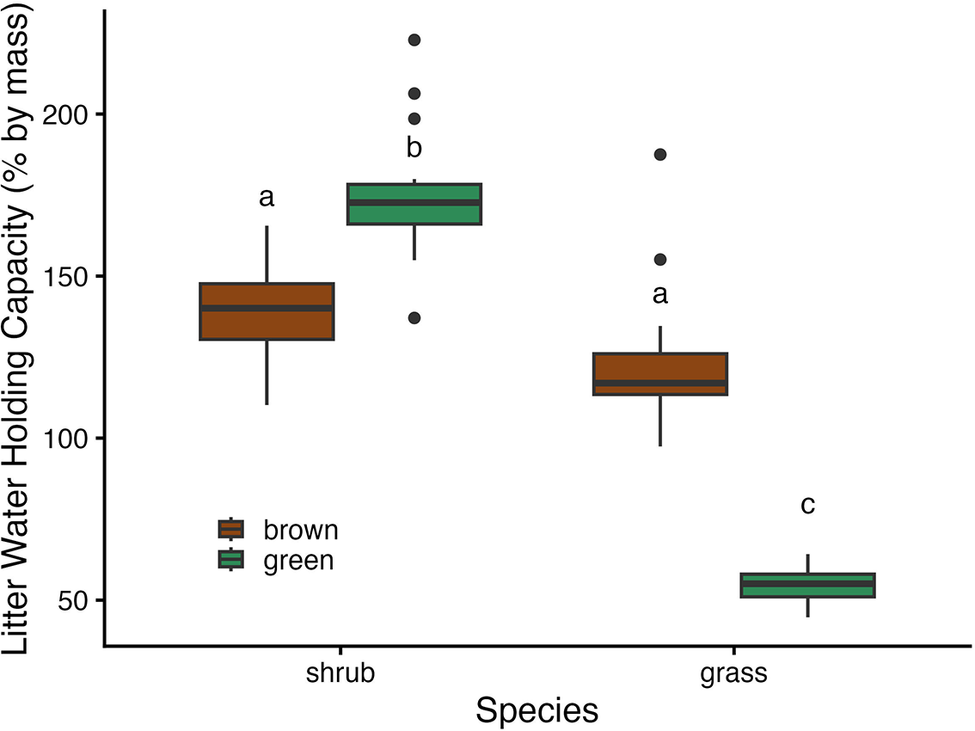
In the laboratory WHC study, shrub litter retained more water than grass litter after being submerged (Figure 1; P < 0.001, Supplementary Table S1 for full ANOVA results). However, there was a species × litter condition interaction, where WHC was higher for green than brown litter for the shrub but lower for green than brown litter for the grass (Figure 1; P < 0.001). There was no significant main effect of litter condition (P > 0.1).
Litter water holding capacity following litter submersion in water. Water holding capacity is expressed as percent relative to litter dry mass for brown (senesced) and green litter. Litter was obtained from a broadleaved shrub, Salvadora persica, and a hummock-forming perennial grass, Stipagrostis sabulicola. Boxplots indicate medians (central lines), inter-quartile range (box edges), 1.5 × inter-quartile range (whiskers), and outliers that are beyond 1.5 × inter-quartile range (points). Boxes with the same letter do not differ from each other. N = 20 samples per litter condition × litter species combination.

Figure 1. Long description
A boxplot graph with the x-axis labeled Species, containing two categories: shrub and grass. The y-axis is labeled Litter Water Holding Capacity (percent by mass), ranging from 50 to 200. A legend indicates brown boxes represent brown litter and green boxes represent green litter.
* For the shrub category:
- The brown litter box is centered around 140 percent, labeled with the letter a.
- The green litter box is higher, centered around 175 percent, labeled with the letter b, and shows four outlier points above the upper whisker.
* For the grass category:
- The brown litter box is centered around 120 percent, labeled with the letter a, and shows two outlier points above the upper whisker.
- The green litter box is significantly lower, centered around 55 percent, labeled with the letter c.
Statistical significance is indicated by letters; boxes sharing the letter a (shrub brown and grass brown) are not significantly different, while shrub green (b) and grass green (c) represent distinct statistical groups.
Surface litter responses to rainfall addition and litter type
The surface litter experiment took place during a 48-h period with warm days and cool nights. Relative humidity climbed substantially at night, culminating with a cumulative 2.9 mm potential fog precipitation event during the second night (Figure 2A). Both air temperature and soil temperature dipped roughly 15 °C at night relative to daytime hours (Figure 2B).
Weather conditions measured at the Gobabeb meteorological station during the surface litter moisture experiment. A.) Relative humidity (left y-axis, blue line) and precipitated fog moisture amount measured via a depositional fog collector (right y-axis, black bars). B.) Temperature data in the air (2 m height) and in the soil (10 cm depth). Grey shaded areas with moons indicate nighttime hours (1800–0600 h) and white boxes indicate daytime hours (0600–1800 h). Relative humidity and air temperature are LOESS-smoothed curves of hourly values.

Figure 2. Long description
Panel A shows Relative Humidity in percent on the left y-axis and Fog in millimeters on the right y-axis against Elapsed Time in hours on the x-axis. A blue LOESS-smoothed curve for relative humidity starts at 25 percent, peaks near 65 percent at 12 hours, dips to 25 percent at 25 hours, and then rises to nearly 100 percent by 35 hours. Black vertical bars representing precipitated fog deposition appear between 35 and 43 hours, peaking at 0.8 millimeters at hour 40.
Panel B shows Temperature in degrees Celsius on the y-axis. A solid blue line represents Air Temperature and a dashed brown line represents Soil Temperature. The x-axis is divided into shaded nighttime regions (moon icons) and white daytime regions (sun icon). Air temperature fluctuates between 8 and 28 degrees Celsius, while soil temperature follows a similar but slightly higher and lagged path between 15 and 32 degrees Celsius. Both temperatures peak during the daytime window (hour 20 to 32) and reach their lowest points during the second nighttime window (hour 32 to 44).
There were strong temporal patterns in litter moisture throughout the surface rainfall addition experiment, consistent across litter type and rainfall addition treatments. Litter moisture increased for all treatments during both nights, peaking at the 20 and 44 h collection times, before declining during daylight hours (Figure 3A–C). The large increase in litter moisture on the second night (from 3.1 ± 1.07% at 30 h to 88.0 ± 8.19% at 42 h across all litter types in the no rainfall addition treatment) was driven by the fog event. Litter moisture was inversely related to litter temperature (Figure 3D–F).
Temporal patterns of litter moisture and litter temperature during the surface water addition experiment. Litter moisture, calculated as a percent relative to litter dry mass, was tracked in plots that received A) 0 mm, B) 5 mm, or C) 10 mm water addition at the start of the experiment. Points are means (± SE) for each litter type by species combination (N = 5 replicates per time point per combination). The dotted blue line represents the 15% gravimetric moisture content threshold for microbial activity. D–F) Temperature from data loggers placed between the litter bundles and soil in each of the three water addition treatments. Temperature curves are LOESS-smoothed from hourly means of values logged at two-minute intervals, with ribbons indicating confidence intervals ( N = 2–3 loggers per water addition treatment). Elapsed time began at the time that plots received the water addition treatments. Nighttime hours (1800–0600 h) are denoted by grey bands and daytime hours (0600–1800 h) are noted by white bands. Hours during which fog was recorded are indicated in blue bands.

Figure 3. Long description
A legend at the top identifies four litter types: brown grass (orange line with circles), brown shrub (brown dashed line with triangles), green grass (light green line with circles), and green shrub (dark green dashed line with triangles).
Top Row: Litter Moisture (%) vs. Elapsed Time (hours).
* Panels A (No Addition), B (5 mm Addition), and C (10 mm Addition) show moisture levels remaining below 25% for the first 30 hours.
* A horizontal blue dotted line marks the 15% threshold.
* Between 30 and 50 hours, all treatments show a sharp spike in moisture, peaking around 45 hours.
* Green shrub consistently reaches the highest moisture levels (near 150%), while green grass remains the lowest.
Bottom Row: Litter Temp. (degrees Celsius) vs. Elapsed Time (hours).
* Panels D (No Addition), E (5 mm Addition), and F (10 mm Addition) show two distinct diurnal cycles.
* Temperatures peak near 40 degrees Celsius during the first day (0-10 hours) and slightly lower during the second day (20-30 hours), dropping to approximately 10 degrees Celsius at night.
* Increased water addition in panels E and F results in lower peak daytime temperatures compared to panel D.
Background Shading (All Panels):
* Grey vertical bands indicate nighttime (18:00 to 06:00 h), marked with a crescent moon icon.
* White vertical bands indicate daytime (06:00 to 18:00 h), marked with a sun icon.
* A blue vertical band between 32 and 44 hours indicates recorded fog.
Rainfall addition enhanced litter moisture at 8 h, had a marginally significant effect (P = 0.051) at 12 h, and there was no effect at later collection times (Figure 3A–C, Supplementary Table S2 for full ANOVA results). Species did not affect litter moisture at 8 h, but shrub litter had greater moisture than grass litter at later collection times (Figure 3A–C). Litter condition did not affect litter moisture in the first day, marginally (P = 0.08) affected moisture at 32 h, and strongly affected moisture at 44 h. A species × litter condition interaction also emerged at 44 h (green shrub > brown shrub > brown grass > green grass). Rainfall addition generally reduced litter temperature, with greatest differences during the first day of the experiment (Figure 3D–F).
The time that litter was above the 15% threshold assumed for microbial activity varied from 0 to ~60% of the 24-hour periods (Figure 4). Green and brown grass litter were not above the microbial activity threshold during day 1 in the 0 or 5 mm addition treatments but were above the threshold in the 10 mm treatment (34% and 12% of the time for brown and green grass, respectively). In contrast, brown and green shrub litter samples were above the threshold >50% of the time for the 5 and 10 mm treatments on day 1 and for a shorter time for the 0 mm treatment (13% and 24% of the time for brown and green shrub samples, respectively). The fog event during the second day had a greater impact than did the rainfall additions in all treatments, leading to all rainfall and litter type treatments being above the threshold >30% of the time. Shrub samples were above the threshold ~60% of the time on day 2 while grasses were moist for less time (~45% for brown grass and ~ 33% for green grass).
Percentage of time that litter was sufficiently moist for microbial activity during the two-day rainfall addition and litter type experiment, assuming a threshold of at least 15% gravimetric litter moisture content for microbial activity. Litter moisture content is based on a linear interpolation of moisture from all collection times, with day 1 encompassing hours 4–24 of the experiment (no measurements were made before 4 h) and day 2 encompassing hours 24–48.

Figure 4. Long description
A legend in the top left of Panel A identifies four litter types: brown grass (orange), brown shrub (brown), green grass (light green), and green shrub (dark green). The y-axis is labeled Time above moisture threshold (%) with increments of 20 from 0 to 60. The x-axis is labeled Time with categories for Day 1 and Day 2.
* Panel A. No Addition: On Day 1, only brown shrub (approximately 13 percent) and green shrub (approximately 24 percent) are above 0. On Day 2, all four types increase significantly: brown grass (45 percent), brown shrub (59 percent), green grass (33 percent), and green shrub (58 percent).
* Panel B. 5 mm Addition: On Day 1, brown shrub is at 52 percent and green shrub is at 55 percent; grass types are at 0. On Day 2, brown grass is at 46 percent, brown shrub at 61 percent, green grass at 33 percent, and green shrub at 59 percent.
* Panel C. 10 mm Addition: On Day 1, brown grass is at 34 percent, brown shrub at 60 percent, green grass at 12 percent, and green shrub at 62 percent. On Day 2, values are similar to Panel B: brown grass at 46 percent, brown shrub at 60 percent, green grass at 36 percent, and green shrub at 59 percent.
Buried litter responses to rainfall addition
The buried litter experiment took place during a cooler and moister 48 h period than the surface litter experiment (Supplementary Figure 1). There was an 0.8 mm fog event on the first night and no fog on the second night. Air and soil temperature both dropped ~15 °C on the first night and remained low the second day.
Both litter burial and rainfall treatments affected litter moisture, while atmospheric moisture had limited influence on litter moisture. Litter moisture was consistently greater for buried than surface litter (Figure 5A–C, Supplementary Table S3 for full ANOVA results). There was a burial effect on litter moisture for all the analyzed collection times (every 12 h, starting with the 6 h collection time), except for 18 h. Rainfall additions enhanced litter moisture (Figure 5A–C), especially during the first night. There was a depth × rainfall treatment interaction on litter moisture at the 6 and 30 h collection times. At both times, rainfall treatments enhanced litter moisture for buried litter more than for surface litter. Litter temperature was initially depressed in the rainfall treatments relative to the 0 mm treatment but was similar across depths and rainfall treatments after the first ~5 h (Figure 5D–F).
Temporal patterns of litter moisture and litter temperature during the buried litter moisture experiment. Litter moisture (mean ± SE), calculated as a percent relative to litter dry mass, was tracked in plots where litter bundles (brown grass) were deployed A) on the surface, B) buried to 1 cm, or C) or buried to 3 cm. Water addition treatments (0, 5, 10 mm) were applied to each burial treatment (N = 5 replicates per time point per combination). The dotted blue line represents the 15% gravimetric moisture content threshold for microbial activity. LOESS-smoothed litter temperature (D–F) from data loggers placed underneath litter bundles in each of the three burial treatments (N = 2–3 loggers per water addition treatment, hourly mean values were calculated from values logged at 2-min intervals). Elapsed time began at the time that plots received the water addition treatments. Nighttime hours (1800–0600 h) are denoted by grey bands and daytime hours (0600–1800 h) are noted by white bands. Hours during which fog was recorded are indicated in blue bands. There were no statistical analyses of litter temperature due to low number of data loggers.

Figure 5. Long description
The figure consists of two rows of three panels each. A shared legend at the top indicates three water addition treatments: 0 mm (solid orange line with circles), 5 mm (dashed green line with triangles), and 10 mm (dotted purple line with diamonds).
* Top Row: Litter Moisture (%) vs. Elapsed Time (hours). A horizontal blue dotted line marks the 15% moisture threshold.
- Panel A (Surface): Moisture levels for all treatments fluctuate but generally stay near or below the 15% threshold, peaking slightly during nighttime hours.
- Panel B (1 cm Depth): The 5 mm and 10 mm treatments show significantly higher moisture, maintaining levels between 30% and 60%, well above the 15% threshold. The 0 mm treatment remains near zero.
- Panel C (3 cm Depth): Similar to Panel B, the 5 mm and 10 mm treatments maintain high moisture (40% to 70%), while the 0 mm treatment remains low.
* Bottom Row: Litter Temperature (degrees Celsius) vs. Elapsed Time (hours).
- Panels D (Surface), E (1 cm Depth), and F (3 cm Depth): All panels show a strong diurnal cycle. Temperatures peak at approximately 30 degrees Celsius during daytime hours (white bands) and drop to near 5 degrees Celsius during nighttime hours (grey bands). As burial depth increases from Surface to 3 cm, the amplitude of the temperature swings slightly decreases, and the peaks become broader.
Vertical blue bands indicate periods of fog, and vertical grey bands indicate nighttime (1800 to 0600 h), while white bands indicate daytime (0600 to 1800 h). Error bars represent S E.
The percentage of time that litter was above the 15% threshold assumed for microbial activity was influenced by rainfall addition and burial depth (Supplementary Figure 2). Surface litter remained wet longer with increasing rainfall addition treatment during day 1, with the fog event contributing sufficient moisture to the 0 mm treatment to exceed the threshold 5% of the time. By day 2, only surface litter in the 10 mm treatment exceeded the threshold (68% of the time). In contrast, both buried litter treatments exceeded the threshold 100% of the time on both days 1 and 2 for the 5 and 10 mm treatments. Buried litter in the 0 mm treatment exceeded the moisture threshold only during day 1 at 1 cm depth (13% of the time).
Discussion
Sufficient litter moisture content – even for brief time periods – is critical for supporting microbial decomposition in chronically water-limited hyperarid systems (Evans et al., Reference Evans, Todd-Brown, Jacobson and Jacobson2020). In our experiments, litter moisture content responded rapidly to manipulative treatments and ambient atmospheric conditions. Our hypothesis that litter WHC would differ among litter species and conditions was partially supported, with the effects of litter condition differing among species. Our hypothesis that litter moisture would be positively related to rainfall additions and litter-specific WHC was also partially supported, with rainfall causing short-duration litter moisture increases for the surface experiment. However, this response was dwarfed by the influence of atmospheric moisture, underscoring the contributions of fog and atmospheric humidity. Finally, our hypothesis that soil burial would extend the time that litter was wet following rainfall was supported, with buried litter retaining more moisture for a longer time than surface litter. However, an important caveat is that the relative impact of fog and rainfall differed with burial depth. Collectively, these results illustrate how coarse temporal scale rainfall measurements may have limited predictive strength for litter decomposition and the importance of non-rainfall moisture inputs and litter location to litter moisture and subsequent decomposition.
Litter type and water holding capacity
The range in WHC by species and condition illustrates the impact of litter physical properties on moisture content and subsequent biological processes following short, infrequent rain events characteristic of hyperarid systems. The greater WHC of shrub than grass litter was surprising, given the smooth, waxy cuticle of shrub leaves, which we expected to be hydrophobic with low WHC (Feng et al., Reference Feng, Zhao, Zhang, Zhang, Fan, Han and Zhao2025). However, nano-scale topography can affect the hydrophilic or hydrophobic nature of leaves (Bhushan and Jung, Reference Bhushan and Jung2006), suggesting that features not apparent to the naked eye may play a role in mediating WHC. The WHC response to litter condition also contrasted with our expectations. Only the grass species followed the expected pattern with greater WHC for brown than green litter. Prior work on this species found that cuticular degradation from solar radiation enhances non-rainfall moisture uptake (Logan et al., Reference Logan, Barnes and Evans2022a). In addition, moisture activates fungal decomposers on standing dead grass litter of this species in the Namib (Jacobson et al., Reference Jacobson, van Diepeningen, Evans, Fritts, Gemmel, Marsho, Seely, Wenndt, Yang and Jacobson2015), and this fungal colonization may similarly serve to enhance surface area through altering leaf microtopography. In contrast, WHC was unexpectedly lower in brown than green litter for the shrub. This could again reflect leaf surface topography that holds water, with that topography degrading following leaf senescence and drop. Other changes in chemistry and leaf structure with degradation may also affect litter WHC (Ilek et al., Reference Ilek, Błońska, Miszewski, Kasztelan and Zborowska2024).
Litter WHC is highly variable among species (Talhelm and Smith, Reference Talhelm and Smith2018), although our values were on the low end of those reported in other studies (e.g., Talhelm and Smith, Reference Talhelm and Smith2018; Castagnolli et al., Reference Castagnolli, Boggiani, Lima, Lima and Tonello2023; Feng et al., Reference Feng, Zhao, Zhang, Zhang, Fan, Han and Zhao2025). A possible difference with our study is that even our brown litter was only slightly decomposed, with litter either from recently fallen shrub leaves or standing dead grass leaves. In addition, we followed the standard protocol of submerging litter for 2 h, but longer submergence – up to 24 h – may be needed to reach maximum WHC for some species (Feng et al., Reference Feng, Zhao, Zhang, Zhang, Fan, Han and Zhao2025). However, wetting events in the Namib Desert are typically small and of short duration, with precipitation event means at Gobabeb of 1.4 and 2.2 mm for fog (potential precipitation) and rain, respectively (Jacobson et al., Reference Jacobson, van Diepeningen, Evans, Fritts, Gemmel, Marsho, Seely, Wenndt, Yang and Jacobson2015).
Precipitation impacts on litter moisture
The contrast between litter moisture responses to rainfall treatments and atmospheric moisture underscores the complexity of litter moisture in this hyperarid system. The precipitation additions enhanced litter moisture above the 5–15% litter moisture threshold necessary for microbial decomposer activity in the Namib Desert (Evans et al., Reference Evans, Todd-Brown, Jacobson and Jacobson2020). Litter moisture was above the 15% threshold for ~57% of the time for shrub litter in the rainfall addition treatments. However, this was complicated as the 0 mm treatment also gained litter moisture from atmospheric humidity during the first night, even though RH peaked at 67% and no fog was recorded. Surface litter moisture from rainfall treatments was short-lived, with no difference in moisture treatments at 24 h. In contrast, simulated 10 mm rainfall in the Namib maintained soil moisture for at least 48 h (Throop et al., Reference Throop, de Graaff and Belnap2025). Surface litter moisture in this hyperarid system is extremely ephemeral due to rapid evaporative losses. Precipitation inputs frequently have a shorter temporal window of influence on microbial activity in litter than soils, leading to the observed disconnect between decomposition and precipitation when expressed at coarse temporal scales such as annual precipitation (Vanderbilt et al., Reference Vanderbilt, White, Hopkins and Craig2008; Austin, Reference Austin2011). However, microbial activity in the Namib responds very quickly to moisture addition, with fungal respiration on surface litter activated within five minutes of wetting (Jacobson et al., Reference Jacobson, van Diepeningen, Evans, Fritts, Gemmel, Marsho, Seely, Wenndt, Yang and Jacobson2015).
Fog is an important water source to surface biological processes in the Namib Desert, evident from the high impact of fog on litter moisture. The fog precipitation potential during the second night (2.9 mm) in our study was much less than either of the rainfall treatments (5 and 10 mm). However, litter moisture was much higher from fog than even the 10 mm treatment on day 1. A complicating factor is that, by convention, the fog collector measured potential fog precipitation at 1.5 m height, which may not reflect the total fog deposition at the soil surface (Li et al., Reference Li, Wang, Kaseke, Vogt, Li and Seely2018). In addition, the temporal dynamics of a fog event relative to an experimental rainfall event may also influence litter moisture content. We delivered rainfall with a watering can, taking several minutes per plot. The delivery rate may have limited water permeating or adhering to leaves, which may take up to 24 h to reach maximum water content (Feng et al., Reference Feng, Zhao, Zhang, Zhang, Fan, Han and Zhao2025). In contrast, the persistence of fog and atmospheric humidity may enhance litter moisture despite the complex cellular structure of litter that slows moisture uptake (Feng et al., Reference Feng, Zhao, Zhang, Zhang, Fan, Han and Zhao2025).
An important caveat is that our field experiments took place during a wet and cool winter period in the Namib. The limited impact of simulated rainfall on surface litter moisture even under these relatively wet conditions suggests that drying would usually be more rapid. However, rainfall events of 5 or 10 mm – large for the Namib Desert – would typically correspond to elevated atmospheric humidity. The longer duration of fog illustrates how fog may play an oversized role in surface biological processes in the Namib.
Burial impacts on litter moisture
Litter burial extending the time that litter was wet following rainfall addition supports findings of prior laboratory studies (Lee et al., Reference Lee, Fitzgerald, Hewins, McCulley, Archer, Rahn and Throop2014; Joly et al., Reference Joly, Kurupas and Throop2017). While both burial treatments extended the time that litter moisture was elevated, the slightly higher litter moisture for the 1 than 3 cm burial depth may reflect declining infiltration with increasing depth. In contrast, samples at the 3 cm burial depth still maintained high litter moisture content at the final collection time while litter moisture for 1 cm depth declined. This suggests that litter moisture was driven both by infiltration inputs and evaporative losses, with the balance of these processes differing with burial depth.
The buried litter experiment illustrates the context-dependent nature of precipitation effects on litter moisture. While both rainfall addition treatments enhanced surface litter moisture, buried litter had greater and more sustained responses. This was likely due to moisture transfer from soils into litter and slow evaporative losses. In contrast, the influence of fog on litter moisture declined with burial depth, consistent with observations that fog at Gobabeb typically does not infiltrate deeply (Ebner et al., Reference Ebner, Miranda and Roth-Nebelsick2011). Burial effects on litter moisture are important given substantial burial from aeolian processes (Throop et al., Reference Throop, de Graaff and Belnap2025) and fossorial animals (Robinson and Seely, Reference Robinson and Seely1980; Southgate et al., Reference Southgate, Masters and Seely1996). Meta-analysis suggests that burial enhances dryland decomposition (Throop et al., Reference Throop, de Graaff and Belnap2025). This may result from buried litter staying wetter longer than surface litter – as was found in this study – thus extending windows of opportunity for decomposers (Lee et al., Reference Lee, Fitzgerald, Hewins, McCulley, Archer, Rahn and Throop2014; Joly et al., Reference Joly, Kurupas and Throop2017). The Namib Desert climate may drive more complex impacts of litter burial on litter moisture and subsequent decomposition than many drylands. Models and measurements suggest that substantial litter wetting occurs through fog (Evans et al., Reference Evans, Todd-Brown, Jacobson and Jacobson2020), and that this moisture is a dynamic driver of biotic decomposition (Jacobson et al., Reference Jacobson, van Diepeningen, Evans, Fritts, Gemmel, Marsho, Seely, Wenndt, Yang and Jacobson2015; Logan et al., Reference Logan, Todd-Brown, Jacobson, Jacobson, Vogt and Evans2022b). However, a key caveat is that these studies have focused on standing dead litter in perennial grass hummocks, where the grass structure leads to substantial fog collection (Ebner et al., Reference Ebner, Miranda and Roth-Nebelsick2011). Data from the present study indicate that surface and shallowly buried litter can be wetted by fog, but the amount of precipitation required to moisten litter increases with depth. Thus, litter may decompose at a substantially slower rate than suggested by decomposition models if it is buried at a depth that prevents litter moistening by fog or small rainfall events, which account for a substantial amount of Namib precipitation.
Conclusions
Results from this study point to the highly dynamic nature of litter moisture in drylands and the role of litter traits and condition, atmospheric humidity, and burial in influencing litter moisture patterns. Our 10 mm simulated rainfall events – large for the hyperarid Namib – had a fleeting influence on surface litter moisture. In contrast to more predictable relationships between precipitation and soil microbial processes in more mesic ecosystems, our results indicate that rainfall may not adequately predict litter decay dynamics in the Namib. Instead, accurate predictions of decomposition will require consideration of both precipitation pulses and non-rainfall moisture. In addition, litter burial appears to be a key mediator of litter moisture and subsequent microbial decomposition.
Open peer review
For open peer review materials, please visit https://doi.org/10.1017/dry.2026.10049.
Supplementary material
The supplementary material for this article can be found at http://doi.org/10.1017/dry.2026.10049.
Data availability statement
The data that support the findings of this study are openly available in the Environmental Data Initiative (Throop et al., Reference Throop, Smania, Nunley, Haikali, Gallego, Nghalipo and Knox2026).
Acknowledgments
We thank the Gobabeb Namib Research Institute staff, especially G. Maggs-Kölling and E. Marais, for research discussions and support. We thank I. Aushona, R. Esch, G. Haingura, L. Kathena, J. Rusnak, and V. Stokely for help with sample preparation, J. Li for translating the abstract, and E. Marais and D. Moorhead for thoughtful comments on a prior version of the manuscript. H.L.T. is grateful to Prof. W. Whitford for sharing his enthusiasm for dryland research and student mentoring with her when she was early in her faculty career. Prof. Whitford’s dedication to meaningful international collaboration and training helped inspire the ASU-Gobabeb International Research Experiences for Students program that produced this project.
Author contribution
Conceptualization, Methodology, Investigation, Data Curation, Formal Analysis, Visualization, Writing – Reviewing and Editing: S.S.; Conceptualization, Methodology, Investigation, Resources, Writing – Original Draft Preparation, Writing – Reviewing and Editing, Visualization: C.N.; Conceptualization, Investigation, Data Curation, Formal Analysis, Visualization: O.H.; Conceptualization, Methodology, Investigation, Writing – Original Draft, Visualization: V.G.; Conceptualization, Methodology, Supervision, Writing – Reviewing and Editing: E.N.; Conceptualization, Methodology, Supervision, Writing – Reviewing and Editing: N.K.; Conceptualization, Data Curation, Formal Analysis, Funding Acquisition, Methodology, Supervision, Visualization, Writing – Reviewing and Editing: H.T.
Declaration of interests
None.
Funding statement
This research was funded by grants from the US National Science Foundation (H.L.T., grant number 1854156 and H.L.T, grant number 2307195) to Arizona State University.


 Open access


Comments
29 April 2026
Dear Prof. Eldridge,
Please find attached a manuscript entitled “Litter burial and fog modify the effects of rainfall on litter moisture in a hyperarid desert” that we submit for consideration in Cambridge Prisms: Drylands. This manuscript details three experiments that explored temporal dynamics of litter moisture in the hyperarid Namib Desert.
This is a submission to the special issue in memory of Prof. Walt Whitford. I am delighted to submit this manuscript for the special issues given the clear links to Walt’s passions for research on dryland decomposition and global collaboration in student training. The work described in this manuscript was designed and carried out by a group of Namibian and US students who participated in a two-month collaborative research program in the hyperarid Namib Desert.
The novel research described in this manuscript is ultimately inspired by Walt’s seminal 1981 Ecology paper that articulated the issue that simple climate-based models work well for most systems globally but fail in drylands. This model-measurement mismatch has continued to challenge drylands researchers for more than forty years. Decomposition scientists have explored a suite of factors that challenge dryland decomposition modeling, and the pulsed nature of dryland moisture appears to be an important factor. We have very little available data at present to predict temporal patterns of litter moisture, although litter moisture is likely to be much more temporally and spatially dynamic than frequently measured variables such as soil moisture. In this manuscript we present data from novel field experiments where we characterized temporal responses of litter moisture to rainfall manipulations and atmospheric humidity. The location of this work in a hyperarid ecosystem further increases the novelty to the study. As such, I believe that the science in this manuscript will be of interest to readers of Cambridge Prisms: Drylands. I also believe that the topic and nature of the student-driven international research is a fitting tribute to the legacy of Prof. Whitford.
This manuscript is not under consideration elsewhere.
Thank you for consideration of this manuscript for publication in Cambridge Prisms: Drylands.
Sincerely,
Heather Throop