



Researchers in a number of fields have been interested in concepts for some time now. Goldstone & Kersten (Reference Goldstone, Kersten and Weiner2003, p. 600) describe a concept as “a mentally possessed idea or notion.” In this respect, concepts are psychological in nature; they exist only in the mind. Historically speaking, concepts are distinguished from categories, which are the things, objects, characteristics, colors, emotions, and so on that are perceived as being related in particular ways in the real world, and that are thought to be the basis from which people form concepts. To use Goldstone and Kersten’s (Reference Goldstone, Kersten and Weiner2003, p. 600, original bold text) example: “The concept dog is whatever psychological state signifies thoughts of dogs. The category dog consists of all the entities in the real world that are appropriately categorized as dogs.”
It is not surprising that language plays a key role in the development of categories and, ultimately, conceptual formation and modification. When an English-speaking child learns that dolphins and whales are not categorized as fish (at least by modern standards), they must modify their conceptual understanding of fish to accommodate this new knowledge. The same is likely also true of many English-speaking adults upon learning that bamboo is considered, at least from a botanist’s perspective, a type of grass rather than a tree, despite resembling trees in a number of ways. The relationship between language and concept formation, therefore, is reciprocal rather than unidirectional. As Murphy (Reference Murphy2002, p. 402) puts it: “As conceptual structure develops, word meanings have to reflect that development. But as word learning progresses, this also creates changes in conceptual structure.”
It is also not surprising that second language (L2) researchers have become increasingly interested in the interface between language transfer and the development of concepts in a L2 (e.g., Jarvis, Reference Jarvis, Juan-Garau and Salazar-Noguera2015; Jarvis & Pavlenko, Reference Jarvis and Pavlenko2008). Early influential models of the bilingual memory, such as Kroll and Stewart’s (Reference Kroll and Stewart1994) revised hierarchical model, assumed a shared conceptual store, with the strong implication being that corresponding native language (L1) and L2 forms map to the same underlying concepts. That view has been challenged by a number of other models, including de Groot and Van Hell’s (de Groot, Reference de Groot1992; Van Hell & de Groot, Reference Van Hell and de Groot1998) distributed feature model, Jiang’s (Reference Jiang2000, Reference Jiang2004) lemma mediation model, Dong, Gui, and MacWhinney’s (Reference Dong, Gui and MacWhinney2005) shared asymmetric model, and Pavlenko’s modified hierarchical model (Reference Pavlenko and Pavlenko2009). All of these subsequent models assume that there is often overlap between the concepts linked to corresponding L1 and L2 words, but at the same time there will often be some key differences as well.
In some cases, languages will divide and demarcate a particular concept in different ways categorically. Pavlenko and Malt (Reference Pavlenko and Malt2011, p. 39), for example, noted that Russian and English display systematic differences in how they categorize drinking containers, with Russian making stronger distinctions in respect to the material the containers are made of than English (which makes stronger distinctions according to shape). In other cases, a category represented by a word in one language is subsumed in a larger category in another language (e.g., Malt, Sloman, & Gennari, Reference Malt, Sloman and Gennari2003; Stepanova & Coley, Reference Stepanova, Coley and Pavlenko2006). Examples would include the English jar and the Spanish frasco (Malt et al., Reference Malt, Sloman and Gennari2003). The authors note that the English jar can accurately be classified as a Spanish frasco, but frasco also includes objects that are designated as bottles or containers in English (see also Ameel, Storms, Malt, & Sloman, Reference Ameel, Storms, Malt and Sloman2005). Finally, there are cases in which a concept in one language simply does not have a lexically realized counterpart in another language. Pavlenko (Reference Pavlenko2003), for example, notes that there is no Russian equivalent for the English notions of privacy or personal space.
In an effort to provide a more unified framework for such interlanguage differences, Pavlenko (Reference Pavlenko and Pavlenko2009) applied the terms conceptual equivalence, partial (non)equivalence, and conceptual nonequivalence. Conceptual equivalence is when the translations are mapped to the same concept. Partial (non)equivalence indicates situations in which the translations are mapped to concepts that overlap to some extent, but also vary to some extent. Conceptual nonequivalence is when one language has a concept, and an associated word, that is simply absent in the other language. It is not surprising that these variations in conceptual realization across languages are thought to have implications for conceptual development in L2 learners, largely in the form of conceptual transfer. Conceptual transfer occurs when a speaker maps a conceptual understanding developed in one language onto a corresponding word (or grammatical structure) in another language (e.g., Jarvis, Reference Jarvis2016; Jarvis & Pavlenko, Reference Jarvis and Pavlenko2008). When there is conceptual equivalence (or near-equivalence) between the two languages, this strategy is likely to be unproblematic. When there is only partial equivalence, however, it can lead to a situation in which the L2 learner is using the same word form as an L1 speaker, but with a different conceptual understanding.
As Jarvis (Reference Jarvis2016, p. 609) points out, however, it can often be difficult in empirical studies to pinpoint the source of L1 transfer. In brief, what may appear to have come about as a result of conceptual transfer may be attributable to other forms of transfer. Jarvis outlines three possible sources: structural representations, semantic representations, and conceptual representations (see Jarvis & Pavlenko, Reference Jarvis and Pavlenko2008).
Structural representations are related to a language’s “well formedness constraints” (Jarvis, Reference Jarvis2016, p. 609). In other words, one possible source of transfer may simply be structural acceptability (e.g., standard collocations) in one’s L1. Jarvis provides the example of on the fifth floor from English, which precludes the expression *in the fifth floor even though the latter expression seems more plausible when one considers the prototypical semantic properties of on and in in English and the spatial configuration of a floor as used in this example. Structural transfer, then, would occur when an L1 English speaker transfers on the fifth floor into his or her L2 due to the structural constraints in English, rather than a fundamentally different conceptualization of the spatial layout of a typical floor or of the concepts mapped to the L2 equivalents of in and on. If the proper L2 expression corresponds instead with the English expression in the fifth floor, then the learner will have produced an expression that is either erroneous or substantially different in meaning. However, this does not mean she or he has a drastically different conceptualization; the learner has simply been misled by the structural patterns of her or his L1.
The second type of transfer is semantic transfer. Semantic transfer refers (in Jarvis’s framework) specifically to form–meaning mappings, but like structural transfer it may not always be indicative of differences in conceptualization. It can often be hard to fully disentangle semantic and conceptual transfer, and it is similarly difficult to imagine situations in which transfer is purely semantic without the need to modify, if even slightly, the associated conceptual knowledge. Nonetheless, the key defining criterion of semantic transfer is that it involves mappings between word forms and concepts, but again with no underlying differences in conceptual representation. Jarvis and Pavlenko (Reference Jarvis and Pavlenko2008) provide the example of the English word chair and its association with positions of leadership in English (e.g., chair a committee, department chair, etc.). There is little doubt that most L2 English learners beyond the most basic level know the English word form chair and its associated concept of CHAIR as a piece of furniture. However, it is less likely that lower level learners have developed a semantic link between chair as a word form and the concept of LEADER(SHIP). This does not mean, however, that they have a separate conceptualization for LEADER(SHIP) in their L1. It is simply a matter of form–concept linkage, and an L2 English learner’s failure to recognize and understand an English speaker’s use of chair in referring to a person rather than an object is not due to a fundamental difference in underlying concepts.
Conceptual transfer, then, is of particular interest because it can reveal not only differences in language use but also cognitive and conceptual differences between speakers of different languages. Conceptual transfer occurs when a learner maps an L2 word form to a concept that had been formed through the L1. Although there are several studies that purport to have found evidence of conceptual transfer, Pavlenko (Reference Pavlenko and Pavlenko2009) takes issue with a number of these studies mostly on methodological grounds. Beginning with psycholinguistic studies that have used reaction times (RTs) to investigate the strength of connections between L1 and L2 words, Pavlenko identifies, among other things, a fundamental problem with the assumption that faster RTs in interlingual studies indicate greater shared conceptual meaning. Instead, she suggests that there could be a number of other causes for this phenomenon. She points out similar methodological concerns with proposed alternatives, such as a word-rating task (Dong et al., Reference Dong, Gui and MacWhinney2005) and similarity judgment tasks (Moore, Romney, Hsia, & Rusch, Reference Moore, Romney, Hsia and Rusch1999). In addition, although she does see value in picture-naming tasks (see, e.g., Dufour & Kroll, Reference Dufour and Kroll1995; McElree, Jia, Litvak, Reference McElree, Jia and Litvak2000) potentially tapping into differences in conceptual representation, she notes that most researchers in this area have tended to eliminate stimuli that did not have clear translation equivalents (Pavlenko, p. 129). Thus, she argues these picture-naming studies provide a highly nuanced view of conceptual transfer.
In order to address these difficulties, and to design studies that clearly allow for the investigation of conceptual transfer, rather than structural or semantic transfer, Jarvis (Reference Jarvis2016) has called for research focusing on “language-specific” conceptualizations which use verbal data to “show that learners from different language backgrounds do not simply express different conceptual meanings but also form and process different conceptual meanings when performing the same task” (Reference Jarvis2016, p. 618). Jarvis continues to outline research methods that would be conducive to this aim, as well as presenting two studies that he views as having successfully tapped into the phenomenon of conceptual transfer. The methods include naming and denotation tasks, as well as perception tasks, attention tasks, and memory tasks, provided these latter three incorporate verbal responses. As for specific studies that meet these criteria, Jarvis cites Pavlenko and Malt (Reference Pavlenko and Malt2011), who used a categorization task comparing different types of drinking vessels of English and Russian speakers, and Jarvis (Reference Jarvis1998), who compared descriptions of short films produced by Finnish- and Swedish-speaking learners of English as an L2. Both studies found compelling evidence for conceptual transfer.
In respect to transfer in the cognitive spatial domain, which was the focus of the current study, several studies have been conducted to date. Although the methodological limitations pointed out by Jarvis sometimes make it difficult to verify the source of transfer as purely conceptual, the findings to date have consistently indicated that transfer occurs in this domain. Ijaz (Reference Ijaz1986), for example, found that L1 and L2 speakers demonstrated a similar understanding of core senses of spatial prepositions (e.g., the book is on the table) but differed in their understandings of more peripheral senses (e.g., he hit his head on the lamp; see also Krzeszowski, Reference Krzeszowski1990). Similarly, Jarvis and Odlin (Reference Jarvis and Odlin2000) found that L1 speakers of Finnish and Swedish, despite receiving English education in the same environment, differed in their preferences for the use of on and in (in the expression on/in the grass) in a way that aligned with their L1 patterns. In a study focused on the effect of maturational constraints on the acquisition of the L2 English prepositions in, on, over, and under, Munnich and Landau (Reference Munnich and Landau2010) found an inverse correlation with correct usage and initial age of immersion. In a study that deviated from prepositions of space, Park and Ziegler (Reference Park and Ziegler2013) investigated conceptual understanding of the English phrasal verbs put on and put in in high proficiency Korean–English bilinguals. They found that two factors in particular were instrumental: English proficiency and amount of Korean use in daily life. Increased English proficiency was positively associated with the tendency to used English-like categorizations, while amount of Korean use was negatively associated.
Effects of proficiency on conceptual knowledge
Park and Ziegler’s (Reference Park and Ziegler2013) findings highlight the role of proficiency in developing a conceptual understanding of L2 words that is more in line with native speakers of the L2. Although no other studies, to the best of our knowledge, have looked at the interface between L2 proficiency and conceptual understandings in the spatial domain, a number of other studies have reported a connection between nativelike conceptual understanding and improved L2 proficiency in other domains. In two separate studies, Athanasopoulos, using both a picture-naming task (2006) and an object recognition task (Reference Athanasopoulos2007), found that conceptualizations for grammatical categories in advanced speakers of L2 English (L1 Japanese) were more in line with English native speakers than they were for intermediate learners, who were more in line with Japanese native speakers (see also Athanasopoulos & Kasai, Reference Athanasopoulos and Kasai2008). A similar link between proficiency and performance was reported for motion events in both studies focused on language-based conceptualizations (Park, Reference Park2019), and studies concerned with linguistic relativity (Von Stutterheim & Athanasopoulos, 2013).
Nonetheless, not all studies have reported changes in conceptualization with improved proficiency. Jiang (Reference Jiang2002, Reference Jiang2004), for example, investigated the RTs of high proficiency learners to two English words presented at the same time on a computer screen. Participants were asked to decide whether or not the two words were related in meaning (e.g., chance and opportunity). The key manipulation was whether or not the two English words could be translated into one or two words in the participants’ L1 (either Chinese or Korean). Jiang found that both groups responded significantly faster to words with one L1 translation over words with two L1 translations, a result that was not replicated among L1 English speakers. He viewed these results as indicative of conceptual transfer because the same-translation pairs shared similar conceptual meaning in the L1, while the different-translation pairs did not.Footnote 1 Jiang summarizes his findings by suggesting that they constituted evidence for the continued presence of transferred knowledge with little or no development toward nativelike conceptualizations even among advanced learners (Reference Jiang2004, p. 425).
Other studies have reported similar results. Gullberg (Reference Gullberg2009), for example, found that even when L2 speakers used L2 word forms appropriately, their use of corresponding gestures indicated that they retained conceptual understandings more in line with their L1. In one study, Gullberg (Reference Gullberg2009) tracked the use of gestures by L1 English speakers of L2 Dutch, and observed that when using the Dutch words leggen, which suggests placing something in a horizontal fashion (roughly similar to English lay), and zetten, which denotes something placed in a vertical fashion (similar to the English set or stand), their use of gestures did not reflect this difference. This, Gullberg argued, was attributable to the fact that both Dutch words can be represented by the high frequency English word put. Furthermore, this tendency did not appear to attenuate with advances in proficiency; even proficient learners who had lived in a Dutch-speaking environment for decades displayed an English-like pattern of gesturing.
The current study
Overall, then, it appears that language (a) influences one’s conceptualization of the world at a nonverbal level (i.e., as it relates to linguistic relativity), and (b) affects their linguistic choices at a verbal level (i.e., Jarvis’s, Reference Jarvis2016, language-specific conceptualizations). In addition, it appears that conceptualizations formed in the L1, including conceptualizations related to the spatial domain, are regularly transferred to L2 forms. Nonetheless, the results of past research are not consistent regarding the role of proficiency and the development of a more nativelike conceptual understanding for L2 words. In addition, to the best of our knowledge, Park and Ziegler’s (Reference Park and Ziegler2013) study is unique in two respects. First of all, Park and Ziegler (Reference Park and Ziegler2013) investigated spatial transfer in word classes other than prepositions. Second, they directly studied the interface between L2 proficiency and conceptualization in the spatial domain. Thus, one aim of the current study was to expand this line of research by investigating transfer (and proficiency) in respect to adjectives of space.
There were other rationales for this study as well. To begin with, the study attempts to answer Jarvis’s (Reference Jarvis2016) call for methodologies that offer “solutions for collecting or analyzing data that are relevant for determining whether transfer has originated from the level of conceptual meaning” (p. 627) by incorporating three forms of data: participant judgments, RTs, and eye movements. Second, the study attempts to go beyond data based on productive language use to investigate how conceptual transfer might also affect language use on a receptive level, which is an element of conceptual transfer that has thus far been neglected in the research literature (Gullberg, Reference Gullberg2014, Jarvis, Reference Jarvis2016). In respect to this second aim, the current study is, as far as we know, the only L2-based study to date that has assessed receptive language implicitly without asking participants to make overtly explicit judgments about things such as relatedness (though see, e.g., Papafragou, Hulbert, & Trueswell, Reference Papafragou, Hulbert and Trueswell2008, who used eye tracking to study linguistic relativity in L1 Greek and L1 English speakers). The advantage of this implicit approach is it allowed us to avoid potential methodological weaknesses by asking people to use metalinguistic judgments, which are explicit in nature, about conceptual knowledge, which is implicit (see Pavlenko, Reference Pavlenko and Pavlenko2009).
The current study used a research design that incorporated an entirely visual (i.e., nonlinguistic) task that included verbal instructions to address the following research questions. The only difference was in respect to the language (i.e., English or Japanese, see below) used for the task instructions. The questions were as follows:
1. Do L1 speakers of English and L1 speakers of Japanese perform the same visual task differently when instructions are provided in their L1s?
2. Do L1 Japanese speakers of L2 English perform the same task with English instructions more like L1 speakers of English or L1 speakers of Japanese?
3. Is performance conditioned by proficiency, with more proficient L2 English speakers performing more in line with L1 English speakers and less proficient L2 English speakers performing more in line with L1 Japanese speakers?
Based on the findings of past research, we expected divergent performances between L1 English and L1 Japanese speakers when performing the tasks in their respective L1s. In respect to Research Questions 2 and 3, we also expected (given the amount of evidence suggesting a positive association between proficiency and more native speaker-like conceptualizations in the spatial domain) that advanced learners would behave more like L1 English speakers while less proficient learners would behave more like L1 Japanese speakers.
The key words focused on in this study were the English word narrow and its Japanese translation of semai. The accuracy of this translation was confirmed by all three authors of this paper, all of whom have extensive experience in speaking both English and Japanese. Nonetheless, narrow and semai are not conceptual equivalents. In Pavlenko’s (Reference Pavlenko and Pavlenko2009) terms, narrow and semai would be considered partial (non)equivalents. Narrow in English refers almost exclusively to the width of something in relation to its height or length. Semai incorporates this meaning of narrow, but is conceptually broader; it can also be used to describe spaces that are small in general (without specific reference to the width and height contrasts), or could even mean something like cramped or confined in English. A room that is quite large could be described as semai if a good deal of the space contained shelves, boxes, and so forth, thus leaving little space for people to move around.
We can gain a better understanding of the meaning of semai by looking at its collocational contexts. To illustrate, we consulted a corpus of written Japanese language (NINJAL-LWP for BCCWJ, http://nlb.ninjal.ac.jp/), a 100 million-word corpus consisting of a wide range of written Japanese texts. The most frequent 10 nouns that collocated with the literal sense of semai were, in the order of frequency, heya (room), michi (street/road), tokoro (place), basho (place), roji (alley/lane), place names (such as semai Japan, semai Tokyo), tsuuro (passage/path), kuukan (space), chiiki (region), and niwa (garden). Out of these collocations, semai has the same sense as narrow in three expressions (street, alley, and passage) and as small (or crowded) in the rest. Although semai subsumes meanings of narrow and small, it is still a primary translation equivalent of narrow when there is no context. This partial overlap between semai and narrow causes an error among L1-Japanese learners of English, such that they produce collocations like “my room is very narrow” with the intention of meaning “my room is very small” (Wolter, Reference Wolter2006). This type of error is frequently observed and recognized as a common mistake made by Japanese learners of English (Webb, Reference Webb2007). It should also be noted, however that Japanese does have a different word, chiisai/chiisana, which is the standard translation of small in English. Therefore, it would be erroneous to suggest that semai entirely subsumes the two concepts represented by narrow and small in English; chiisai/chiisana has its own semantic value that is in some ways distinct from semai.
Method
Participants
Participants included a group of native speakers of English and two groups of native speakers of Japanese. All participants engaged in the same task (see below), but the language of the instructions for the task varied. English was used for the native speakers of English (EE) and one of the Japanese groups (JE) while Japanese was for the other Japanese group (JJ). L1 baseline performance (English and Japanese) from the EE and JJ groups was used to establish baseline data. The EE group consisted of 32 participants at a university in the United States. Fourteen of the participants indicated they spoke no foreign languages, 10 indicated they had a basic understanding of at least one foreign language, and 8 indicated they had intermediate to advanced knowledge of at least one foreign language. Although we cannot rule out the possibility that knowledge of a foreign language had an effect on task performance, none of the participants reported having any knowledge of Japanese.
Participants in the Japanese groups were students at a university in Japan. The JJ group comprised 33 undergraduate students. Ideally, they should have had little knowledge of English. However, with the widespread use of English as an international language and in the context where English is a major foreign language subject that students learn at school, it was unfeasible to find people who had had no exposure to English. Therefore, we recruited non-English majors who had relatively low levels of English proficiency.
For the JE group, we aimed to include a wide range of English proficiencies (from the intermediate to advanced levels) as we planned to use English proficiency as a predictor variable in our analyses. The JE group comprised 10 undergraduate (no English majors) and 20 graduate students (studying English or linguistics related disciplines). JE participants reported on their English learning backgrounds and self-evaluated their English proficiency in four skill areas. They also took the V_YesNo vocabulary test (Meara & Miralpeix, Reference Meara and Miralpeix2017) as a proximal measure of English proficiency. The V_YesNo test provides an estimation of receptive vocabulary size with a maximum score of 10,000 words. Meara and Miralpeix (Reference Meara and Miralpeix2017, p.118) suggest that a score of 2500–3500 indicates an intermediate level, 4500–7500 indicates a learner "with a good level of competence", and 7500–9000 indicates a highly proficient learner. The JE group’s scores ranged from 2700 to 9000 (mean= 5711, SD= 1350), which indicated a wide range of proficiency from low intermediate to highly advanced.
All participants answered a questionnaire about their backgrounds (e.g., age, dexterity, and vision). None of the participants in any group reported problems in their natural or corrected vision, nor did they display any problems in handling the response pad (see below). Table 1 summarizes the participants’ demographic information.
Demographic information for participants

Notes: LOS, length of studying English through formal education. LOR, length of residence in English-speaking countries (periods shorter than one are counted as none). EE, native speakers of English. JE, Japanese speakers of English. JJ, Japanese-only speakers. Self-report proficiency scores range from 1 (the minimum) to 10 (nativelike). Standard deviations are in parentheses. Sex for EE group excludes 2 participants who did not provide this information.
Items
To compare how these words were processed, this study adopted an image viewing and selection task. Each item consisted of two room images displayed on a computer screen side by side (see Figure 1 for an illustration), and the task was to choose the narrower/more semai room of the two by pressing a designated button on a response pad.Footnote 2 We created nine images that differed slightly but noticeably in width (441, 456, and 471 pixels) and height (636, 651, and 666 pixels).Footnote 3 Combining all possible pairings of the nine produced a total of 36 possible combinations. However, we transposed the left-right positioning of these combinations once for every item, resulting in a total of 72 critical items. In all items, the two rooms were different in size either horizontally, vertically, or both. The size difference was created by combining three levels of differences in width and height, respectively (same = 0-pixel difference, medium = 15-pixel difference, and large = 30 pixel difference). For instance, an item that contained a 636 × 441 (height × width) pixel image and a 666 × 471-pixel image would be classified as having a large size difference both in width and height. An item presenting a 651 × 441-pixel image a 651 × 471-pixel image would represent a case where the width difference is large, but the height difference is the same. All room images were presented in grayscale.
A sample item (50% scale, same height difference, small width difference).

To avoid potential confounds, the rooms were sparsely furnished, with no furniture near the walls and no doors or windows (all of which might bias eye movements and decisions). In addition, the furnishings, consisting of a floor rug and four identical armchairs, were kept the same size in every image with the chairs situated exactly 8 pixels from the edge of the rug. The entirety of the furniture group was centered both horizontally and vertically within the rooms. The thickness of the walls was also kept the same. Thus, the only difference was the dimensions of the walls in the rooms.
As our purpose was to examine, among other things, the pattern of eye movements when the participants were deciding on the narrower/more semai room, we wanted to avoid situations where they could perform the task by simply using peripheral vision without moving their eyes. In an effort to mitigate against such strategies, we dislocated the center of the two images on the screen. More specifically, we placed the center of one image 10 pixels up and that of the other one 10 pixels down from the horizontal center of the screen, so that the participants could not immediately compare the heights. The items were divided into two lists to counterbalance this locational manipulation. Namely, when an item had the left image up and the right one down in List 1, the same item reversed this alignment in List 2.
Procedure
The data for the EE group and the two Japanese groups (JE and JJ) were collected at university laboratories in the United States and Japan, respectively. In both laboratories, the right eyes of the participants were tracked (viewing was binocular) with an EyeLink desktop mount eye tracker developed by SR Research (EE: EyeLink 1000 plus, JE/JJ: EyeLink 1000) at a sampling rate of 1000 Hz. The participants were seated in front of a 24-inch LCD monitor (resolution = 1920 × 1080, refresh rate = 120 Hz; EE: BenQ XL2420Z, JE/JJ: BenQ XL2420T) with their heads on a chinrest at a viewing distance of approximately 94 cm. A 9-point grid calibration was used.
Experiment Builder software (SR Research) was used to create the experimental program. The eye-tracking experiment began with the instructions of the task, which were displayed on the monitor. For the EE and JE groups, the instructions were shown in English and the participants were instructed to choose which room was “narrower.” For the JJ group, the instructions were in Japanese, and the participants were told to choose which room was more semai (狭い). The instructions were only shown once at the beginning of the task. The participants either pressed the left or the right button on a response pad to indicate whether they felt the room image on the left/right was narrower (or more semai). No other options were available; participants were expected to select left or right even if they could not detect a difference.
Following the instructions, a practice session with 12 trials was introduced before the main session. For each trial, a fixation target (“+”) was first displayed at the center of the screen, on which the participants were instructed to fixate. This served two purposes: (a) to make sure all participants were starting from the same focal point, and (b) to detect cases where recalibration for the eye tracker might be necessary. When a fixation of more than 500 consecutive milliseconds on the target was detected, the fixation target remained onscreen for an additional 500 ms. After that, a two-room item was displayed. The room images remained onscreen until either the participants made a response with the response pad, or the item timed out at 15,000 ms. RTs (in milliseconds) and eye-tracking measures (explained in the next section) were recorded. It took around 10–15 min for the participants to finish the experiment. The critical (i.e., nonpractice) items were presented in an individually randomized order. Areas of interest were predetermined in a manner that divided each room into quadrants (see Figure 2).Footnote 4 Immediately before or after the experiment, all participants answered the background questionnaire. In addition, the JE group also completed V_YesNo vocabulary test.
A sample item showing areas of interest.

As noted above, there were a number of expectations underpinning the design of this study. In respect to the EE and JJ groups, we expected: (a) the EE group to select the narrower room image significantly more frequently than the JJ group, with the selection being conditioned in part by width differences; (b) the EE group to demonstrate comparatively longer RTs (suggesting higher processing loads) for items with smaller width differences (i.e., same, medium, or large width); (c) the JJ group to demonstrate comparatively longer RTs to items that had similar area differencesFootnote 5 (as opposed to similar width differences); (d) the EE group to demonstrate significantly more fixations and longer dwell times in horizontal quadrants (see Figure 2) than the JJ group.
The first expectation was based on the conceptual distinction between narrow and semai and the belief that the two L1 groups would be judging the rooms in fundamentally different ways, which would naturally be reflected in their choices. The second expectation was based on the assumption that rooms that were closer in width would be more cognitively demanding for the EE group than the JJ group, and this would be reflected in longer response times. The third expectation was based on a similar assumption with the key difference being that the JJ group would find the rooms that were closer in area difference more demanding. Finally, the fourth expectation was based on two assumptions. The first was the well-established belief in visual perception research that when people are presented with a goal-directed task requiring visual input, they will exert intentional control over where they look (e.g., Posner, Reference Posner1980). The second assumption was based on the expectation that EE speakers could better complete their goal by focusing on the quadrants that defined horizontal space between the center of the room and the vertical walls. As for the JE group, we expected the participants’ behaviors to be between that of the EE group and the JJ group, with increases in proficiency being associated with more English native-language performance.
Results
Data analysis
Before analyzing the data, we first eliminated responses that timed out at 15 s (which consisted of only 6 of the 6840 responses collected). Right-left choices were analyzed using logistic regression. The choices made by participants were analyzed in terms of whether or not a participant selected the narrower room as defined by the English usage.Footnote 6 For this analysis, items with the same width were excluded as they had no correct response, particularly for those applying the English meaning of narrow to the task. RTs and eye-tracking measures were analyzed through linear mixed-effects modeling using the lme4 package (Bates, Mächler, Bolker, & Walker, Reference Bates, Mächler, Bolker and Walker2015) and the lmerTest package (Kuznetsova, Brockhoff, & Christensen, Reference Kuznetsova, Brockhoff and Christensen2015) in the R statistical software platform (R Development Core Team, 2016). For this analysis, item and participant were entered as crossed random effects while all other variables were entered as fixed effects.
The model fitting procedure started with a maximal model that included the following potential predictor variables as main effects: group (EE, JE, JJ), area differences between the two room images (log adjusted using natural logs), width differences (same, medium, and large), height differences (same, medium, and large), and trial (the order in which the participant encountered an item). In addition, the maximal models included quadratic terms for the two numerical predictor variables (area difference and trial) and all possible second-order interactions for the variables that were of theoretical interest (specifically all possible interactions between group and all other predictor variables for the analyses comparing all three groups). All categorical variables were dummy coded and all numerical predictor variables were standardized (using natural logs) and centered prior to analyses.
Because in addition to analyzing the choices made by the participants, one of our goals was to try to detect possible perceptual differences between the groups, we analyzed the data using a number of different outcome variables. These included: (a) room choice (i.e., choosing or not choosing the narrower room), (b) response times, (c) fixation percentages in the horizontal quadrants (i.e., quadrants 1, 3, 5, and 7 in Figure 2), and (d) dwell time percentages in the horizontal quadrants. Percentage values were chosen over raw values due to the fact that for all items the EE group tended to take longer on average to respond ( ${\rm{\bar x}}$ = 3766 ms, SD = 2566 ms) than either the JE group (${\rm{\bar x}}$ = 2472 ms, SD = 1950 ms) or the JJ group (${\rm{\bar x}}$ = 2475 ms, SD = 1914 ms).Footnote 7 All numeric outcome variables were also log adjusted using natural logs prior to analysis. Multicollinearity among the predictor variables was assessed using variance information factor values calculated in the usdm package in R (Naimi, Reference Naimi2015). This indicated no issues with multicollinearity, so all predictor variables were retained. In addition to these models, a final series of models was constructed for the JE group exclusively which included the V_YesNo scores (log adjusted, centered, and standardized) as an additional predictor variable (in place of group).
Once the maximal models had been constructed, backward stepwise regression analyses were performed in order to identify the most plausible models. The procedure used Akaike information criterion values in order to identify the best model (i.e., the most parsimonious model). No distinctions were made between main effects, second-order interactions, or quadratic terms in this procedure. The procedure simply involved eliminating, one by one, the predictor variable that had the least impact on the Akaike information criterion values until only variables that significantly improved the fit were included. At this point, it was our intention to compare models with random slopes as well, but adding random slopes led to convergence errors, so this step was abandoned.
Main findings
Descriptive statistics are presented in Table 2. The results of the logistic regression analysis are shown in Table 3 while the results of the RT analyses are shown in Table 4. In both cases, the EE group served as the reference group, and medium differences served as the reference categories for width and height. As can be seen in Table 3, the EE group was significantly more likely to select the narrower room image than either the JJ or the JE groups. Releveling the data to designate the JJ group as the reference group indicated the JE group was also significantly more likely to choose the narrower room image than was the JJ group z = 4.454 p < .001. In addition, there were also a significant Group × Width difference (i.e., medium or large) interaction and a significant Group × Area difference interaction indicating that the different groups varied in how they responded to the items in respect to their narrowness versus their overall area. To illustrate these differences, both interaction terms were plotted (Figures 3 and 4). Post hoc tests (run using the emmeans package in R (Lenth, Reference Lenth2019) with Tukey adjustments for multiple comparisons) on the Group × Width Difference interactions indicated that the EE group showed a higher probability of choosing the narrower room if there was a large width difference over a medium difference z = –7.00, p < .001. For the JE group, there was no significant difference z = –0.958, p = .338, while for the JJ group there was a significant difference z = 2.76, p = .006, but in the opposite direction as the EE group (i.e., the JJ group was significantly more likely to choose the narrower room when the width difference was medium rather than large).
Mean values for all three groups (standard deviations in parentheses)

a Excludes cases where room widths were the same. RT, reaction time. EE, native speakers of English. JJ, Japanese-only speakers. JE, Japanese speakers of English.
Results of logistic regression model predicting likelihood of selecting the narrower of the two room images

Note: R code = glm(choice_narrow ~ group + width difference + height difference + area difference + trial + I (area difference^2) + I(trial^2) + group:width difference + group:area difference + group:I(area difference^2), family = “binomial”, data = WYL_logit_data). Model validation was tested by comparing the specified model to the null model using a log likelihood test. This indicated that the specified model provided significantly better fit than the null model χ2 = 379.77, p < .001. Reference categories are as follows: group = EE, width difference = medium, height difference = medium. JE, Japanese speakers of English. JJ, Japanese-only speakers.
Results of mixed-effects model comparing reaction times

Notes: R code = lmer(RT ~ (1 | person) + (1 | item) + group + width difference + height difference + area difference + I(area difference ^2) + group:width difference + group:area difference + group:I(area difference^2), data = WYL_data). R 2 marginal = .10, R 2 conditional = .59. Reference categories are as follows: group = EE, width difference = medium, height difference = medium. JE, Japanese speakers of English. JJ, Japanese-only speakers.
Group × Width interaction effects for logistic regression model.

Group × Area Difference interaction effects for logistic regression model.

In respect to the Group × Area Difference interactions (Figure 4), a post hoc analysis revealed that all three groups’ behaviors were significantly different (EE-JE z = 7.48, p < .001, EE-JJ z = 12.45, p < .001, and JE-JJ z = 5.69, p < .001). In brief, the results indicated that the probability of the EE group picking the narrower room was highest when there was little area difference between the room sizes, but this probability tapered off as the area difference grew larger. The opposite pattern was found for the JJ group. In respect to the JE group, there appears to be indications that their performance was between the two L1 groups, even though the slope line in Figure 4 resembles that of the JJ group more than the EE group. Overall, then, both interaction effects for the logistic regression analysis are consistent with our expectations regarding the two L1 groups, while also indicating that the JE group’s behavior was between that of the L1 groups.
As for the RT results (Table 4) the JJ and JE groups responded significantly faster than the EE group for items that had a medium difference in width and height. Subsequent releveling of the data indicated that there was no difference between the JJ group and the JE group, t = –0.057, p = .568, in RTs for these two groups. Of particular interest were the significant interactions for Group × Width Difference and Group × Area Difference that paralleled the logistic regression results. The within-group contrasts for the Group × Width Difference (Table 5) interactions indicated that there were significant differences for the EE group for all three contrasts, but no significant differences were found for the other two groups. The between groups contrasts (Table 6) resemble those of the within-group contrasts in that there were significant differences between the EE group and the two other groups for items with the same or medium width difference, but not between the two L1 Japanese-speaking groups. The Group × Area Difference contrasts (Table 7 and Figure 5) tell much the same story: the EE group’s results were significantly different from the two L1 Japanese groups, but these two groups showed no significant difference. Further, the EE group’s responses tended to get slower as area difference increased while the JE and JJ groups’ responses got faster on average (Figure 5).
Within-group post hoc comparisons for reaction times for different widths (results are averaged over the three levels of height difference)

Note: EE, native speakers of English. JE, Japanese speakers of English. JJ, Japanese-only speakers.
Between group post hoc comparisons for response times for different widths (results are averaged over the three levels of height difference)

Note: EE, native speakers of English. JE, Japanese speakers of English. JJ, Japanese-only speakers.
Post hoc comparisons for Group × Area difference response times (results are averaged over the three levels of width and height difference)

Note: EE, native speakers of English. JE, Japanese speakers of English. JJ, Japanese-only speakers.
Group × Area Difference interactions for reaction times.

The final analyses consisted of comparing fixation percentages and dwell time percentages in the horizontal quadrants (Tables 8 and 9). Both analyses indicated that there were no significant differences between the EE group and the JJ and JE groups (EE vs. JJ fixation t = –0.340, p = .735, dwell time t = –0.755, p = .453, EE vs. JE fixation t = –0.736, p = .464, EE vs. JJ dwell time t = 0.031, p = .975, EE vs. JE dwell time t = –0.719, p = .474). Releveling the data indicated that there were also no significant differences between the JJ group and the JE group either (fixation t = –1.08, p = .286, dwell time t = –0.755, p = .453). There was, however, a significant interaction between group and trial for both eye-tracking measures. Figure 6 shows that the EE group tended to have proportionally fewer fixations in the horizontal quadrant as the test continued, while the JJ and JE groups’ data showed the opposite trend (the same pattern was found for the dwell time percentage interactions as well). This seems to indicate differing shifts in strategies between the groups over the course of the experiment.
Results of mixed-effects model for fixation percentages in horizontal quadrants

Note: R code = lmer(horfix_per ~ (1 | person) + (1 | item) + group + trial+ I(trial^2) + group:trial + group:I(trial^2), data = WYL_data). R 2 marginal = .01, R 2 conditional = .49. Reference categories are as follows: group = EE. JE, Japanese speakers of English. JJ, Japanese-only speakers.
Results of mixed-effects model for dwell times percentages in horizontal quadrants

Notes: R code = lmer(hordt_per ~ (1 | person) + (1 | item) + group + trial+ I(trial^2) + group:trial, data = WYL_data). R 2 marginal =.01, R 2 conditional = .49. Reference categories are as follows: group = EE. JE, Japanese speakers of English. JJ, Japanese-only speakers.
Group × Trial interactions for percentage of fixations in horizontal quadrants.

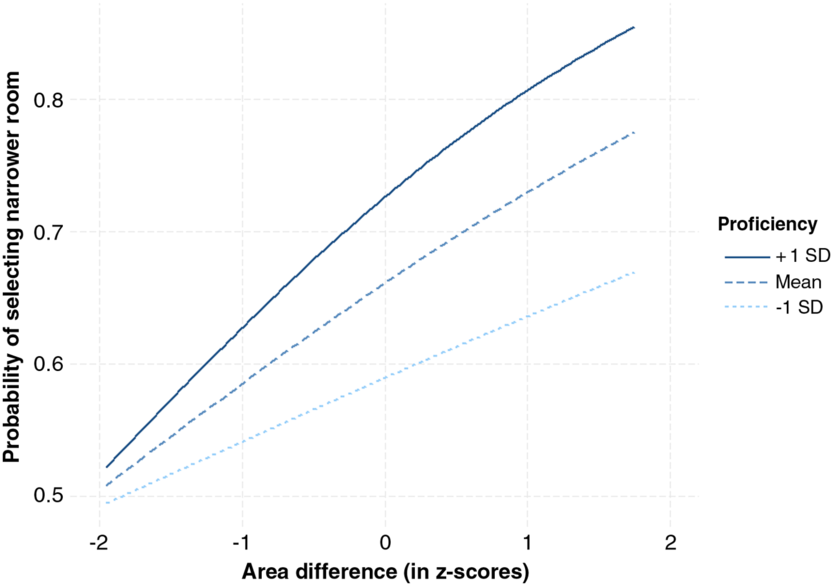
To gain insights into the effects of proficiency on the dependent variables, a series of additional models was constructed using only the JE group’s data (again with the proficiency estimations from V_YesNo test (log adjusted, centered, and standardized)). Table 10 shows the results of the logistic regression analysis. The results show that there was a positive, significant main effect for proficiency, suggesting that as proficiency increased so did the likelihood of choosing the narrower of the two room images. The significant interaction between proficiency and area difference indicated that as area difference increased, so did the likelihood of selecting the narrower room. However, this tendency was stronger as proficiency increased (Figure 7).
Results of logistic regression model predicting likelihood of selecting the narrower of the two room images for Japanese speakers of English (JE) group

Note: R code = glm(choice_narrow ~ proficiency + area difference + trial + group:area difference + group:trial, family = “binomial” data = EVST_logit_data). Model validation was tested by comparing the specified model to the null model using a log likelihood test. This indicated that the specified model provided significantly better fit than the null model χ2 = 86.49, p < .001.
Proficiency × Area Difference interactions for logistic regression model for Japanese speakers of English (JE) group.
RT results for the JE group are shown in Table 11 with the interaction plots shown in Figures 8 and 9. The plots indicate that more proficient learners were approaching the task with a conceptual understanding more in line with the English narrow, while the less proficient learners were approaching the task with a conceptual understanding that was more in line with the Japanese semai. Figure 8, for example, shows that higher proficiency learners took considerably longer to respond to items that had the same width difference than those with a medium or large width difference. Lower proficiency learners, in contrast, demonstrated the opposite trend. A similar pattern is found in respect to area differences shown in Figure 9. These findings provide evidence that the conceptualizations associated with narrow were highly dependent on proficiency; higher proficiency learners seemed to be using a conceptualization that was more in line with L1 English speakers’ notion of narrow, while lower proficiency learners’ conceptualizations seemed more in line with the concept mapped to the Japanese semai.
Results of mixed-effects model for reaction times for Japanese speakers of English (JE) group (with medium width differences, and medium height differences as reference categories)

Note: R code = lmer(RT ~ (1 | person) + (1 | item) + proficiency + width difference + height difference + area difference + proficiency:width difference + proficiency:area difference, data = EVST data). R 2 marginal = .01, R 2 conditional = .60.
Proficiency × Width Difference interactions for response times for Japanese speakers of English (JE) group.

Proficiency × Area Difference interactions for response times for Japanese speakers of English (JE) group.

As with the initial comparisons between the three groups, models for fixations and dwell times in horizontal quadrants, however, did not reveal any significant results of interest; the proficiency values did not significantly improve the fit of either model, either as a main effect or in interactions. The only fixed effect that significantly improved the fit of the fixation percentages model was trial (in both linear and quadratic forms). The final model for dwell time was much the same except that there was also a significant main effect for height differences.
Discussion
This study set out to address the following research questions:
1. Do L1 speakers of English and L1 speakers of Japanese perform the same visual task differently when instructions are provided in their L1s?
2. If so, do L1 Japanese speakers of L2 English perform the same task with English instructions more like L1 speakers of English or L1 speakers of Japanese?
3. Is performance conditioned by proficiency, with more proficient L2 English speakers performing more in line with L1 English speakers and less proficient L2 English speakers performing more in line with L1 Japanese speakers?
Based on the results of this study, the answer to the first question appears to be yes, but not in all respects. The EE and the JJ groups differed significantly in terms of judgments and RT, but not for the eye-tracking measures. Furthermore, the judgment and RT findings indicate, as expected, that the EE group was concerned primarily with differences in width, while the JJ group was concerned primarily with differences in overall area. This is consistent with our expectations and the conceptual associations of narrow and semai. The answers to the remaining research questions are less straightforward, but the general trend indicates that the JE group tended to perform more like the JJ group than the EE group when assessed as a whole (though with some notable differences), but became more L1 English nativelike with increases in proficiency. Consistent with the findings comparing all three groups, however, it was the judgments and RTs that revealed the most notable differences in the JE group; the eye-tracking measures were not effective at detecting proficiency-related differences. In the rest of this section we will consider some of the further implications of these findings.
Conceptual transfer and lexical development
In reviewing the last two research questions, it should become clear that although they are related, they are not addressing exactly the same phenomena. The second question is concerned with conceptual transfer and the third with lexical development after transfer. Starting with issues of transfer, the current study appears to provide evidence for L1 to L2 conceptual transfer affecting receptive language use. As noted by both Jarvis (Reference Jarvis2016) and Gullberg (Reference Gullberg2014), studies showing evidence of conceptual transfer in receptive language have thus far been lacking. Nonetheless, we should not disregard other potential sources of transfer for our findings because, as argued by Jarvis (Reference Jarvis2016), these sources can lead to evidence, which only appears to be attributable to conceptual transfer. The explanation that might confound our conclusions of conceptual transfer in the current study is that the results might have come about as the result of structural transfer rather than conceptual transfer per se. To recap, structural transfer occurs when learners transfer a pattern due to structural restrictions in the L1 (e.g., Jarvis’s example of on the fifth floor [rather than *in the fifth floor] mentioned above).
In this study, it might be possible that the propensity for the lower-proficiency participants to attend more to the area of the rooms and less to the width of the rooms was the result of a direct transfer of the Japanese expression semai heya (narrow/small/cramped room) for the English expression small room. However, this explanation is insufficient given the fact that (a) Japanese has a word chiisai/chiisana (小さい/小さな) that is a standard translation equivalent to small, and (b) there is no strong collocational restriction on the expression chiisai/chiisana heya (literally small room). A corpus search using the Japanese language corpus referred to above (NINJAL-LWP for BCCWJ corpus, http://nlb.ninjal.ac.jp/) revealed that the combined frequency of the expressions chiisai heya (小さい部屋) and chiisana heya (小さな部屋) was slightly higher than the frequency for semai heya (狭い部屋; 101 and 98 instances, respectively). This is in contrast to Jarvis’s (Reference Jarvis2016) example of in the fifth floor*, and it suggests that there was an element of conceptual transfer involved for the JE group.
Nonetheless, frequency counts for the collocations alone do not tell the whole story. For this reason, it is useful to look at word-level frequencies for all four adjectives (i.e., narrow, small, semai, and chiisai/chisansa), as well as mutual information scores for the collocations involving these words with the collocate room.Footnote 8 In comparing narrow with small, raw frequency counts in the COCA indicate that small is about 9.5 times more common than narrow. In contrast with this, chiisai/chisansa is about 2.8 times more common than semai according to the NINJAL-LWP for BCCWJ corpus. In respect to mutual information scores, small room, narrow room, and chiisai/chisansa heya all demonstrate comparable mutual information scores at 3.66, 3.91, and 3.20, respectively. However, the mutual information score for semai heya is considerably higher at 7.19.
This has potential implications for the interpretation of the results, as it suggests the possibility that the tendency of the JE group’s (mis)understanding of narrow, particularly at lower proficiency levels, may have come about as a result of semantic transfer rather than conceptual transfer. In other words, they may be transferring the more common collocation from their L1 into the L2 with no real difference in conceptual understanding. However, there are issues with this explanation as well. If the JE group had been approaching the task with the same conceptual understanding as the EE group, then we would not expect such a divergent performance in judgments between the JE group and the EE group. In addition, this explanation brings us back to the issue raised in the introduction regarding the inherent difficulties in fully disentangling semantic transfer from conceptual transfer. If an L2 speaker has established a faulty link between the L2 word and its associated concept, then can it be confidently inferred that they have the same understanding at the conceptual level?
Jarvis and Pavlenko’s (Reference Jarvis and Pavlenko2008) example of semantic transfer involving the word chair and its underlying conceptual meaning of LEADER(SHIP) exemplifies this distinction fairly well due to the polysemous nature of the word chair. However, even this fairly clear-cut example is problematic if one considers the origins of the word chair in denoting LEADER(SHIP). According to the Oxford English Dictionary, this sense of chair historically denotes a “seat of authority, or dignity; a throne, bench, judgement-seat, etc.” (oed.com). In this respect, the word chair indicating LEADER(SHIP) has a direct conceptual link to the word chair as a piece of furniture. Once a learner is exposed to the LEADER(SHIP) meaning for chair, it seems highly likely that he or she will modify their conceptual understanding for CHAIR, if only slightly, to accommodate this newly acquired knowledge (regardless of whether or not they are aware of the etymological association). It goes back to Murphy’s (Reference Murphy2002) observation regarding the reciprocal relationship between word meanings and conceptual understandings.
It seems reasonable to conclude, therefore, that the current results add to the existing body of research by indicating the likelihood of at least a measure of conceptual transfer in the domain of space. Thus far investigations into spatial transfer at a lexical level have focused mostly on spatial relationships encoded in prepositions of space (e.g., Ijaz, Reference Ijaz1986; Jarvis & Odlin, Reference Jarvis and Odlin2000; Krzeszowski, Reference Krzeszowski1990; Munnich & Landau, Reference Munnich and Landau2010) and phrasal verbs (Park & Ziegler, Reference Park and Ziegler2013). The current findings are in concert with these findings. However, the current findings extend the previous research by focusing on adjectives of space, and by using a methodology that was focused on receptive language use. Thus, although our results do not differ substantially from previous studies, the findings of the current study provide empirical evidence that allows us to apply more broadly the notion of conceptual transfer.
As for the connection between conceptual development and proficiency is concerned, the results of the current study are consistent with findings reported in Athanasopoulos (Reference Athanasopoulos2006, Reference Athanasopoulos2007), Athanasopoulos and Kasai (Reference Athanasopoulos and Kasai2008), Bylund and Athanasopoulos (Reference Bylund and Athanasopoulos2013), Park (Reference Park2019), and Park and Ziegler (Reference Park and Ziegler2013). However, they stand in opposition to the findings of Gullberg (Reference Gullberg2009) and Jiang (Reference Jiang2002, Reference Jiang2004). It could be argued that the findings of the studies by Gullberg (Reference Gullberg2009), Jiang (Reference Jiang2002, Reference Jiang2004), and Park and Ziegler (Reference Park and Ziegler2013) are more closely related to the findings of the current study, as these particular studies looked specifically at lexicalized concepts while the other studies focused on grammaticalized concepts. Therefore, it makes sense to compare the results of the current study to these four studies in particular and, in doing so, indicate why the results of the current study are not consistent with those of Gullberg (Reference Gullberg2009) and Jiang (Reference Jiang2002, Reference Jiang2004) in particular, all of which indicated a negligible effect of proficiency on the development of native speaker-like conceptualizations. The obvious question that arises here is what can account for the difference in the findings of the current study and the findings of these researchers?
In addition to domain specificity and individual differences, another plausible explanation seems to be related to differences in item selection and the connection this might have to the potential for acquisition versus stabilization. In an attempt to more precisely understand the ways in which L1 structures are represented in the L2, Stockwell, Bowen, and Martin (Reference Stockwell, Brown and Martin1965) proposed their influential hierarchy of difficulty (Figure 10). As can be seen in Figure 10, the easiest structures to acquire are those that have L1-L2 correspondence, while the hardest structures are those that are represented by a single form in the L1 but two (or more) forms in the L2. The words tested in Jiang and Gullberg’s studies fall into this latter category (i.e., one L1 word represented by two in the L2), while the words tested in the current study can most accurately be described as (more or less) corresponding, even if semai and narrow are not perfect equivalents.
Adapted from Stockwell, Bowen, and Martin’s (Reference Stockwell, Brown and Martin1965) hierarchy of difficulty in second language learning.

To reiterate, the relationship between the English narrow and the Japanese semai is not one of a single L1 form mapping onto two L2 forms, but rather one of subsumption (see Pavlenko, Reference Pavlenko and Pavlenko2009). In other words, the concept associated with semai subsumes the concept associated with narrow, but there is still a one-to-one correspondence as is evidenced in the fact that Japanese does make a clear distinction between semai (narrow) and chiisai/chiisana (small). In light of these considerations, it may be that the findings of the current study do not directly conflict with those of Jiang and Gullberg. Instead, it may be that the tendency to develop a more nativelike conceptualization for certain L2 words is linked to the manner in which the L1-based and L2-based concepts converge or diverge. In the case of the Jiang and Gullberg studies, the difficulty seems to lie in parsing out two concepts that are viewed as distinct in the L2 but indistinct in the L1. In the case of the current study no such separation needs to occur. Instead the learner simply has to recognize a difference in the boundaries of his or her L1-based concept and bring them more into line with that of the L2. Thus, the collective results of these studies seem to be painting a more comprehensive picture of conceptual transfer and lexical development, a picture that is in line with existing theories regarding transfer in second language acquisition and what sorts of L1-L2 structures might be prone to stabilization versus acquisition.
Eye-tracking measures
Our expectation that the eye-tracking data would reveal differences between the groups was based on two assumptions. The first was that participants would exert intentional control over where they look when presented with a goal-oriented visual task such as the one used in this study (e.g., Posner, Reference Posner1980). It is unlikely that this assumption was flawed when we consider the formidable amount of research suggesting that this is how people process information visually (e.g., Neisser’s, Reference Neisser and Pick1979, seminal study on selective looking). However, our second assumption, that the EE group (and advanced JE speakers) could better complete the goal by focusing on the quadrants that demarcated the horizontal spaces in the room images, likely was flawed. Although an additional analysis of the raw numbers for fixations and dwell times do show significant difference between the EE and the JJ groups, this is likely due to the fact that the EE group simply took longer to complete the task than did the JJ group (and the JE group), which naturally entailed more fixations and longer dwell times in general. In addition, although the judgment data (as well as the data gathered from the EE participants in informal debriefings) indicated that the EE participants focused almost exclusively on differences in width between the two rooms, the visual strategies they used to complete this task varied considerably.
This can be seen in Figure 11, which shows the agglomerated (i.e., all fixations for all trials mapped onto a single image) fixation points for three, randomly chosen EE participants. As can be seen, although all three participants were attempting to achieve the same goal, their approaches were markedly different. In the first image, the participant seemed to fixate mostly on the center portions of the room images. The second image shows fixations mostly on the two horizontal quadrants closest to the center of the screen with a number of fixations in the upper quadrants as well. Finally, the third image shows a fixation pattern that is far more spread out, including a number of fixations that occurred below the room images entirely. In brief, then, it appears that our assumptions about fixations and dwell times were far too simplistic and there is little doubt that this oversimplified assumption applied to the eye movements of the JJ and JE groups as well.
Agglomerated fixations for three randomly chosen naive speakers of English (EE) participants.

Conclusion
The main purpose of this study was to gather data that could provide evidence of conceptual transfer and lexical development for spatial adjectives in a receptive task. The results of the judgments and the RT measures are fairly conclusive, and suggest that L1 English and L1 Japanese speakers have markedly different conceptualizations for the partially equivalent terms narrow and semai. These results are also fairly conclusive in indicating that although learners might initially transfer conceptualizations formed in their L1 to corresponding L2 lexical items, they do eventually replace these conceptualizations, at least for some words, with ones that are more in line with L1 speakers of the target language. Nonetheless, it was also clear from the results of the eye-tracking data that our assumptions regarding the effectiveness of our task in detecting perceptible manifestations of conceptual differences in eye movements were not sound, at least not for the visual stimuli used in this study. We can conclude from this that either different methodologies or different images (e.g., three-dimensional images) might be necessary to gather more direct evidence for the cognitive manifestations of conceptual transfer.



