


Cities and other local governments play a crucial role in American democracy. There are nearly 90,000 local governments in the United States. Collectively, these local governments employ approximately 11 million workers, collect nearly a quarter of the nation’s revenues, and allocate a large share of the country’s public goods (U.S. Census Bureau 2012; Trounstine, Reference Trounstine2010). As a result, it is crucial to know whether city governments represent the views of their citizens.
There is a large literature showing that elected officials at the national (Stimson, MacKuen, and Erikson Reference Stimson, MacKuen and Erikson1995) and state (Erikson, Wright, and McIver Reference Erikson, Wright and McIver1993; Lax and Phillips Reference Lax and Phillips2012) levels are responsive to the policy preferences of their constituents. In contrast, scholars of urban politics have focused on the economic, political, and legal constraints facing local policymakers (Gerber and Hopkins Reference Gerber and Hopkins2011; Leigh Reference Leigh2008; Nivola Reference Nivola2002; Peterson Reference Peterson1981 Reference Peterson1995; Rae Reference Rae2003; Self Reference Self2003). Due to the multitude of constraints on local governments, most past work has concluded that political factors have little influence on local policy outputs (Craw Reference Craw2006; Gerber and Hopkins Reference Gerber and Hopkins2011; Morgan and Watson Reference Morgan and Watson1995; Peterson Reference Peterson1981; Ruhil Reference Ruhil2003; Wolman, Strate, and Melchior Reference Wolman, Strate and Melchior1996). However, there have been no comprehensive studies about whether city policies are actually responsive to the views of their citizens. This gap in the literature is largely due to the fact that previous scholars have lacked a measure of the policy preferences of city residents (Trounstine Reference Trounstine2010). Most previous studies have used proxies for public opinion such as partisanship or demographic groups rather than a direct measure of the policy conservatism of citizens in each city and town (e.g., Craw Reference Craw2010; Hajnal and Trounstine Reference Hajnal and Trounstine2010).
In this study, we examine the relationship between the policy preferences of the mass public and municipal policy outcomes. Our work utilizes new estimates of the mass public’s policy conservatism in all cities and towns with more than 20,000 people. Our measures of city policy conservatism are generated by jointly scaling the ideal points of over 275,000 people from seven recent large-scale surveys, and then using recent advances in opinion estimation to develop more accurate estimates at the city level. In all, we examine representation in over 1,600 cities and towns across the country.
In contrast to previous work that emphasizes the constraints on city elected officials, we find that city governments are responsive to the views of their citizens across a wide range of policy areas. Moreover, the substantive impact of citizens’ preferences on policy outcomes is quite large. After controlling for a number of factors that influence city policies, the most liberal cities spend over twice as much per capita as the most conservative cities. They also have higher taxes per capita and less regressive tax systems than conservative cities.
Next, we examine whether variation in political institutions affects democratic responsiveness in city governments. Many of these institutions were established by reformers to cultivate “better” government by reducing the power of narrow interests and wresting power from local bosses. For instance, some cities have elected mayors, while other cities eschew elected mayors in favor of city councils and professional managers. But the broader impacts of these reforms are unclear. In particular, we do not know whether they enhance representation in city government (Trounstine Reference Trounstine2008). In this article, we study the impact of five institutions designed to enhance representation. In contrast to the expectations of reformers, we find that no institution seems to consistently improve responsiveness.
The article proceeds as follows. First, we discuss previous literature on representation in municipal government. Next, we examine the previous literature on the impact of local political institutions on democratic responsiveness. Third, we discuss our research design. Next, we present our findings on the responsiveness of city policy outcomes to public opinion and the effect of political institutions on representation. Finally, we briefly conclude and discuss the implications for future research.
RESPONSIVENESS IN CITY GOVERNMENT
The term responsiveness means that government “responds” to changes in citizens’ views by moving policy in the direction of those views. Cross-sectionally, this implies that places where the public holds more conservative views should have more conservative policies (Erikson, Wright, and McIver Reference Erikson, Wright and McIver1993). This definition of responsiveness is based on liberal notions of popular sovereignty. At a minimum, in a representative democracy the views of citizens should influence government policy decisions (Achen Reference Achen1978).Footnote 1
Many scholars argue that municipal governments are unresponsive to the views of their citizens (Craw Reference Craw2006; Morgan and Watson Reference Morgan and Watson1995; Peterson Reference Peterson1981; Ruhil Reference Ruhil2003; Wolman, Strate, and Melchior Reference Wolman, Strate and Melchior1996). This view suggests that elected city leaders have limited control over policy outcomes due to a multitude of institutional constraints (Gerber and Hopkins Reference Gerber and Hopkins2011). First, cities are subordinate to states and the national government. There are a variety of statutory or constitutional constraints on specific local policies (Ladd and Yinger Reference Ladd and Yinger1989). For instance, many states restrict local governments’ ability to levy sales or property taxes. Moreover, there are a number of areas where responsibility over policy is shared between levels of government (Berman Reference Berman2003; Craw Reference Craw2006; Nivola Reference Nivola2002; Peterson Reference Peterson1995). Federal and state governments also exert indirect control over local policy by providing restricted grants and funding streams for specific programs. In addition, cities face constraints due to economic competition from other jurisdictions (Bailey and Rom Reference Bailey and Rom2004; Ladd and Yinger Reference Ladd and Yinger1989; Peterson Reference Peterson1981; Rae Reference Rae2003). Indeed, cities have little control over the movement of people, industry, and capital across their borders.
Overall, the consensus in the literature on municipal politics is that the policy decisions of city governments are unresponsive to the views of their citizens. However, there are reasons to believe that city governments should be responsive to the policy preferences of their citizens. The central assumption of American politics scholarship over the past 30 years is that elected officials are primarily motivated by electoral incentives (Kousser, Lewis, and Masket Reference Kousser, Lewis and Masket2007; Mayhew Reference Mayhew1974). Re-election minded officials have incentives to adhere to the will of their constituents in order to gain their votes. This means that they should be responsive to the median voter in their constituency (Downs Reference Downs1957; Erikson, Wright, and McIver Reference Erikson, Wright and McIver1993).
A variety of scholars have found that citizens hold local officials accountable for their decisions in office. Arceneaux (Reference Arceneaux2005) finds that survey respondents connect their evaluation of mayors’ performance on traffic congestion and other salient issues to their vote choice. Similarly, Howell and Perry (Reference Howell and Perry2004) show that respondents’ evaluations of city services in four large cities (Charlotte, Chicago, Detroit, and New Orleans) were significantly related to mayoral approval ratings. Finally, Stein, Ulbig, and Post (Reference Stein, Ulbig and Post2005) find that mayoral approval significantly predicts vote choice in several recent Houston mayoral elections.
Responsiveness in cities does not necessarily depend on a traditional view of the legislator-constituent relationship, in which constituents observe the actions of legislators and reward whoever best represents their policy preferences. Tiebout (Reference Tiebout1956) offers a model of city politics in which citizens locate themselves in cities which best match their preferences for public goods provision. It may be the case the citizens vote on the basis of vague notions of approval for the policies of their city, and that their choice to move or stay creates a market-based mechanism for city representation. In the Tiebout model, citizens need not have a deep knowledge of the actions of their public officials, they need only know what level of public goods they are receiving. This logic applies equally well to other policies besides public goods provision, for instance the kind of public goods provided. One implication of a Tiebout type model is that representative institutions may not matter very much. Elected politicians are incentivized to pursue policies that retain and attract like-minded citizens, regardless of whether they are city councilors or mayors, partisan or nonpartisan, or whether voters can change policy directly at the ballot box.
Some recent work supports the notion that local policymakers are responsive to the views of their constituents. For instance, Gerber and Hopkins (Reference Gerber and Hopkins2011) show that Democratic mayors spend less on police and fire services than their Republican counterparts.Footnote 2 Palus (Reference Palus2010) examines policy responsiveness in 26 large cities, and finds strong evidence that the ideological preferences of citizens are reflected in the spending decisions of governments. At the county level, Choi et al. (Reference Choi, Bae, Kwon and Feiock2010) find that Democratic votes for president are correlated with greater expenditure levels and a larger share spent on redistribution. Overall, these previous theoretical and empirical studies on responsiveness lead to our first hypothesis:
H1: City policies are responsive to the policy preferences of their citizens.
THE IMPACT OF INSTITUTIONS ON RESPONSIVENESS IN CITIES
There are a number of institutions that reformers have established to improve the quality of municipal government (Lubell et al. Reference Lubell, Feiock, La Cruz and Ramirez2009; Trounstine Reference Trounstine2008). In this section, we focus on five such institutions: the presence of a city manager rather than an elected mayor, the presence of direct democracy provisions, the presence of nonpartisan elections for mayor and city council, the presence of term limits, and the presence of at-large versus single-member elections.
These institutions are a good test case for the importance of municipal institutions because they were designed with representation in mind. In particular, reformers around the end of the 19th century sought to cultivate “better” government by decreasing the power of party machines, increasing professionalization and promoting political involvement by the “right” kind of people. The Progressive Era reformers wanted to diminish the power of narrow interests and wrest power from local bosses. Although the power of party bosses greatly diminished over the course of the 20th century, the broader impacts of these reforms is unclear. In particular, we do not know whether they enhance or reduce representation in cities as a whole, especially now that the power of local political parties are greatly diminished even in cities that retain prereform institutions (Trounstine Reference Trounstine2008).
According to one recent study, “the most frequently analyzed and politically debated feature of municipal government is the balance of electoral versus managerial power in the executive branch of city government” (Lubell et al. Reference Lubell, Feiock, La Cruz and Ramirez2009). In the early 20th century, most cities had an elected mayor that led the executive branch and a city council that handled legislative functions (Schiesl Reference Schiesl1977). The Progressive reform movement came to link mayor-council systems with the inefficiency and corruption of party machines. Reformers argued that city governments should be run by experts rather than politicians (Hofstadter Reference Hofstadter1956; National Municipal League 1916). The “reform” council-manager system eliminated the political position of an elected mayor as chief executive (Lubell et al. Reference Lubell, Feiock, La Cruz and Ramirez2009). Instead, cities hired a professional city manager to run the government and make daily administrative decisions. The mayor was reduced to a figurehead with little real power. Most cities have adopted a council-manager form of government (Ruhil Reference Ruhil2003; Svara Reference Svara1990). While city managers may be better than elected mayors at promoting efficiency and economic development (Stein Reference Stein1990), the dominant view among scholars is that cities with an elected mayor are more responsive to the views of their citizens than cities with a “reform” council-manager system (Sharp Reference Sharp1997; but see Lubell et al. Reference Lubell, Feiock, La Cruz and Ramirez2009). This leads to the hypothesis that:
H2: Cities with elected mayors are more responsive to the views of their citizens than cities with a council-manager system.
Progressive reformers also believed that partisan elections helped to increase the power of party bosses. As a result, they promoted the creation of nonpartisan elections for municipal office (Trounstine Reference Trounstine2010). In nonpartisan elections, parties do not officially nominate candidates for office, and candidates’ party affiliations generally do not appear on the ballot. Most cities in the United States have adopted nonpartisan elections. Scholars have reached conflicting results on the effect of nonpartisan elections on representation. Hansen (Reference Hansen1975) finds some evidence that cities with nonpartisan elections have weaker representation. More recent work on nonpartisan judicial elections has found that judges elected through nonpartisan elections are more responsive to public opinion since they cannot rely on partisan cues to signal their policy positions (Caldarone, Canes-Wrone, and Clark Reference Caldarone, Canes-Wrone and Clark2009). But others argue that nonpartisan elections typically have lower turnout than partisan elections, which may increase the power of special interests (Schaffner, Streb, and Wright Reference Schaffner, Streb and Wright2001). We examine the following hypothesis:
H3: Cities with partisan elections are more responsive to their citizens’ policy preferences than cities with nonpartisan elections.
A more recent reform designed to increase democratic responsiveness is the development of direct democracy provisions. The potential for citizen initiatives may create stronger incentives for elected officials to be attentive to constituent interests. As a result, scholars argue that policy choices are more likely to be responsive to voters’ preferences when direct democracy exists (McCabe and Feiock Reference McCabe and Feiock2005). While few studies have studied the effect of direct democracy on representation at the local level (Lubell et al. Reference Lubell, Feiock, La Cruz and Ramirez2009), the evidence at the state level is mixed. A number of studies have found that majoritarian interests are more likely to prevail in states with direct democracy institutions (Gerber Reference Gerber1999; Matsusaka Reference Matsusaka2010; Tolbert Reference Tolbert, Bowler, Donovan and Tolbert1998). But other studies find no significant relationship between the presence of the citizen initiative and democratic responsiveness (Lax and Phillips Reference Lax and Phillips2012). We examine the following hypothesis:
H4: Cities with direct democracy provisions are more responsive to the views of their citizens than cities without direct democracy.
Reformers in the late 20th century have also argued that the presence of term limits affects the link between elected officials and their constituents (Carey, Niemi, and Powell Reference Carey, Niemi and Powell2000). Some scholars find evidence that the turnover caused by term limits leads to less experienced elected officials (Kousser Reference Kousser2005). This reduces the capacity of lawmakers to assess and respond to public opinion. Moreover, it may reduce legislators’ incentives to respond to public opinion by limiting the value of elected office (Carey et al. Reference Carey, Niemi, Powell and Moncrief2006). However, other scholars argue that the turnover caused by term limits reduces incumbency advantages and leads elected officials to better reflect current constituents’ preferences (Moncrief, Powell, and Story Reference Moncrief, Powell, Story, Niemi, Cain and Kurtz2007). This leads to our fifth hypothesis:
H5: Cities with term limits for their officials are more responsive to their citizens’ policy preferences than cities without term limits.
Reformers in the early 20th century also promoted city-wide (“at-large”) elections to prevent narrow interests from exerting too large an influence on local government (Trounstine Reference Trounstine2010). In unreformed cities, the municipality is divided into geographic areas of roughly equal population size, and each district elects a single city councilor. In reformed cities, councilors are elected by the municipality as a whole. Most previous studies on the impact of at-large elections focus on descriptive representation. These studies generally find better descriptive representation for African-Americans and other racial minorities under a districted system than an at-large system (Bullock and MacManus Reference Bullock and MacManus1993; Davidson and Grofman Reference Davidson and Grofman1994; Trounstine and Valdini Reference Trounstine and Valdini2008; Welch Reference Welch1990). However, while at-large elections may harm descriptive representation, there are good reasons to believe they should enhance responsiveness by “shift[ing] electoral power toward a single median voter and away from geographically concentrated interests” (Trounstine Reference Trounstine2010). This leads to our final hypothesis:
H6: Cities with at-large districts are more responsive to citizens’ policy preferences than cities with single-member districts.
RESEARCH DESIGN
Measuring City Policy Preferences
As the starting place for our model of city policy conservatism, we estimate a large sample of citizens’ ideal points using an approach similar to the one taken by Tausanovitch and Warshaw (Reference Tausanovitch and Warshaw2013). First, we pool together data from seven recent large-scale surveys of the American public (the 2006, 2007, 2008, 2010, and 2011 Cooperative Congressional Election Surveys (CCES) and the 2000 and 2004 Annenberg National Election Surveys (NAES)). Each of these surveys asked between 14 and 32 policy questions to 30,000–80,000 Americans.
We assume that all survey respondents have a quadratic utility function with normal errors. Each item j presents individual i with a choice between a “Yes” position and a “No” position. We assume that respondents’ policy preferences lie in a one-dimensional policy space. A preliminary test of this assumption is provided in Appendix B.Footnote 3 We estimate respondents’ ideal points using a Bayesian Item-Response (IRT) model (Clinton, Jackman, and Rivers Reference Clinton, Jackman and Rivers2004). In all, we estimate the ideal points of over 275,000 Americans.
Next, we estimate city-level policy conservatism by combining our individual-level data with a multilevel regression and poststratification (MRP) model (Park, Gelman, and Bafumi Reference Park, Gelman and Bafumi2004). This approach employs Bayesian statistics and multilevel modeling to incorporate information about respondents’ demographics and geography in order to estimate the public opinion of each geographic subunit. One way of thinking about an MRP model is to compare it to a weighted survey estimate that applies very finely tuned weightings, based on Census data, of specific demographic-geographic types. It estimates each individual’s response as a function of both demographic and geographic predictors. MRP models have been found to produce very accurate estimates of public opinion by state and congressional district with national samples of just a few thousand respondents (Lax and Phillips Reference Lax and Phillips2009; Warshaw and Rodden Reference Warshaw and Rodden2012).
To validate our estimates of city policy conservatism, we compare them with estimates of presidential vote share in each city derived from precinct-level election returns (Harvard Election Data Archive 2012). Our estimates of city policy conservatism are correlated with presidential vote share in the 2008 election at .77. This suggests that our estimates are accurately capturing cities’ policy preferences on a left-right continuum.Footnote 4
Figure 1 shows the policy preferences of the 51 cities with a population larger than 250,000 people. We find significant variation in the policy preferences of cities. Not surprisingly, we find that San Francisco, Washington, DC, and Seattle are three of the most liberal cities in the country. Mesa, AZ, Oklahoma City, OK, and Virginia Beach, VA are three of the most conservative cities.
Mean Policy Conservatism of Large Cities

Measuring the Policy Outcomes
One of the challenges in research on municipal politics is that there are few comprehensive sources of information on city policies. Ideally, we would use an existing measure of the “conservatism” of city policies that is analogous to the measure of state policies developed by Erikson, Wright, and McIver (Reference Erikson, Wright and McIver1993). However, there is no existing measure of policy conservatism available at the city level. As a result, we use a mixed approach and measure city policy outcomes using data from a variety of sources.
First, we developed a new scaled measure of policy outcomes using data from the International City/County Management Association’s (ICMA) 2010 survey of government sustainability. The ICMA survey asks city officials a series of questions about policies that have been enacted by the city government, which they are asked to answer on a factual basis. The survey has an emphasis on environmental policies, but also asks about an array of other policies, such as whether the city provides financial incentives for affordable housing, provides funding for preschool education, or has a program for the purchase or development of historic property, among many others. These questions are scaled in the same way as our measure of citizens’ policy conservatism, using the two-parameter quadratic item response model introduced into political science by Clinton, Jackman, and Rivers (Reference Clinton, Jackman and Rivers2004). Much as individuals choose whether to support a given policy, city government must choose whether to enact these policies, providing us information about the conservatism of the city as a decision-making body.
The resulting measure is as close as we were able to come to a broad liberal-conservative policy score for each city. This measure is a one-dimensional summary of a wide variety of policy “stances,” but in this case the stances are actual enacted policies. However, this measure is not without drawbacks. The survey is intended to evaluate local efforts towards environmental sustainability, and so many of the questions are focused on policies geared towards energy, the environment, and conservation. We find little evidence of a higher-dimensional structure in these data, lending credence to our assumption that this set of questions represents policy more broadly, but it is always possible that this unidimensionality is the result of the exclusion of certain policy issues. This is one reason why our analysis uses three other measures of policy outcomes that we describe below. A full list of questions used on the ICMA survey is provided in Appendix C, and the estimates themselves are available from the authors.
We generate three other city policy measures using data from the U.S. Census Bureau’s 2007 Census of Governments, which provide detailed revenue, expenditure, and employment data for U.S. local governments.Footnote 5 First, we estimate the per capita taxes in each city. Per capita taxes capture the total potential for redistribution within a particular city, and the tax burden is a major issue both within cities and nationally. Next, we estimate the per capita expenditures in each city. Per capita expenditures capture the size of government, one of the core “liberal-conservative” issues in American politics. Finally, we estimate the regressiveness of city taxation based on the share of each city’s revenues that are derived from sales taxes.Footnote 6 Higher shares of sales taxes indicates a local tax structure that falls more heavily on poor residents, whereas tax structures based more heavily on property tax and income taxes are generally more redistributive (Newman and O’Brien Reference Newman and O’Brien2011).
City Institutions
Next, we examine the association between city institutions and responsiveness. Data on municipal institutions were obtained from a variety of sources. We collected data on cities that have elected mayors or council-manager systems from the 1987 Census of Governments. This data were verified against more recent data from the ICMA’s Form of Government surveys.Footnote 7 Data on the presence of direct democracy in cities were obtained from the ICMA’s Form of Governments survey. We filled in data for missing cities from the Initiative & Referendum Institute at the University of Southern California and an internet search of city websites. We obtained information on whether cities have partisan elections or nonpartisan elections from the ICMA’s Form of Governments survey. We filled in data for cities that were not present in the ICMA data using data from Gerber and Hopkins (Reference Gerber and Hopkins2011) and an internet search of city websites. We collected information on whether cities have term limits for their elected officials using the ICMA’s Form of Government surveys and an internet search of city websites.Footnote 8 Finally, we collected information on whether cities use at-large elections for their city councilors using the ICMA’s Form of Government surveys and the 1987 Census of Governments.
Explaining Variation in City Policies
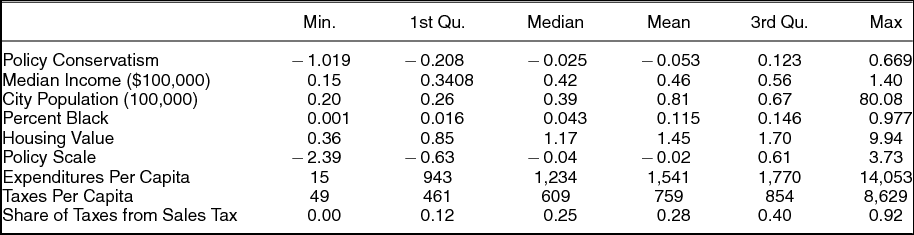
In order to examine the relationship between city conservatism and policy outcomes, we construct a multilevel regression model that controls for a variety of political, economic, and legal factors. In particular, we are concerned about the effects of factors that contribute to a city’s governing capacity. Cities may be constrained by the resources available to them and the extent of the duties they can reasonably be expected to perform. Large cities or rich cities can be expected to be involved in more areas of public life than cities that lack the resources to engage in as many projects. In contrast, smaller, poorer cities may have simpler tax systems, fewer environmental regulations, and lower expenditures. For this reason we include controls for city population, the median income, and median housing value. We also control for the percentage of each city’s population that is African-American (percent black). (See Table 1 for descriptive statistics of all our variables).
Summary Statistics of Key Variables

It is also important to account for heterogeneity in the constraints facing municipal policymakers across states. Indeed, city governments only have powers allocated to them by state laws and constitutions. As a result, the state legal and political context can exert an important influence on municipal policy decisions. We account for state heterogeneity by including random effects for each state in our multilevel models.
While our multilevel model is well suited to examine the association between city conservatism and policy outcomes, it is difficult to interpret the results for the effect of institutions on representation. As we will see, responsiveness of policy to the mass public’s conservatism is nonlinear, often due to what seems to be a conservative “floor” (cities can only spend so little, for instance). A very simple linear model does an adequate job of summarizing responsiveness, but does not capture the potential differences across different institutional settings. As a result, a quadratic model would be preferred. However, this introduces five more interaction terms into our model, and the squared terms have to be interpreted in conjunction with the nonsquared terms. A simpler approach is to use a preprocessing method to approximate balance between institutional conditions, and then use simple nonparametric smoothing methods to show the effects in each institutional condition.
Preprocessing methods are attractive for analyses involving large datasets where balance can plausibly be established by reweighing the data to achieve balance between the treatment and control groups. Ho et al. (Reference Ho, Imai, King and Stuart2007) make the case that preprocessing reduces model dependence compared to standard ordinary least-squares methods. The large set of cities in our dataset allows us to achieve a high level of balance by reweighting our data on all our covariates (Hainmueller Reference Hainmueller2012).
For this analysis, we use entropy balancing matching (Hainmueller Reference Hainmueller2012).Footnote 9 Entropy balancing matching applies a maximum entropy reweighting scheme that calibrates unit weights so that the reweighted treatment and control group satisfy a potentially large set of prespecified balance conditions that incorporate information about known sample moments. In our analysis, for each institutional hypothesis, we balance our covariates’ first moments for cities with one institution, and cities with the other.Footnote 10 The “control” group may then be compared to the “treatment” group. This enables us to simply compare the slope of the relationship between outcomes and policy preferences for the two groups.Footnote 11 We balance on median income, median home values, population, the presence of each institution, and city conservatism.
ARE CITY POLICIES RESPONSIVE TO THEIR CITIZENS?
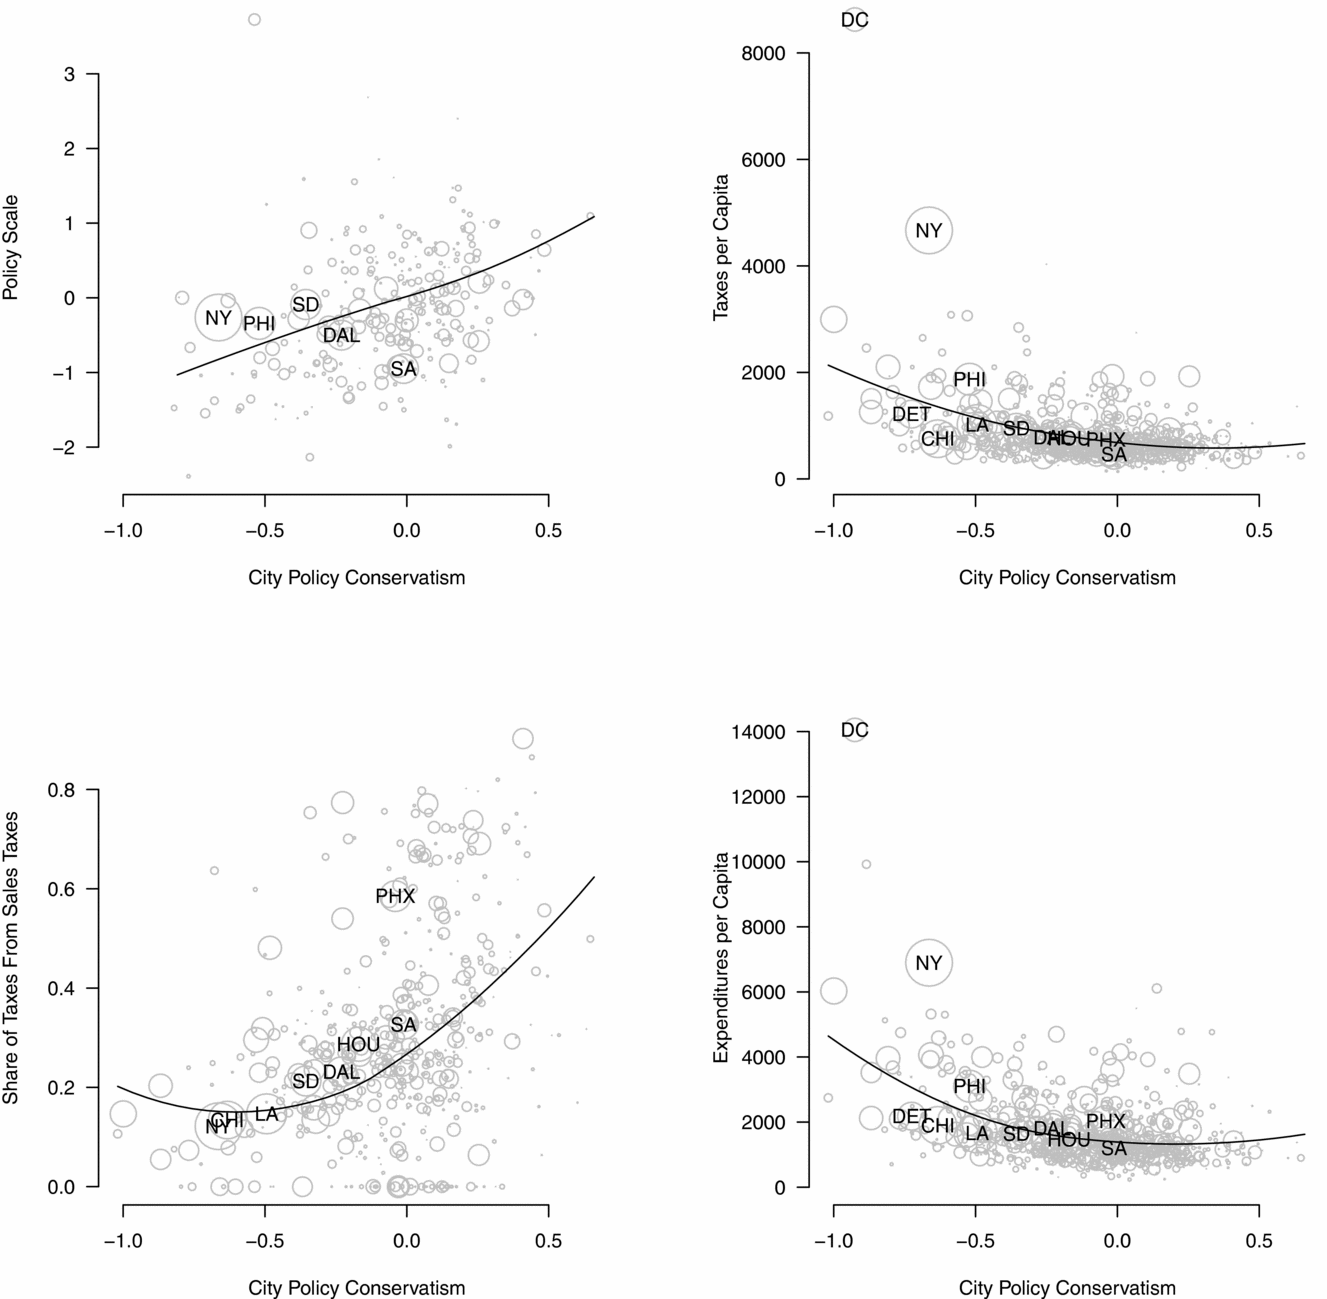
What is the relationship between city policy outcomes and city conservatism? Figure 2 shows the relationship between citizens’ conservatism and four different city policies for the 1,600 cities in our dataset. Each panel shows scatter plots of a policy outcome on the y axis, and mean policy preferences of a given city on the x axis. The panel on the top left is our general policy scale. The panel on the top right shows the relationship between city conservatism and taxes per capita. On the bottom left, we show the association between city conservatism and the share of taxes that come from sales taxes.Footnote 12 Finally, the bottom right plot shows the relationship between policy policy preferences and expenditures per capita. The top ten most populous cities are labeled in each panel with their official abbreviation. We also label Washington, DC, which is a notable outlier on most policy outcomes. The size of the circles representing each city are proportional to population. It is important to note, however, that the analyses are not weighted by population. Loess curves are fitted to each scatter plot.
Responsiveness of City Policy to Public Ideology

These simple bivariate relationships go consistently in the direction we would expect. On the general policy scale, cities with more liberal populations tend to get more liberal policy, and this relationship is remarkably strong and linear. Likewise, liberal cities collect more taxes per capita and have substantially higher expenditures per capita. Moreover, liberal cities have less regressive tax systems. The share of revenues that comes from sales taxes is lower in liberal cities and higher in conservative cities.
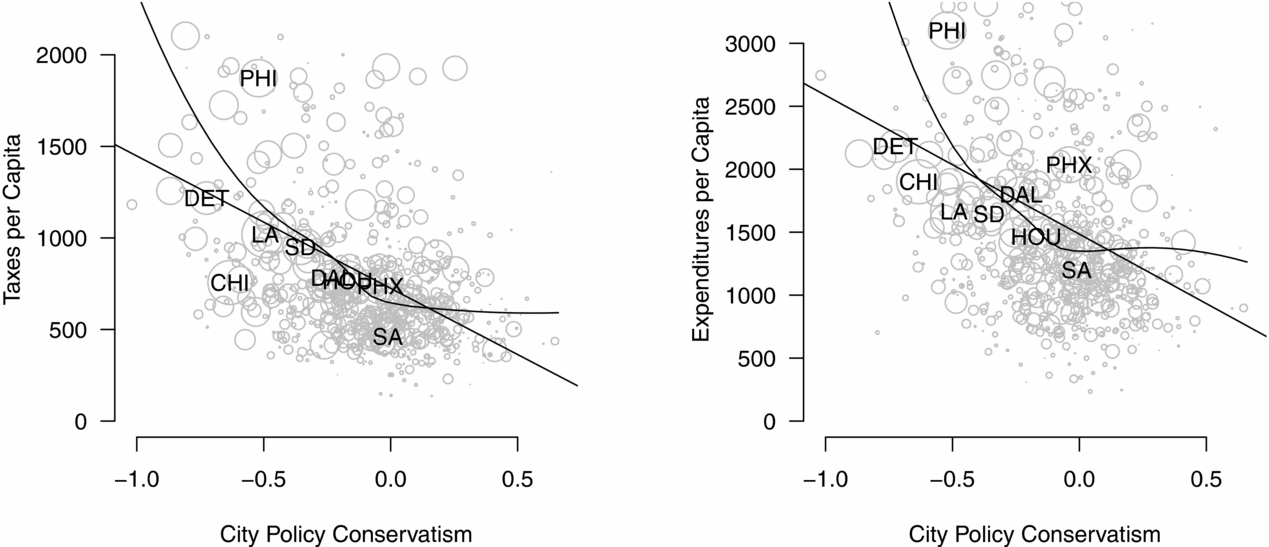
These effects are all large, with upward slopes that cover most of the span of the policy outcome. However, in the case of expenditures per capita and taxes per capita, the relationship is difficult to see due to a small number of high values that stretch the scale of the y axis. In Figure 3, we replot these policy outcomes, censoring the y axis far below the maximum values. In both cases the effect is large, but seems to taper off on the right side of the spectrum, perhaps indicating a minimum level of taxes and service provision that is supported by conservatives.
Responsiveness—Zoomed

Despite a strong bivariate relationship, a number of factors appear to moderate this relationship, as well they should. It appears from Figures 1 and 2 that more populous places have a tendency to be closer to the liberal side of the policy and public preferences, and that there may be a tendency for larger cities to adopt more liberal policies irrespective of preferences. We expect this to be the case, because liberal policy is usually associated with more government activity and larger cities have more capacity for activity. This may also be the case for richer cities.
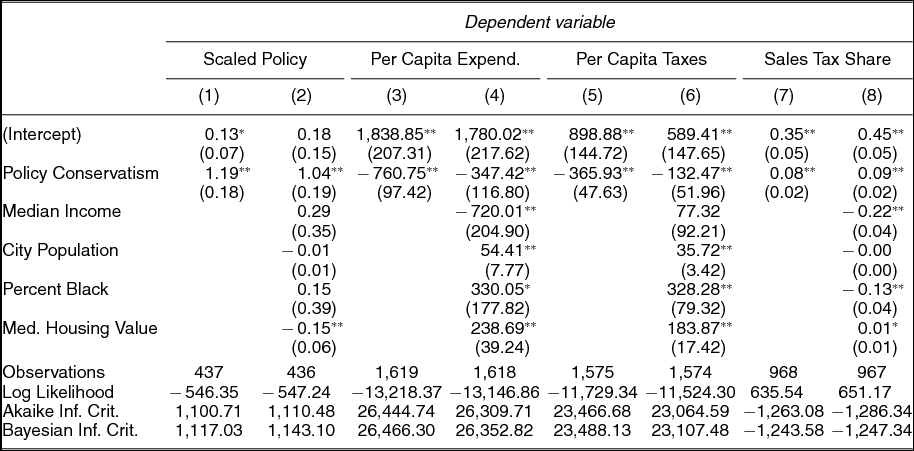
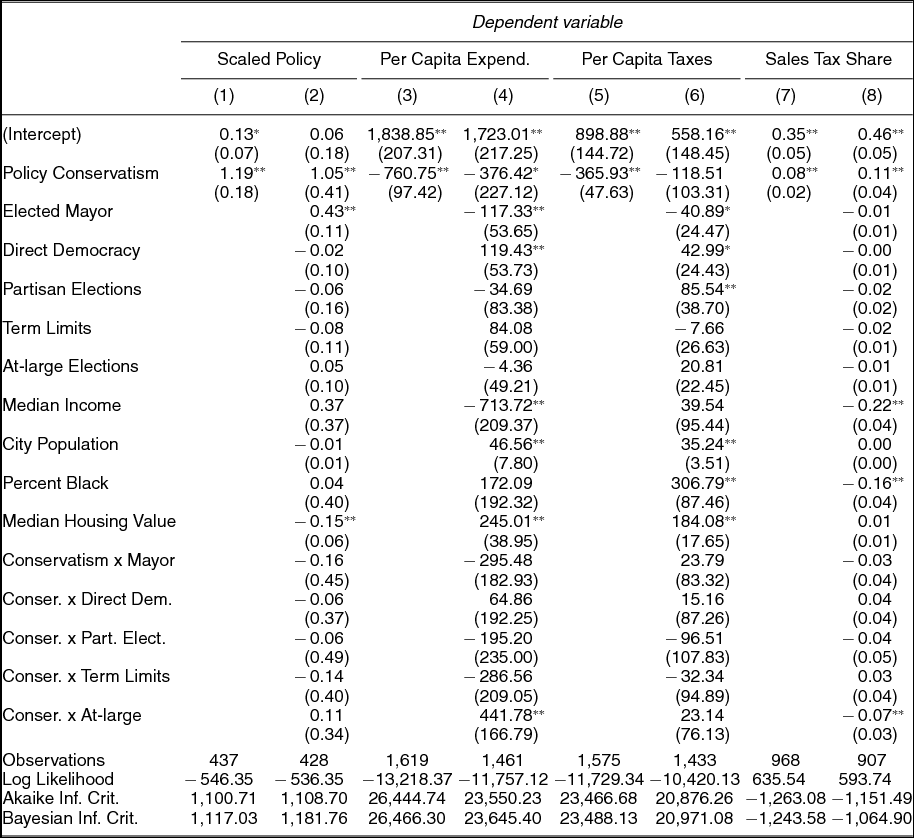
In order to account for these possibilities, we run a multilevel regression model that includes possible confounders, such as the size, wealth, and ethnic diversity levels of each city (Table 2). Controlling for other factors that influence city policy outcomes leaves the core relationships that we find in our bivariate analysis relatively unchanged. City policy conservatism has a robust, statistically significant, and substantively important relationship with the type of policy that cities implement. These relationships are similar in models that account for possible confounders.
Association Between City Liberalism and Policy Outcomes

**p < 0.05; *p < 0.1.
In order to understand the substantive significance of these effects, it is important to consider the scale of the outcome policies under examination. How strong should we expect these relationships to be if democracy is very strong? One way to look at this question is to examine the size of the “errors” from our model for each policy outcome. Figure 4 shows the estimated distribution of errors from a Bayesian implementation of our multilevel model with uninformative priors. These histograms represent the estimated posterior distribution of the residuals for the model—in other words, the distribution of differences from the predictions of the model and the observed outcome variables. The median error in predicting our policy scale is 0.54 standard deviations. The median error in the predicted share of taxes from sales tax is just 12%. The median error for taxes per capita is only 195 dollars, and the median error for expenditures is 392 dollars. How should these errors be interpreted? Quite simply, they suggest that citizens could expect their per capita tax levy to be within 195 dollars of the taxes in similar cities with the same political preferences. In substantive terms, the relationship between preferences and outcomes is tight. This suggests that city governments are responsive to the preferences of their citizens.
Error Distribution of Responsiveness Residuals

DO INSTITUTIONS AFFECT RESPONSIVENESS IN CITIES?
Next, we examine our hypotheses about the impact of city institutions on responsiveness to public opinion. Table 3 shows the results of a simple multilevel regression with random effects for states. The key variables are the interactions between city conservatism and each institution. These interactions measure whether each institution is making cities more responsive to the preferences of their citizens. Our approach to estimating responsiveness rests on a simple premise: that the differences in responsiveness should produce differences in the slope of the relationship between policy preferences and policy outcomes. Greater slopes indicate greater responsiveness (Lax and Phillips Reference Lax and Phillips2012). However, due to the fact that the policy preferences measures and policy outcomes measures are not in the same space, higher slopes do not necessarily imply greater congruence or proximity between the preferences of citizens and city policy conservatism (Achen Reference Achen1977 Reference Achen1978; Matsusaka Reference Matsusaka2001). Instead, greater slopes could indicate overreactions to constituent preferences (Erikson, Wright, and McIver Reference Erikson, Wright and McIver1993, 93–4).Footnote 13 As a result, we will not be able to assess the degree to which any given city policy is a good match for the preferences of the citizens of that city. We also cannot say for certain whether an increase in slope is normatively good for representation. It could be that a particular institution causes an increase in responsiveness, but this increase in responsiveness reflects an overreaction to constituent preferences.
Effect of Institutions on Responsiveness

**p < 0.05; *p < 0.1.
Across all five institutions, we find no consistent statistically significant interactive effect between institutions and policy conservatism. Only two of these 20 coefficients are significant. We have few a priori reasons to suspect that these effects should vary over different policy outcomes. This suggests that institutions are having little effect on representation in municipal governments.Footnote 14
Next, we examine the results of our analysis of the impact of institutions on representation using data that is preprocessed using entropy balancing (Hainmueller Reference Hainmueller2012). For each institution, the unit weights are calibrated to ensure balance on all covariates. In our main text, we present nonparametric results graphically where sets of points are color coded, grey for cities with in one institutional condition, and black for cities in the other. In Appendix D, we show parametric results using the preprocessed data with fixed effects for each state.
Figures 5–9 show the results of this analysis. Each of the four panels has as its y axis the same four policy outcomes from Figure 2. Each plot shows a loess curve fitted to the resulting scatter plots of the matched data, with a separate curve for each institutional condition. The scatter plots for the relationship between each city policy outcome and mean city policy preferences are shown. For each institutional condition, a loess curve is drawn through the corresponding points, weighted to balance institutional conditions with unequal numbers of matches.Footnote 15
Type of Government

A few preliminary observations are in order. First, the number of points in the top left panel is much smaller than the number of points in the other panels due to the relatively small number of cities that respond to the ICMA policy survey. As a result, there is a tendency for the curves in this panel to be the most different from each other due to random error. Likewise, within each panel, the curves are likely to differ most due to random error where the data is sparse, such as at the far right and far left of the graph.
Figure 5 shows the results of the matching analysis for the type of government: mayoral or council-manager. Cities with elected mayors are drawn in black, and cities with city managers are drawn in grey, as are the corresponding loess curves. Figure 5 shows a remarkable lack of difference between the curves across three of the four policy outcomes. The policy scale in the upper-left panel is the only outcome that shows any difference between cities with elected mayors and council-manager systems. Here, the black line is above the grey line, indicating that policy is slightly more conservative on average in cities with mayors. This is a statistically significant difference. However, this relationship does not hold up in the other analyses, and it does not indicate a difference in responsiveness per se. Other apparent differences, such as the far left side of the top right panel with expenditures as the dependent variable, are supported by very few data points. Overall, the responsiveness curves for mayor and council-manager cities are practically indistinguishable for per capita taxes, per capita expenditures, and the percentage of city revenues that come from sales taxes. Thus, our results provide little evidence for H2, our hypothesis that cities with directly elected mayors are more responsive. City manager systems, designed to be more professional and less political, appear to be just as responsive to public opinion as their mayoral counterparts. Given the same set of public policy preferences, a city with a mayor looks almost exactly the same as a city with a city manager for most policy outcomes.
This pattern of little institutional difference is continued in Figure 6, where cities with partisan elections are shown in black. The responsiveness curves are again very similar. Cities with partisan elections and cities without partisan elections appear to have roughly the same level of responsiveness. Differences in the curves are too small to attribute to systematic differences across institutions. Thus, we cannot conclude that whether cities have partisan or nonpartisan elections has an impact on the link between public opinion and public policy outcomes.
Partisan Elections

Figure 7 shows the results for cities with (in black) and without (in grey) a popular initiative process. The overarching patterns are the same as for previous institutions. Across most of the support of the data, the estimated relationship between cities’ policy conservatism and their policy outcomes is nearly identical for cities with and without direct democracy. Overall, it appears to be the case that public views are about as well represented in cities where citizens are not able to vote on legislation at the ballot box as cities where they are.
Direct Democracy

Figure 8 shows the result of the matching analysis in the case of city council term limits. Cities with term limits are shown in black. Once again, the curves for cities with and without term limits are close to identical over most of the support of the data for each policy outcome. In this case the curves are particularly close, even at the extremes of the data. Overall, our findings provide no support for H5, that term limits lead to greater responsiveness.
Term Limits

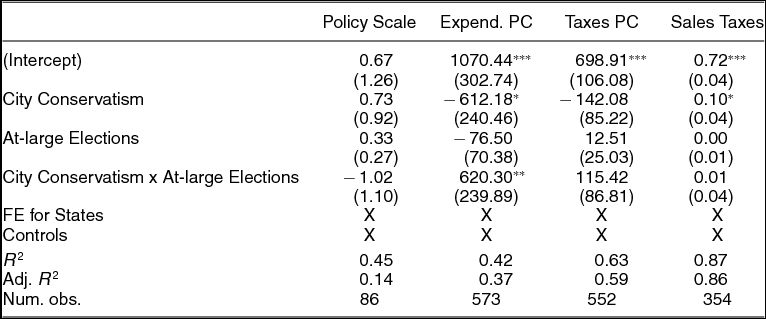
Finally, Figure 9 shows the results of the matching analysis for cities with and without at-large districts. Cities with all at-large elections are shown in black, and cities with single-member districts are shown in grey. As with the other institutional conditions, there is little evidence of consistent variation in responsiveness across policy outcomes. The only notable results are that, contrary to H6, the slope of the relationship between citizens’ policy preferences and the share of taxes cities derive from sales taxes is different in at-large than district-based cities. In this case, cities with at-large elections are somewhat less responsive to their citizens’ policy preferences. But this difference in responsiveness is relatively small. There is also no difference in the relationship between public opinion and city policy conservatism in cities with and without at-large elections for our other three policy outcomes. Therefore, overall, our findings provide no support for H6, that at-large districts lead to better representation.
At-Large Elections

Across five different policy outcomes, we find no evidence that any institution consistently affects representation in municipal government. These institutions, however, exist under conditions that are different from when many of them were formulated. Although the literature on representation in cities has emphasized their role in changing the politics of local government and breaking party monopolies, their influence on systematic representation today has been underexplored. Despite much attention to these institutions, whatever effect that they might have on policy responsiveness is too small for us to detect. Progressive reformers may not have been too surprised to learn that these institutions are not as influential today as they may have been in the past. After all, the party machines that these policies were designed to mitigate are long gone.
CONCLUSION
A 2002 piece in the Annual Review of Political Science summarized the literature on municipal politics by stating that, “Politics has not always fared well in the political science literature on the cities, at least not in the United States” (Murphy Reference Murphy2002). In contrast to much of this literature, we find that a broad array of city policy outcomes are not apolitical, nor are they divorced from national political schisms.Footnote 16 Policy outcomes in city and town governments can be predicted by the policy conservatism of their citizens. “Liberal” cities seem to get “liberal” policies and “conservative” cities seem to get “conservative” policies on average, controlling for other factors that might account for policy differences. This suggests that not only is city government political, but that it may have more in common with state and national politics than previous scholars have recognized.
However, unlike at the state and national level, we find scant evidence that differences in municipal political institutions affect representation. Neither the choice of mayor versus city council government, partisan or nonpartisan elections, the availability of ballot measures, whether or not elected officials face term limits, or whether there are at-large or districted elections seem to affect the strength of the relationship between public policy preferences and city policies. This is contrary to hypotheses based on evidence from the existing literature, both from within the city politics literature and from scholarship on states and nations. While we are hesitant to put too sharp of a point on a null result, the similarity between responsiveness in different institutions is striking across different policy outcomes, even when we allow this relationship to have a very general functional form. Considering the emphasis in the literature on the importance of these institutions, the fact that we find few differences in responsiveness across institutions is striking.
Our results suggest that the effects of institutions on democratic representation may have been overstated by previous studies. But it is difficult to evaluate the extent to which our results are generalizable to other contexts. Part of the difficulty in generalizing these effects is establishing the categories that they should be applied to. Even within the category of local governments, there are many different types besides municipal governments: there are school districts, counties, utility districts, and many more. Cities themselves have scopes of authority and responsibility that differ widely (Oliver, Ha, and Callen Reference Oliver, Ha and Callen2012), a fact that we have dealt with here merely by controlling for the size of populations and economies. A further complication is that the institutions of different levels of government may interact. Many of the institutions we have examined, however, share important features of state and national governments. Council manger governments share many features with parliamentary government and mayoral government is quite similar to a presidential system. Term limits have been implemented at all levels of government. The salience, prominence or even legality of party labels may vary at different levels of government. Moreover, direct democracy provisions such as popular initiatives and referenda have been used at all levels of government. Future work should seek to incorporate these institutional differences into their theories in order to examine the degree to which the effect of institutions varies across different levels of government. For instance, scholars could attempt to explain why institutions such as direct democracy and term limits appear to have a greater effect on representation at the state level than at the municipal level.
Future research should also explore the impact of other institutions in city government on representation. For instance, it might explore whether variation between concurrent and off-cycle elections affects the relationship between public opinion and policy outcomes (Anzia Reference Anzia2011). Finally, research in this area could benefit from examining a broader range of city policy outcomes, such as distributional and land development policies. This will enable scholars to determine whether the relationship between public opinion and policy varies across different issue areas.
A A. CITY POLICY PREFERENCES: DESCRIPTION & VALIDATION
We estimate municipal policy preferences by combining our large dataset of citizens’ ideal points with a multilevel regression and poststratification (MRP) model (Lax and Phillips Reference Lax and Phillips2009; Park, Gelman, and Bafumi Reference Park, Gelman and Bafumi2004). This approach employs Bayesian statistics and multilevel modeling to incorporate information about respondents’ demographics and geography in order to estimate the public opinion of each geographic subunit. One way of thinking about an MRP model is to compare it to a weighted survey estimate that applies very finely tuned weightings, based on Census data, of specific demographic-geographic types. It estimates each individual’s response as a function of both demographic and geographic predictors. MRP models have been found to produce very accurate estimates of public opinion by state and congressional district with national samples of just a few thousand respondents (Lax and Phillips Reference Lax and Phillips2009; Park, Gelman, and Bafumi Reference Park, Gelman and Bafumi2004; Warshaw and Rodden Reference Warshaw and Rodden2012).
There are two stages to the MRP model. In the first stage, we estimate each individual’s opinion on a given issue as a function of his or her demographics, city, and state (for individual i, with indexes r, g, e, c, s, and z for race, gender, education category, city, state, and region, respectively). We incorporate this information using the following hierarchical model for respondent’s responses:
 \begin{eqnarray}
\eqcellsep\eqcellsep y _{i} = \gamma _{0}+ \alpha _{r[i]}^{race}+ \alpha _{g[i]}^{gender}+\alpha _{e[i]}^{edu} +\alpha _{c[i]}^{city} + \epsilon , \nonumber\\
\eqcellsep\eqcellsep {\rm where } \nonumber\\
\eqcellsep\eqcellsep\alpha _{r[i]}^{race} \quad{\rm for}\quad r = 1, . . . , 4,\nonumber \\
\eqcellsep\eqcellsep\alpha _{g[i]}^{gender} \quad {\rm for}\quad r = 1,2, \nonumber\\
\eqcellsep\eqcellsep\alpha _{e[i]}^{edu} \quad {\rm for}\quad e = 1, . . . , 5.
\end{eqnarray}
That is, each individual-level variable is modeled as drawn from a normal distribution with mean zero and some estimated variance. Following previous work using MRP, we assume that the effect of demographic factors do not vary geographically. We allow geography to enter into the model by adding a city level to the model, and giving each city a separate intercept.
The city effects are modeled as a function of the state into which the city falls, the city’s average income, the percentage of the city’s residents that are military veterans, and the percentage of couples in each city that are in same-sex couples. The state effects, in turn, are modeled as a function of the region into which the state falls, the percentage of the state’s residents that are union members, and the state’s percentage of evangelical or Mormon residents. Finally, the region variable is another modeled effect. We group states into regions based on their general ideology and vote in presidential elections.
The second stage is poststratification. In this stage, we use the multilevel regression to make a prediction of public opinion in each demographic-geographic subtype. The estimates for each respondent demographic geographic type are then weighted by the percentages of each type in the actual city populations. Finally, these predictions are summed to produce an estimate of public opinion in each city.
Validation of City Policy Preferences
In this section, we use a number of complementary approaches to validate our estimates of city policy preferences. First, we demonstrate the face validity of our estimates by showing our estimates for all large cities in the country, as well as a subset of cities in four states. Next, we show the internal validity of our estimates by comparing them with raw, disaggregated estimates of the policy preferences in each city based on our sample of 275,000 Americans. Finally, we use two separate approaches to demonstrate the external validity of our estimates. We show that our estimates are highly correlated with city-level presidential vote shares in both 2004 and 2008. We also show that our estimates are highly correlated with estimates of symbolic ideology from survey samples collected by the Knight Foundation in 26 medium and large cities in 2002.
Face Validity
In order to demonstrate the face validity of our estimates of city conservatism, Figure 1 shows the policy preferences of the 51 cities with a population larger than 250,000 people. We find significant variation in the policy preferences of cities. Not surprisingly, we find that San Francisco, Washington, DC, and Seattle are three of the most liberal cities in the country. Mesa, AZ, Oklahoma City, OK, and Virginia Beach, VA are three of the most conservative cities.
Figure 10 shows the mass public’s policy preferences for cities in Texas, Virginia, Michigan, and Massachusetts with more than 75,000 people. The upper-left panel shows the policy preferences of cities in Texas. As one would expect, Austin is the most liberal city. Other large, racially diverse cities, such as Dallas and Houston, are also quite liberal. On the other end of the spectrum, Plano and Amarillo are two of the most conservative cities.
Mean Policy Conservatism of Cities in Four States

The upper-right panel shows the policy preferences of cities in Virginia. It shows that heavily African-American Richmond is the most liberal city in the state, closely followed by the Northern Virginia cities of Arlington and Alexandria. In contrast, the most conservative cities, such as Virginia Beach and Chesapeake, are concentrated in southern Virginia near the Newport News Naval Base.
The lower-left panel shows the policy preferences of cities in Michigan. Detroit and Ann Arbor are far and away the most liberal cities. Sterling Heights, Livonia, and Warren are the three most conservative cities. Finally, the lower-right panel shows the policy preferences of cities in Massachusetts. Liberal communities in the greater Boston area, such as Cambridge, Boston, Newton, and Somerville, are the most liberal cities in the state. While no cities in Massachusetts are to the right of the national mean, Lowell and New Bedford are two of the more conservative cities.
Internal Validity
Next, we examine the relationship between our MRP-based estimates of city conservatism and the raw, disaggregated estimates of the mean policy conservatism in each city from our sample of 275,000 survey respondents. The top panel of Figure 11 shows that there is a very strong relationship between our MRP-based estimates of city conservatism and the raw, disaggregated estimates of the mean policy conservatism in each city (r = .88). Of course, the disaggregated estimates are plagued by significant measurement error in cities with small samples, which is the reason that we use MRP to improve our estimates of the mass public’s preferences in each city. Thus, the bottom panel only looks at cities with more than 100,000 people. In these cities, there is a .98 correlation between the MRP and disaggregated estimates of city conservatism.
Relationship between MRP and Disaggregated City Policy Conservatism

External Validity
Next, we examine the external validity of our estimates by comparing them to several alternative measures of city conservatism. One approach commonly employed in previous studies is to use presidential vote share as a proxy for the ideology of geographic units (e.g., Canes-Wrone, Brady, and Cogan Reference Canes-Wrone, Brady and Cogan2002; Erikson and Wright Reference Erikson and Wright1980). The advantage of this approach is that it is explicitly based on electoral behavior and it is available across most cities.
First, we examine the association between our estimates of city conservatism and 2008 presidential vote shares. We estimate 2008 presidential vote share in each city based on precinct-level election returns (Harvard Election Data Archive 2012).Footnote 17 The top panel of Figure 12 shows that there is a strong relationship between presidential vote share and our estimates of city conservatism. Overall, our estimates of city policy conservatism are correlated with presidential vote share in the 2008 election at .77. Moreover, there appear to be relatively few outlier cities. This suggests that our estimates are accurately capturing cities’ policy preferences on a left-right continuum.
Relationship between City Policy Conservatism and Presidential Vote Share

To further validate our estimates, we compare them with estimates of presidential vote shares from the 2004 election that the Bay Area Center for Voting Research compiled for cities with a population greater than 100,000 according to the 2000 Census. According to the study’s documentation, the researchers obtained information for the applicable cities located within each state by contacting the city recorder, city clerk, or other designated city official. In many instances, it was the recorder of the county in which that city was located that held the information by precinct. The votes were tabulated by combining the voting returns from all of the precincts located in a particular city. The lower panel of Figure 12 shows the results. Overall, there is a correlation of .85 between our estimates of city conservatism and presidential vote shares in 2004.
Of course, presidential vote shares are not a perfect proxy for ideology (Kernell Reference Kernell2009) . Presidential vote shares in any given election may be largely the product of short-term forces (Levendusky, Pope, and Jackman Reference Levendusky, Pope and Jackman2008). In addition, even if short-term forces could be removed, the medians of district preferences can only be ranked ordinally based on presidential vote share if researchers are willing to assume equal variance across districts (Kernell Reference Kernell2009). Thus, as a further validation of our estimates, we compare them with a high quality survey-based measure of city ideology (Palus Reference Palus2010).
In 2002, the John S. and James L. Knight Foundation commissioned a survey of 26 communities in which Knight-Ridder newspapers were located. In these surveys, it asked citizens for their symbolic ideology on a five-point scale. There are between 138 and 736 respondents in the core city of each community.Footnote 18 We use these samples to estimate the mean self-identified ideology for the Knight-Ridder cities. The top panel of Figure 13 shows the relationship between our estimates of city conservatism and the estimates of ideology from the Knight-Ridder survey. Overall, there is a correlation of .73 between our estimates and the estimates of ideology from the Knight-Ridder survey.
Relationship between City Policy Conservatism and External Metric of City Conservatism

Summary
Overall, this appendix has shown that our estimates of city policy conservatism are both internally and externally valid. They are highly correlated with the raw, disaggregated measures of city policy preferences from our survey data. They are also highly correlated with several external metrics of city conservatism, including both presidential vote shares and a survey-based measure of city ideology.
B B. DIMENSIONALITY OF CITY POLICY PREFERENCES
The central claim of our article is that municipal policy actions are related to citizen policy preferences. However, understanding what these policy preferences consist of is itself an important research question. In particular, scholars of municipal politics have often highlighted the fact that cities consider issues that are different from the sorts of policy issues that are considered at the federal level (Oliver, Ha, and Callen Reference Oliver, Ha and Callen2012). At the same time, the municipal level is not entirely different from the federal level: there is issue overlap, the political parties are the same, and citizens tend to have low levels of information on average about the specifics of municipal policy. As a result, citizens may or may not think about city policy differently than they think about federal policy. The policy preferences they bring to bear in deciding who to choose for mayor or city councilor may or may not be quite different than the policy preferences they bring to bear in deciding who they should support for president or senator.
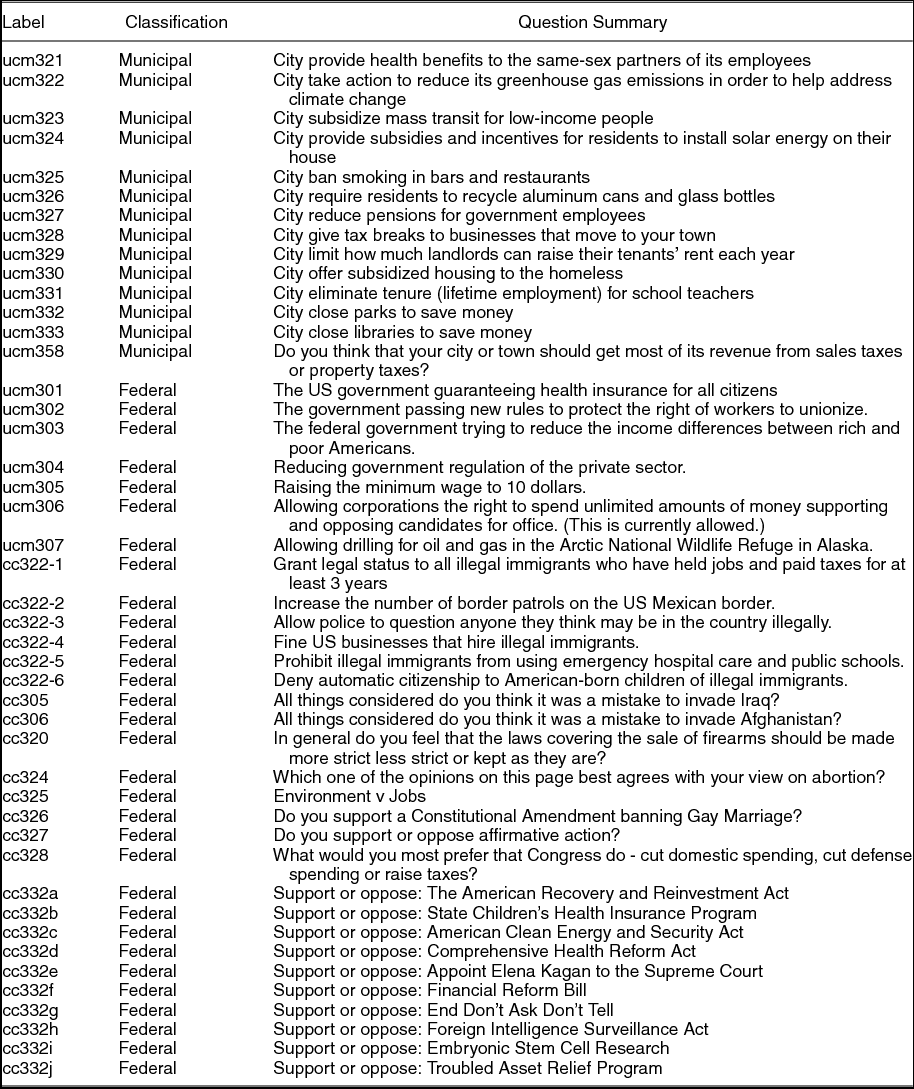
In order to examine the structure of preferences over municipal and federal policy, we asked a battery of federal policy questions and a battery of questions that was oriented towards state and local politics on the 2012 Cooperative Congressional Election Study. Fourteen questions were asked about local politics, and 31 questions were asked about federal politics, some of which we devised, and others of which were part of the “common content” questions asked on all surveys in the CCES. Table 4 shows the set of questions that will be used in this analysis.
Survey Questions used for Scaling City and Federal Preferences

In order to examine the degree to which preferences on municipal and federal policy issues are related, we take two approaches. The simpler approach is to create two separate preferences scales from the federal items and the municipal items, respectively, using a one-dimensional two-parameter logistic item response theory model for each scaling, and regress the scores on one scale on the scores from the other. This analysis shows the degree to which the choice of question set affects the result of the scaling. Our preferred, but more complex, approach is to scale all of the questions in a higher dimensional item response model. This model determines the extent to which the individual choices can be better explained by creating distinct preference dimensions for municipal policy items and federal policy items.
Figure 14 shows the results of the first analysis. For each individual, the x axis represents that individual’s position on the policy scale created using only the federal policy items and the y axis represents that individual’s position on the scale that uses only municipal items. There are very few points in the top left and bottom right of the graph, indicating that people who are municipal liberals and federal conservatives, or vice versa, are very rare. Overall the relationship between these two scales is quite strong, with a correlation of .75. However, there is considerable error. This is not unexpected, because there is measurement error in each scale individually. In particular, there are fewer items in the municipal policy scale, and as we will see shortly, these items are noisier than the federal policy items on average.
Correlations between Municipal and Federal Scales

For our second analysis, we run a four-dimensional model pooling all of the federal and municipal items. Our expectation is that if municipal items are determined by a logic different from federal items, then the model will attempt to explain these responses by assigning municipal items and federal items to distinct dimensions. We choose four dimensions to avoid the possibility that higher dimensionality within the federal or municipal items will obfuscate differences between them.
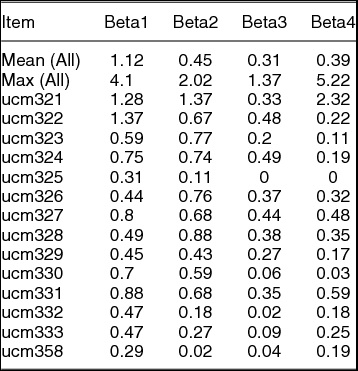
Table 5 shows the results. In particular, we report the absolute values of the discrimination parameters (Beta) of the municipal policy items, and the averages and maximum values for all of the items. The discrimination parameters indicate the degree to which particular items are informative with respect to respondent positions on particular policy dimensions. As expected, the first dimension has the highest discrimination, with much lower discrimination for higher dimensions. For each dimension, the highest discriminating item is always a federal policy item. In most cases, the municipal policy items have lower average discrimination, except for the second dimension, on which the municipal items are just slightly more discriminating (an average of .58 versus .45). We can find no evidence that any dimension is characterized by higher discrimination for municipal policy items than other items.
Item Parameters

On balance, Table 5 shows variation in the discrimination of particular policy items, but no evidence that separate forces are at work in determining citizens’ positions on municipal policy questions and federal policy questions. Two questions that stand out for high discrimination are question 321, about benefits for same-sex partners who are municipal employees, and 322, about whether or not the city should take action to reduce greenhouse gas emissions. We might suppose that these questions are less noisy precisely because they are linked to high profile federal and state policy issues. In contrast, some issues that seem uniquely local, such as 332 and 333, about closing parks and libraries, or 358, about the proper mix of sales and property taxes, are particularly noisy on all dimensions. This finding is consistent with the belief in the literature that citizens are poorly informed about matters of local policy. This may help explain why the residuals in Figure 14 can be large.
Overall, for this set of questions, it looks like questions of municipal policy are determined by the same underlying values, attitudes and predispositions as questions of federal policy. But the qualifier “for this set of questions” is an important one. Our survey is one of the first that we know of to ask a national sample a battery of questions about local policy. Our choices of questions were rather arbitrary, biasing towards policies that we ourselves are familiar with. Future research should explore the extent to which we have captured the “key issues” or local policy. For instance, Oliver, Ha, and Callen (Reference Oliver, Ha and Callen2012) suggests that land-use policy is one of the dominant items on the agenda in local politics, and yet we have not asked any questions about land-use policy. If citizens have preferences about, say, zoning and eminent domain that are strongly held and distinct from their preferences over federal policies, the current analysis would not capture this distinction.
C C. QUESTIONS USED TO ESTIMATE CITY POLICY SCALE
Table 6 below lists the questions asked on the 2010 International City/County Management Association sustainability survey that were used to create our index of the overall conservatism of city policy. Each set of items is preceded by a prompt such as “Please indicate which of the following actions your locality has taken related to sustainability, energy conservation, resilience, climate change, emissions reductions, or similar concerns in your community” or “Please indicate which of the following programs your local government has.” If the government implements a policy, that item is coded as 1, otherwise it is coded as 0.
ICMA Items that Went Into Our Scale of City Policies

D D. DESCRIPTION OF ENTROPY BALANCING ANALYSIS
Our main analysis uses entropy balancing to ensure balance across our treatment and control conditions (Hainmueller Reference Hainmueller2012). Entropy balancing matching applies a maximum entropy reweighting scheme that calibrates unit weights so that the reweighted treatment and control group satisfy a potentially large set of prespecified balance conditions that incorporate information about known sample moments. In our analysis, for each institutional hypothesis, we balance our covariates first moments for cities with one institution, and cities with the other. The “control” group may then be compared to the “treatment” group. This enables us to simply compare the slope of the relationship between outcomes and policy preferences for the two groups. We balance on median income, median home values, population, the presence of each institution, and city conservatism.
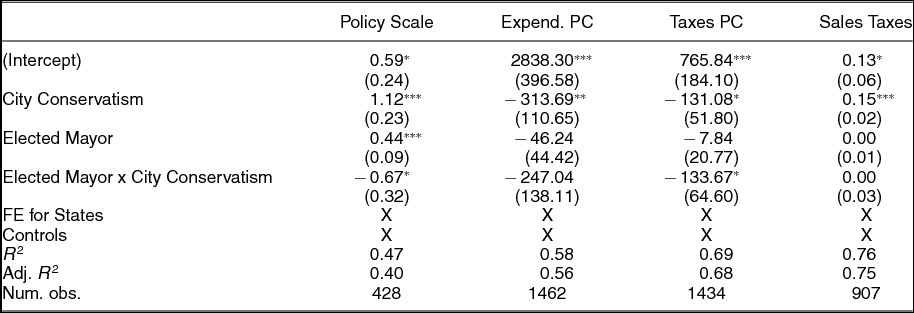
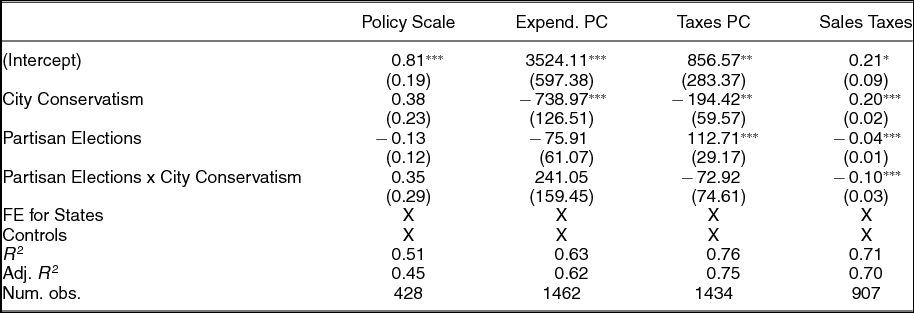
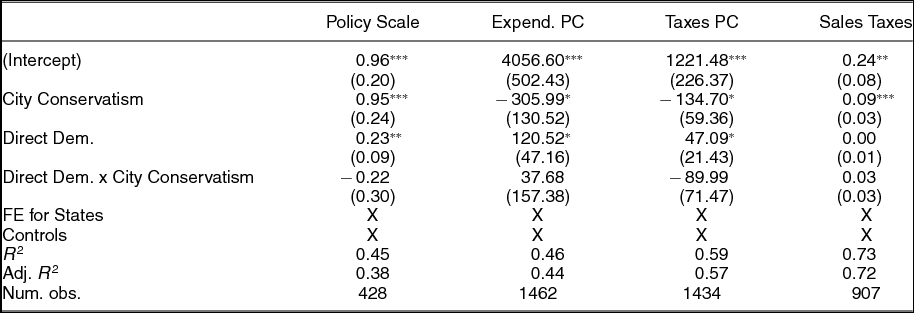
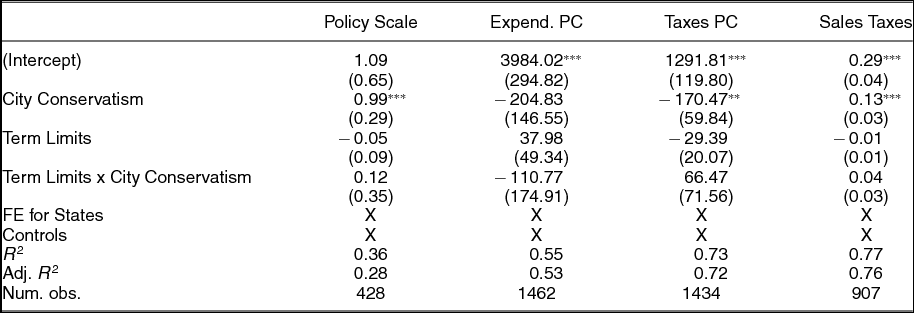
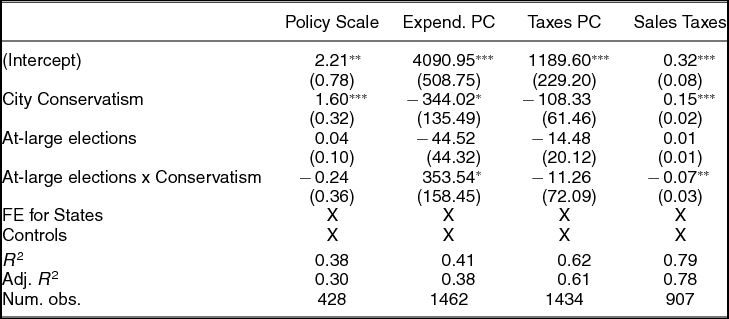
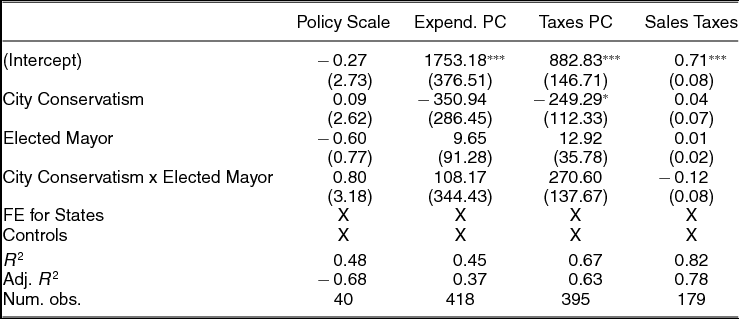
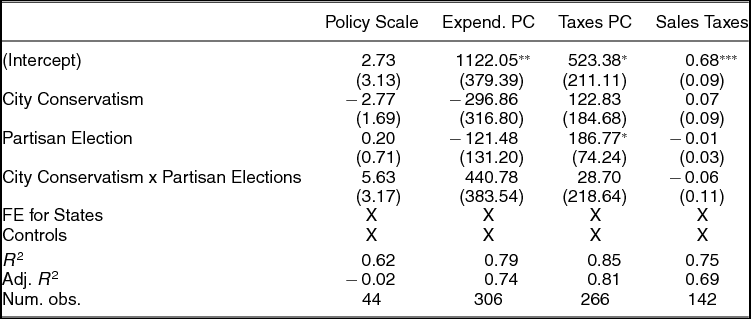
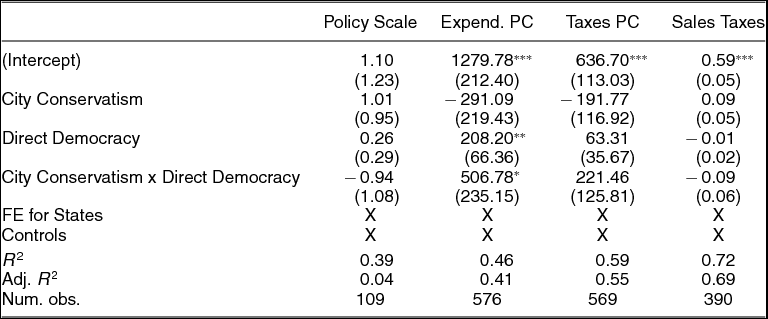
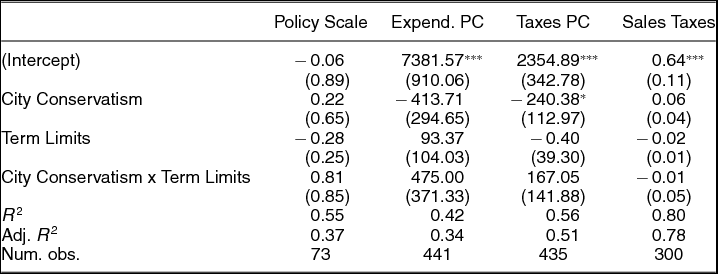
In addition to the loess curves in the main body of the text, we also test for significance in these results using a simple linear models. Tables 7–11 show the results of these models. The models are regressions of each policy outcome on city conservatism, the institution in question, and their interaction, with state fixed effects. In no case is the institutional interaction consistently significant across policy outcomes.
Elected Mayor: Entropy Balancing

Partisan Elections: Entropy Balancing

Direct Dem: Entropy Balancing

Term Limits: Entropy Balancing

At-large elections: Entropy Balancing

E E. INSTITUTIONAL RESULTS USING COARSENED EXACT MATCHING
In this appendix, we validate our institutional results using an alternative matching method, and use a linear model to show that the results from the main text are rarely significant. Our findings regarding institutions are all null, so by definition they are not robust. However, we wish to show these null results are not the result of choosing a particular matching method.
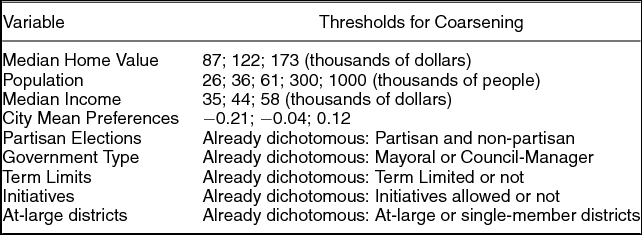
In the body of the article we used entropy balancing as a matching method to examine the effect of different institutions on municipal accountability. We validate our results here using coarsened exact matching. Coarsened exact matching proceeds by establishing categories for the matching variables, and then dropping all observations in either institutional condition that do not have an exact match in all categories for the other condition. Variables are coarsened by assigning continuous values to a small number of categories for each variable. These categories are defined by a set of thresholds. Cities sharing the same category for some variable are considered “equivalent” for the purposes of the analysis. It is assumed that these cities are substantively similar. Each observation in one condition (treatment or control) is then weighted to reflect any imbalances in the number of treatment and control observations in one strata, a set of observations that have the same values for the coarsened variables. Each matching analysis is performed using all of the variables in Table 12 below, with the exception that the institutional “treatments” are not included in the matching analyses that involve that institution. So, for instance, in the analysis of partisan versus nonpartisan elections, cities are not matched on this institution.
Matching Variables

Figures 15–19 show the results using coarsened exact matching. These graphs correspond to Figures 5–9, respectively, which use entropy balancing. The most notable differences between these sets of figures is the number of data points, and the variation in the slopes of the loess curves. Where entropy balancing creates weights for each data point, coarsened exact matching first drops data point without a corresponding exact match, then weights the remaining data so the treatment and control have equally weighted observations in each cell. Unfortunately, the set of covariates above creates a large number of cells, leading to many dropped data points. The results of these figures should be interpreted with this in mind.
Type of Government

Partisan Elections

Direct Democracy

Term Limits

At-Large Elections

In addition to using coarsened exact matching to validate our results, we also test for significance in these results using a simple linear model in lieu of loess curves. Tables 13–17 show the results of these models. The models are regressions of each policy outcome on city conservatism, the institution in question, and their interaction, controlling for state fixed effects. In no case is the institutional interaction significant. However, this information is not very useful in cases with very few exact matches. In particular, there are often very few cases when the dependent variable is the general policy scale. In the case of elected mayors versus council-manager systems, there are too few observations to run this model.
Statistical Models

Partisan Elections: CEM

Direct Democracy: CEM

Term Limits: CEM

At-large Elections: CEM












Comments
No Comments have been published for this article.