INTRODUCTION
First and second language learners align semantic and grammatical roles and align the subject argument with preverbal position in both language processing (Slobin, Reference Slobin1966; Slobin & Bever, Reference Slobin and Bever1982; Stromswold, Reference Stromswold2006; VanPatten, Reference VanPatten, VanPatten and Williams2007) and production (Borer & Wexler, Reference Borer, Wexler, Roeper and Williams1987; Hyams, Ntelitheos, & Manorohanta, Reference Hyams, Ntelitheos and Manorohanta2006; Pienneman, Reference Pienneman1998, Reference Pienneman, VanPatten and Williams2007; Pierce, Reference Pierce1992). Language input provides positive evidence for such an alignment in terms of the frequency of simple, active, declarative S(ubject) – V(erb) – O(bject) sentences (Bever, Reference Bever and Hayes1970; Berman & Slobin, Reference Berman and Slobin1994; MacWhinney & Bates, Reference MacWhinney and Bates1989; Pienneman, Reference Pienneman1998; VanPatten, Reference VanPatten1996). The starting point of the second language acquisition of the Spanish ser “be” passive is that L2 learners align the semantic role of agent with the grammatical role of subject, and they also align the subject argument with preverbal position (Lee, Reference Lee2017; Wang, Reference Wang2010). They, therefore, misinterpret sentence meaning.
The present study examines the acquisition of the Spanish ser passive using eye-tracking methodology to examine learners’ cognitive processing behaviors before and after they receive Processing Instruction (PI). We also address the effects of instruction by examining changes in pretest to posttest accuracy scores so that we link our findings to that of other PI research in general but on the Spanish passive in particular (Lee, Reference Lee, Benati, Laval and Arche2014a, Reference Lee, Benati, Laval and Arche2014b, Reference Lee2015). We examine whether PI also brings about changes in cognitive processing behaviors during the processing of the linguistic input. And, we examine whether L2 learners’ cognitive processing behaviors become more nativelike after they receive PI.
BACKGROUND AND MOTIVATION
PROCESSING INSTRUCTION AND NONCANONICAL WORD ORDER
VanPatten (Reference VanPatten1996, Reference VanPatten and VanPatten2004, Reference VanPatten, VanPatten and Williams2007) identified that noncanonical word orders presented L2 learners a processing problem. Because they use canonical word order as a processing strategy, learners misinterpret meaning. He developed an intervention, PI, to teach learners a target-language–appropriate processing strategy (VanPatten, Reference VanPatten1996). He first applied it empirically to a Spanish word order–based processing problem (VanPatten & Cadierno, Reference VanPatten and Cadierno1993; VanPatten & Oikennon, Reference VanPatten and Oikennon1996). Subsequent PI research has proven it to effectively develop in L2 learners a target-language–appropriate processing strategy to replace, or severely decrease, their reliance on canonical word order to interpret sentences that represent noncanonical, late-acquired word orders. PI has been shown to be effective across various second languages and linguistic structures such as English passives (e.g., Uludag & VanPatten, Reference Uludag and VanPatten2012), French causatives (e.g., VanPatten & Wong, Reference VanPatten, Wong and VanPatten2004); German case-marked articles (e.g., Culman, Henry, & VanPatten, Reference Culman, Henry and VanPatten2009), Japanese passive (e.g., Benati & Lee, Reference Benati and Lee2010; Hikima, Reference Hikima2011), Russian case-marked nouns (VanPatten, Callopy, Price, Borst, & Qualin, Reference VanPatten, Collopy, Price, Borst and Qualin2013), and Spanish passives (Lee, Reference Lee, Benati, Laval and Arche2014a, Reference Lee, Benati, Laval and Arche2014b, Reference Lee2015).
We first focus on the research on the effects of PI on passive constructions; all results show positive effects of PI on accuracy scores. Qin (Reference Qin2008) compared the effects of structured input practice (PI) to text reconstruction or dictogloss practice (DG) on the acquisition of English passive as measured by interpretation and production tests using a pretest/treatment/immediate posttest/delayed posttest design. The participants were native speakers of Chinese, enrolled in grade 7 in China, and aged 13 to 15. Explanation across the two groups was constant. Qin’s results showed that the PI group performed significantly better than the DG group on the immediate interpretation posttest, and as well as the DG group on the immediate production posttest. One month later, the two groups’ scores showed no significant differences on either the interpretation or production delayed posttests. Both groups’ delayed posttest scores were significantly higher than their pretest scores.
Uludag and VanPatten (Reference Uludag and VanPatten2012) also investigated the effects of PI and DG on the acquisition of the English passive as measured by interpretation, sentence-level production, and text reconstruction tasks using a pretest/treatment/immediate posttest/delayed posttest design. The participants were adult native speakers of Turkish enrolled in a pre-intermediate–level professional English language class at a Turkish university and had not studied the passive in the curriculum. Uludag and VanPatten found that the PI group performed significantly better than the DG group on the two interpretation posttests (immediate and delayed). The DG group outperformed the control group on the delayed interpretation posttest but not on the immediate posttest. The PI and DG groups performed equally well on the immediate and delayed sentence production and text reconstruction posttests. Both groups outperformed the control group.
Benati and Lee (Reference Benati and Lee2010) and Hikima (Reference Hikima2011) examined the effects of PI on the acquisition of Japanese passive as measured by sentence-level interpretation, sentence-level production, and two discourse-level interpretation tasks using a pretest/treatment/immediate posttest design. The grammatical subject, agent, and verb are marked in Japanese passives. The participants were native speakers of English, enrolled in intermediate-level university Japanese language classes in the United Kingdom. The PI group’s scores significantly improved from pretest to posttest on all four assessment tasks. The control group’s scores did not improve.
Lee (Reference Lee, Benati, Laval and Arche2014b, Reference Lee2015) examined the effects of PI on the acquisition of Spanish passive as measured by a sentence-level listening-based interpretation test using a pretest/treatment/immediate posttest/delayed posttest design. The participants were native speakers of English enrolled in intermediate-level university Spanish classes in Australia. The results indicated that both immediate and delayed posttest scores were significantly higher than the pretest scores although the delayed posttest scores were significantly lower than the immediate posttest scores. The study also determined that learning rate (the number of trials completed before correctly answering three target items in a row) significantly correlated with both the immediate and delayed posttest scores indicating that the learners who more quickly began to process correctly showed higher learning outcomes.
Lee (Reference Lee2015) conducted a follow-up investigation to determine if PI on the Spanish passive yielded transfer-of-training to two other word-order–based processing problems. The two other linguistic targets were accusative case pronouns in OproVS strings in an anaphoric reference context and gender-cued null subjects in a cataphoric reference context. The study used a sentence-level listening-based interpretation test in a pretest/treatment/immediate posttest/delayed posttest design. The results indicated that all learners benefitted from instruction on the passive to improve their interpretation of passive sentences. The PI group’s immediate and delayed posttest scores were significantly higher than the pretest scores, although the delayed posttest scores were significantly lower than the immediate posttest scores. The results for processing accusative case pronouns showed that only some of the participants transferred their training on processing passives and thereby improved on processing accusative case object pronouns. The results revealed significant improvement from pretest to immediate posttest and again from immediate to delayed posttest. The results for gender-cued null subjects showed that some of the participants transferred their training in processing passives and thereby improved on processing gender-cued null subjects. The results revealed significant improvement from pretest to immediate posttest and again from immediate to delayed posttest. There was no change in the control group’s scores for any of the three linguistic targets on either posttest.
This review of research on the effects of PI on the acquisition of passives supports the findings from PI on other linguistic targets. The effects of PI in general as well as specific to passives (a) are found in both interpretation and production tasks, (b) are correlated to how quickly learners begin to process correctly, and, (c) that some learners transfer instruction on one form to performance on different ones. The results from PI are consistent across different (a) L2s (English, Spanish, and Japanese), (b) L1s (Chinese, Turkish, and English), (c) interpretation tests (sentence-level, context sentence plus target sentence, and discourse-level stories and dialogues), and, (d) production tests (sentence-level and text reconstructions). The review demonstrates that the pillar of our approach to establishing the effects of PI is to compare accuracy scores. Recent PI research has broadened the scope of the methodology used to measure processing behaviors as well as to compare accuracy scores. Two recent studies have used eye tracking and accuracy to examine the effects of PI on word-order–based processing problems.
Wong and Ito (Reference Wong and Ito2017) examined the effects of instruction type (PI vs. traditional, or TI) and presence or absence of explicit information on the acquisition of French causative faire. They showed that the PI group improved significantly in accuracy after instruction (5% to 62%) whereas the TI group only improved from 4% to 11%. Their examination of eye movements showed that the critical part of the causative sentence is the last part in which the underlying agent who was caused to perform an action was located. They showed that the PI but not the TI group started to look to the correct image at this point. The PI group made relatively more fixations to the correct image than the TI group did especially after instruction. They also found that “PI groups in both experiments had a significantly smaller number of fixations to the incorrect picture before the end of the sentence, and there were overall fewer instances of incorrect looks to the ‘first-noun = agent’ picture in the last window [end of sentence] when participants received EI [explicit information]” (Wong & Ito, Reference Wong and Ito2017, p. 18), even though there was no significant effect for explicit information.
Issa and Morgan-Short (Reference Issa and Morgan-Short2018) expanded on their previous work (Issa, Morgan-Short, Villegas, & Raney, Reference Issa, Morgan-Short, Villegas, Raney, Roberts, McManus, Vanek and Trenkic2015). They examined the effects of external and internal attention conditions on processing Spanish accusative case pronouns. The pronouns appeared in red font (input enhancement) as the external manipulation. The pronouns appeared in a structured input practice activity (PI) as the internal manipulation. Their results showed that the external manipulation brought about a change in several eye-tracking measures of processing. The participants allocated more visual attention to the accusative case pronouns when they appeared in red font. Accuracy scores from pretest to posttest to delayed posttest showed a small increase. They found that the change in gaze duration predicted delayed posttest accuracy scores for the external manipulation group. Their results also showed that the internal manipulation brought about a change in two eye-tracking measures of processing. The participants allocated more visual attention to the accusative case pronouns when they were carrying out a structured input activity. Accuracy scores from pretest to posttest to delayed posttest showed a large increase. They found that changes in eye movements predicted delayed posttest accuracy scores for the internal manipulation group.
It is not possible to summarize the results of the effects of PI on eye movements with only two studies to review that addressed very different questions. The evidence does suggest that PI affects learners’ L2 processing behaviors.
EYE MOVEMENTS AND LANGUAGE PROCESSING
The Eye-Mind Hypothesis (also referred to as the Eye-Mind Link, see Reichle & Reingold, Reference Reichle and Reingold2013) underlies our approach to eye movements in the current study. The hypothesis is a core concept of the eye-tracking technique in language processing research. The hypothesis asserts that there is a close relationship between what the eyes are fixating upon and what is being processed by the brain. In other words, “[T]here is no appreciable lag between what is fixed and what is processed” (Just & Carpenter, Reference Just and Carpenter1980, p. 331) and eye movements are indicative of cognitive processing (Liversedge, Gilchrist, & Everling, Reference Liversedge, Gilchrist and Everling2011). The hypothesis is operationalized in visual attention systems in which cognitive operations distinguish between relevant and irrelevant visual information to efficiently process relevant information in a system with a limited capacity (Carrasco, Reference Carrasco2011). In such systems, visual attention can be allocated in a top-down and/or bottom-up manner in which both overt and covert visual attention is possible (Buschman & Miller, Reference Buschman and Miller2007). In a broad sense, top-down refers to task and context demands in which we actively attend to a given stimuli for a predefined reason, for example, to search for a word, while bottom-up denotes an automatic attraction of visual attention caused by the stimuli as a flashing light or moving image would do.
The widely acknowledged weakness of the Eye-Mind Hypothesis is that it relies heavily upon overt visual attention to account for a link between eye movement behavior, such as a fixation or series of fixations on a word, and resultant language processing (e.g., Doherty, Reference Doherty2012; Doherty & O’Brien, 2014; Doherty, O’Brien, & Carl, Reference Doherty, O’Brien and Carl2010; Reichle & Reingold, Reference Reichle and Reingold2013). However, studies of covert (visual) attention have consistently shown that cognitive processing, related and unrelated to the presented stimuli, can indeed occur outside of overt visual attention (e.g., Hunt & Kingstone, Reference Hunt and Kingstone2003; Irwin, Reference Irwin, Henderson and Ferreira2004; Posner, Reference Posner1980; Wright & Ward, Reference Wright and Ward2008). Experiment design can be used to avoid confounds in the attribution and interpretation of visual attention to substantiate the argument for a link between fixation-based eye movements and the cognitive processing isolated by the experiment (Duchowski, Reference Duchowski2007; Irwin, Reference Irwin, Henderson and Ferreira2004). The presence of a single target stimulus, the designation of specific tasks, and the specification of spatiotemporal areas of interest are the most typical procedures used to substantiate the link between a target stimulus and its processing.
Doherty’s (Reference Doherty2019) and Doherty and Kruger’s (Reference Doherty, Kruger, Dwyer, Perkins, Redmond and Sita2018) reviews of the eye-tracking measures used in multimodal language processing research distinguished between primary and secondary eye-tracking measures. Primary measures are the raw values derived directly from eye movements (e.g., a fixation count and its duration). Secondary measures combine two or more primary measures (e.g., first or second pass time). The distinction is useful here and allows us to identify that eye-tracking studies of L1 and L2 language processing make use of both primary and secondary measures depending on the research question and design. Recent discussions of these eye-tracking measures applied to SLA-specific research can be found in Roberts and Siyanova-Chanturia (Reference Roberts and Siyanova-Chanturia2013) and Indrarathne and Kormos (Reference Indrarathne and Kormos2017). A number of eye-tracking measures are available to researchers. Liversedge, Gilchrist, and Everling (Reference Liversedge, Gilchrist and Everling2011) provide a comprehensive description; see especially the sections on “Language Processing and Eye Movements” and “Eye Movement Controlled during Reading.”
The present study uses primary and secondary eye-tracking measures because they are motivated by our research questions and supported in the L1 and L2 literature. Time to first fixation measures the time elapsed between the onset of the stimulus slide and the first recorded fixation in the area of interest (AOI). First fixation duration is the duration of the first fixation recorded in the AOI. First fixation duration is an established index of word recognition (Roberts & Siyanova-Chanturia, 2013) and is the earliest point at which an effect of lexical processing has been shown to be apparent (Liversedge, Paterson, & Pickering, Reference Liversedge, Paterson, Pickering and Underwood1998). Time to first fixation and its duration capture participants’ initial allocation of visual attention on the target. First pass time is the sum of all forward fixation durations within the first visit to the AOI as measured by totaling all fixations from the first to the last fixation within the area. It indicates early processing in the analysis of the unit in L1 and L2 research (Rayner, Reference Rayner1998; Roberts & Siyanova-Chanturia, 2012). Second pass time is the sum of all fixation durations in an AOI after the first pass has ended and a new pass commences. It is an established index of reanalysis (e.g., Rayner, Reference Rayner1998), where longer second pass times are typical when one rereads a unit for further analysis, for example, to resolve lexical or syntactic ambiguity or to store information deemed to be important in the unit.
THE PRESENT STUDY AND RESEARCH QUESTIONS
The present study examines the second language acquisition of the Spanish passive using eye-tracking methodology to examine learners’ cognitive processing behaviors before and after they receive PI. It uses materials, procedures, and assessments specifically designed for the present study and draws from a different participant pool than used in previous research on the Spanish passive. Importantly, it addresses whether L2 learners become more nativelike processors as an effect of PI, a very different question than the previous research has addressed. The following research questions guide our study.
1. Does receiving PI on the Spanish active and passive voices improve L2 learner’s interpretation of active and passive sentences as measured by accuracy of response and response time to select the correct answer?
2. Does receiving PI affect the processing behaviors, as measured by eye movements, L2 learners use to process active and passive sentences while reading the linguistic input?
3. Does L2 processing of active and passive sentences become more nativelike after L2 learners receive PI?
METHOD
PARTICIPANTS
We recruited 11 native speakers (female = 9, male = 2) and 26 nonnative speakers (female = 21, male = 5) over the 2015 and 2016 academic years. We fully excluded four nonnative speakers from analysis due to the poor quality of their overall recordings across the experiment. This resulted in a final pool of 22 nonnative speakers (female = 18, male = 4). All participants volunteered and received a gift voucher for participating. The native speakers of Spanish were highly advanced Spanish-English bilinguals who used both languages professionally. This group consisted of professional translators and/or interpreters as well as students enrolled in a Master of Translation and Interpreting degree program at the university where the research took place. They came from various Spanish-speaking countries.
The 22 nonnative participants (18 = female) were enrolled in either the second semester of the introductory level or the first or second semester of the intermediate-level Spanish language course at a large public university in Australia. All participants began their Spanish language study as adults. Two took beginner’s Spanish in years 11 and 12 of high school; the others began at the university. No nonnative participant had studied the passive as part of formal instruction. They scored lower than 70% correct on the passive sentences on the pretest, following VanPatten and Cadierno (Reference VanPatten and Cadierno1993). Each participant completed a modified version of the Language Experience and Proficiency Questionnaire (LEAP-Q; Marian, Blumenfeld, & Kaushanskaya, Reference Marian, Blumenfeld and Kaushanskaya2007). Their answers to the questionnaire revealed the commonalities that led to us to include them in the participant pool. Our participant pool was very homogeneous in terms of their experience with Spanish. Specifically, the participants’ only contact with Spanish was through classroom instruction. They had no Spanish-speaking friends and only accessed Spanish language materials online as part of a classroom assignment. They sought no extracurricular contact with Spanish. Two of the native and nonnative speakers had a first language other than English but had had contact with English since high school. Language background or participants with native languages other than English (e.g., Mandarin, German, Polish, Russian) has twice been shown not to have a statistical effect on the results of PI (Benati, Lee, & McNulty, Reference Benati, Lee, McNulty, Benati and Lee2010; Lee & McNulty, Reference Lee, McNulty, Lee and Benati2013). The issues are the participants’ prior knowledge of the target (pretest score) and their use of an inappropriate processing strategy, not the participant’s native language. The questionnaire included items on visual impairments, hearing impairments, language disability, and learning disability. The participants reported no impairments or disabilities and had normal or corrected-to-normal vision.
THE TARGET FORM
Examples of Spanish passive sentences are presented in (1) and (2). The passive verb phrase consists of the auxiliary verb ser “be” and the passive participle form of the main verb. The auxiliary verb agrees in number with the grammatical subject, plural in (1) and singular in (2). The passive participle agrees in gender and number with the grammatical subject, masculine plural in (1) and feminine singular in (2). The order of mention in passive sentences reflects the grammatical relationship of subject and object (of the preposition). The first noun/s is/are the grammatical subject of the passivized verb form. The second noun/s is/are an object, the object of a preposition. The verb form, the prepositional phrase, and the positioning of the semantic relationships formally distinguish active and passive sentences. Pragmatically, the agent role is diminished and the patient role is promoted. Pragmatic intentions are, however, beyond the scope of the present study.
(1) Pablo y Marcos son abrazados por Graciela.
Pablo and Marcos are-3.PL hugged-3.M.PL by Graciela
“Pablo and Marcos are hugged by Graciela.”
(2) Graciela es abrazada por Pablo y Marcos.
Graciela is-3.SG hugged-3.F.SG by Pablo and Marcos
“Graciela is hugged by Pablo and Marcos.”
INSTRUMENTS
INSTRUCTIONAL MATERIALS
We designed all instruments specifically for the present eye-tracking study. We created both the explicit information about the linguistic target and structured input activities following the guidelines in Lee and VanPatten (Reference Lee and VanPatten2003). The explanation was a self-paced PowerPoint presentation (16 slides). Self-paced explanation is the norm in the PI studies that have included explicit information because the participants read and learn the materials in their own time and way. The explanation began with a review of the word order of active sentences with two examples using the verbs criticar “criticize” and visitar “visit.” It linked the concept of active voice to the active form of the verb. The explanation continued to a new grammatical feature, the passive and its word order pattern as shown in two examples. The examples were the passivized versions of the two active sentence examples. The presentation included information on the formation of passive verbs (auxiliary plus gender-marked passive participle). Finally, the explanation concluded with information on processing strategies. Learners were told to not use the inappropriate word-order–based first noun strategy but to use a new strategy of attending to the passive participle and its agreement features. We did not draw attention to the accusative case marker a in active sentences or the preposition por in passive ones.
We presented the structured input practice activities in two separate practice sets in two modes, first aural and then written. We constructed and administered the aural and written practice sets identically. Each practice set contained 30 items: 10 target passive sentences, 10 target active sentences, and 10 truncated passive sentences that will be analyzed in future research (see Appendix). We used only semantically reversible sentences in which all nouns in agent/patient roles were not only singular, animate, and concrete (as in Uludag & VanPatten, Reference Uludag and VanPatten2012) but also were gender-obvious proper names. The target passive sentences consisted of a patient, auxiliary, passive participle, preposition por, and an agent. The truncated passives contained two words, the auxiliary and the gender-marked passive participle. They contained null subjects and no explicit agent (hence no preposition por). Their correct interpretation depended exclusively on processing the gender maker on the passive participle. We used one set of verbs in the treatment materials and a different set in the assessment tasks. Each verb appeared in all three types of sentences. If the participle was feminine in the target passive sentence, it was masculine in the truncated passive and vice versa.
We used dichotomous images (line drawings) to measure interpretation, which have been used in both L1and L2 research, Stromswold (Reference Stromswold2006) and Wong and Ito (Reference Wong and Ito2017), respectively. After reading a sentence, the participants viewed two images with reversed agent/patient roles and then selected the one that matched their interpretation of what they had read. The participants then received feedback on the accuracy of their responses. We constructed the feedback by presenting the images a second time but with a large green tick above the correct image. If the male appeared on the left in a target passive, then the female appeared on the left for a truncated passive and vice versa.
We constructed the structured input activities using Tobii Pro Studio software by creating a repeating sequence of slides for each practice item. Figure 1 presents the sequence and the timings of the slides. The 500 ms was the temporal delay between slides and the centered fixation cross provides no content. The timed content slides were 2,500 ms for the sentence and image slides. The answer selection slide was untimed. The feedback slide then appeared for 4,000 ms. No new information is presented during the 500 ms gap between slides, as per Figure 1. To avoid conflating the imaging viewing and answer selection tasks, we chose a duration of 500 ms between these slides as visual information in such tasks is typically acquired during fixations of up to 500 ms (Luck & Vogel, Reference Luck and Vogel2013). Thus, 500 ms provides a sufficient “buffer” between visual information in each slide and remains well below reported thresholds for working memory decay in a serial presentation of visual information (Lewandowsky, Oberauer, & Brown, Reference Lewondowsky, Oberauer and Brown2009).
Repeated sequence of slides for the treatment materials presented in the written mode.

PRETEST/POSTTEST
We constructed the pretest and posttest in the same way as we constructed the instructional materials. The similarity between testing and treatment materials would allow for target-appropriate processing. That is, “[W]e can better remember what we have learned if the cognitive processes that are active during learning are similar to those that are active during retrieval” (Lightbown, Reference Lightbown and Han2008, p. 27). We constructed an aural and a written version of each test. We report here only on the written version as it is the data source for our eye-movement study. The pre- and posttest each contained 30 items: 10 passive sentences, 10 active sentences, and 10 fillers (five truncated passives and five active sentences with the preposition por that will be analyzed in future research). We arranged items pseudorandomly so that no two passive sentences appeared contiguously. We used a different set of 10 verbs in the testing materials than we had used in the instructional materials. The 10 verbs appear in both active and passive sentences. We used a different set of five verbs to form truncated passives in the testing materials (see Appendix). The active sentences consisted of four words: subject, verb, accusative case marker a, object. The passive sentences consisted of five words: subject, auxiliary ser, passive participle, preposition por, object. The verb phrase appears as the second word in both types of sentences. We again used dichotomous images (line drawings) to measure interpretation but the participants received no feedback on the in/accuracy of their responses on the test items. Each image appeared in two ways: the male on the left and the female on the left.
Repeated sequence of slides for the pretest and posttest.

The isolation of the image slide and selection slide enables us to separate the eye-movement behaviors associated with the processes of image viewing versus answer selection. While the participants had to remember the letter, A and B, that corresponded to each image, the short duration of 500 ms between the image slide and selection slide ensures this information remained in working memory (Lewandowsky, Oberauer, & Brown, Reference Lewondowsky, Oberauer and Brown2009; Luck & Vogel, Reference Luck and Vogel2013). Combining the image slide and selection slide would conflate eye movements of both processes into one slide and limit our analysis and subsequent interpretation of eye-movement data.
PROCEDURES
DATA-GATHERING SESSION
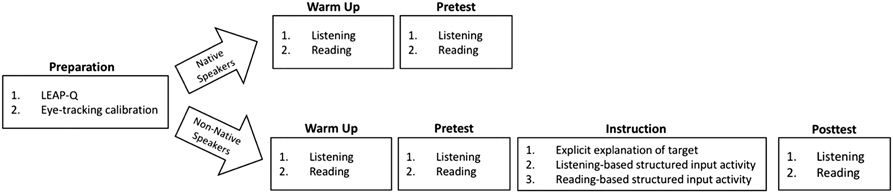
Figure 3 graphically presents the procedures we used. Each eye-tracking session began with the lead researcher collecting the consent form and the LEAP-Q, and then describing the sequence of events that would take place. He then performed the eye-tracking calibration. The warm-up activities consisted of four items to allow the participant to become familiar with the sequence and timing of the slides, the type of images, and the way to indicate their interpretation. The verbs in the warm-up included escuchar “listen,” escribir “write,” seguir “follow,” mirar “watch,” and leer “read” and were presented in four-word active sentences. The researcher then administered the pretest, provided the explanation and then the structured input practices, and finally, administered the posttest. Participants could ask questions in between each phase of the session as well as in between the listening and reading modes, but none did. The nonnative speakers spent 50 to 75 minutes in the laboratory whereas the native speakers spent 15 to 20 minutes. Issa and Morgan-Short (in press) and Wong and Ito (Reference Wong and Ito2017) also conducted a pretest, treatment, and immediate posttest in the same one-hour session. We exposed our participants to 90 aural and 90 written sentences whereas Issa and Morgan-Short used 150 written sentences.
Procedures followed during eye-tracking sessions.

PROCEDURE FOR EYE-TRACKING DATA PROCESSING
We used a Tobii Pro X2-60 screen-based eye tracker to capture eye movements. The device has a temporal resolution of 60 Hz and binocular accuracy between 0.4 and 1.2 degrees, thus allowing for a limited range of free head movement required for the study. Its precision is rated at 0.32 degrees. We displayed all stimuli in Tobii Pro Studio (version 3.4.1). We presented the text in the reading task, answer selection task, and fixation crosses as centered on the screen in Calibri, size 24. All text, images, and fixation crosses were black on a white background. The image viewing task contained two images whose central points were equidistant from the center of the screen.
We determined the quality of eye-movement recordings by rejecting recordings for slides that had lower than 90% of eye-movement data, including saccades and all fixations, recorded in the raw data for the duration of the slide (Doherty, Reference Doherty2012, Reference Doherty2019). We carried out a manual visual inspection on each recording. We then applied the Tobii I-VT fixation filter to filter raw data (Olsen, Reference Olsen2012), after which, we created AOIs for passive verbs (auxiliary + passive participle, es abandonado) and active verbs (lexical verb, abandona) to isolate eye-movement data for the specific spatial-temporal regions. Both types of verbs appear at the second word in the sentence. We manually created borders for the areas of interest based on a space of 8 pixels or 2.12 mm (above, below, left, and right) as this allowed for the inclusion of eye-movement data surrounding the verb forms while excluding data attributed to the full sentence. Finally, we exported all data from Tobii Pro Studio to R (version 3.4.2) for processing and then to SPSS (version 24) for statistical analysis. (For a discussion of the analysis of eye-movement data in bilingual language processing tasks, see Doherty [Reference Doherty, Federici and Walker2018, Reference Doherty2019].)
We acknowledge that the passive form of a regular verb is longer that its active form. The differences are that the passive form is two words, the active one, and that the passive participle of a regular verb is one syllable longer than its present tense active form. These differences are, however, a constant in our materials because we used the same lexical verbs in active and passive sentences. We did not use verbs with irregular present tense active forms or irregular passive participles. We are, therefore, analyzing performance on two forms of the same word, as Jackson (Reference Jackson2008, Reference Jackson, VanPatten and Jegerski2010) did for simple past versus present perfect verb forms in German.
RESULTS
THE EFFECTS OF INSTRUCTION
Mean Accuracy Scores
Descriptive statistics for accuracy scores on the pretest and posttest for nonnative speakers and the comparison scores for native speakers are presented in Table 1. We carried out a two-way repeated measures ANOVA for the nonnative speakers group with time (pretest, posttest) and verb type (active, passive) as variables. We found a statistically significant two-way interaction effect between time and verb type, F(1, 17) = 37.290, p < .001, partial η 2 = .687. We carried out separate one-way repeated measures ANOVAs to explore this interaction and identified significant simple effects between pretest and posttest mean accuracy scores for active verbs, F(1, 19) = 4.412, p < .05, partial η 2 = .188, and for passive verbs, F(1, 20) = 44.262, p < .001, partial η 2 = .689. We then performed two separate one-way ANOVAs to isolate the pretest and posttest data for the nonnative speakers group and found a statistically significant difference between mean accuracy scores by verb type (active, passive) at pretest, F(1, 41) = 40.740, p < .001, partial η 2 = .498, and at posttest, F(1, 40) = 4.508, p < .05, partial η 2 = .104. We then carried out a one-way ANOVA for the native speakers group with verb type as a variable (active, passive) and found a statistically significant difference, F(1, 19) = 5.444, p < .05, partial η 2 = .232.
Descriptive statistics for accuracy scores (raw) for nonnative speakers by verb type and time with native speaker comparison.

To compare groups at each time point, we first carried out a two-way ANOVA at pretest with group (nonnative speakers, native speakers) and verb type (active, passive) as variables and found a statistically significant two-way interaction at pretest, F(1, 62) = 12.786, p < .001, partial η 2 = .178. Using two separate one-way ANOVAs, we identified significant differences between nonnative speakers and native speakers for both active, F(1, 29) = 6.043, p < .05, partial η 2 = .178, and passive verbs, F(1, 32) = 20.086, p < .001, partial η 2 = .392. We then repeated this procedure at posttest, using the native speakers pretest values, and found no significant interaction, F(1, 57) = .523, p = .472, partial η 2 = .009. Using two separate one-way ANOVAs, we identified no significant differences between nonnative speakers and native speakers for both active, F(1, 29) = 1.226, p > .05, partial η 2 = .004, and passive verbs, F(1, 32) = 0.25, p > .05, partial η 2 = .000.
These results indicate that native and nonnative speakers were significantly more accurate with active over passive sentences. The nonnative speakers benefitted from instruction such that accuracy significantly increased on both active and passive sentences. The nonnative speakers were significantly more accurate with active over passive sentences even after instruction. The nonnative speakers’ accuracy on both active and passive sentences, after instruction, reached the native speaker level.
Correct Answer Selection Mean Response Time
Descriptive statistics for correct answer selection mean response time are presented in Table 2. We carried out a two-way repeated measures ANOVA for the nonnative speakers group with time (pretest, posttest) and verb type (active, passive) as variables. We did not find any significant interaction between time and verb type, F(1, 22) = 3.603, p = .071, partial η 2 = .141. We carried out separate one-way repeated measures ANOVAs and found a significant difference between pretest and posttest mean response time on active verbs, F(1, 22) = 43.614, p < .001, partial η 2 = .665, and on passive verbs, F(1, 22) = 49.828, p < .001, partial η 2 = .694. We then used two separate one-way ANOVAs to isolate the pretest and posttest data for the nonnative speakers group and found a statistically significant difference between correct answer selection mean response time by verb type (active, passive) at pretest, F(1, 44) = 343.646, p < .001, partial η 2 = .887, and at posttest, F(1, 44) = 544.313, p < .001, partial η 2 = .925. We then carried out a one-way ANOVA for the native speakers group with verb type (active, passive) as a variable and found a significant difference on correct answer selection mean response time, F(1, 19) = 447.320, p < .001.
Correct answer selection mean response time (ms) for nonnative speakers by verb type and time with native speaker comparison.

To compare groups at each time point, we carried out a two-way ANOVA at pretest with group (nonnative speakers, native speakers) and verb type (active, passive) as variables and did not find a statistically significant interaction at pretest, F(1, 62) = 1.013, p = .318, partial η 2 = .016. Using two separate one-way ANOVAs, we identified significant differences between nonnative speakers and native speakers for both active, F(1, 32) = 41.964, p < .001, and passive verbs, F(1, 32) = 33.067, p < .001. We repeated this procedure at posttest, using the native speakers pretest values, and found a statistically significant two-way interaction, F(1, 62) = .063, p = .802, partial η 2 = .001. Using two separate one-way ANOVAs, we found no significant differences between nonnative speakers and native speakers for both active, F(1, 32) = .931, p = .342, and passive verbs, F(1, 32) = .460, p = .503.
These results indicate that both native and nonnative speakers were significantly faster to select the correct answer for active over passive sentences. The nonnative speakers benefitted from instruction such that correct answer selection response time significantly decreased on both active and passive sentences. The nonnative speakers were significantly faster to select the correct answer for active over passive sentences even after instruction. The nonnative speakers’ correct answer selection response time on both active and passive sentences, after instruction, reached the native speaker level.
Mean Time to First Fixation (ms) in the AOI
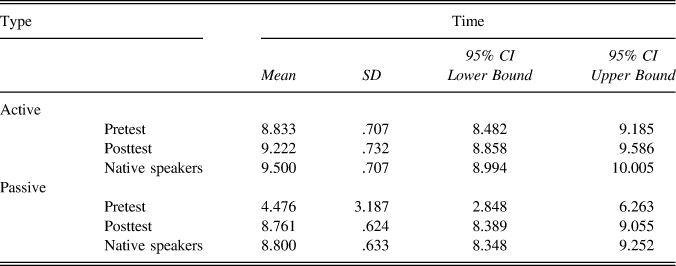
Descriptive statistics for the mean time to the first fixation in the AOI are presented in Table 3. We carried out a two-way repeated measures ANOVA for the nonnative speakers group with time (pretest, posttest) and verb type (active, passive) as variables. We did not find any significant interaction between time and verb type, F(1, 22) = .047, p = .831, partial η 2 = .002. We carried out separate one-way repeated measures ANOVAs and found significant differences between pretest and posttest mean first fixation duration on active verbs [F(1,22) = 218.869, p < .001, partial η 2 = .909] and passive verbs [F(1, 22) = 66.648, p < .001, partial η 2 = .752]. We then used two separate one-way ANOVAs to isolate the pretest and posttest data for the NNS group and found a statistically significant difference between mean time to first fixation by verb type (active, passive) at pretest, F(1, 44) = 141.059, p < .001, partial η 2 = .762, and at posttest, F(1, 44) = 40802.174, p < .001, partial η 2 = .831. We then carried out a one-way ANOVA for the native speakers group with verb type (active, passive) as a variable and found a significant difference on mean time to first fixation, F(1, 19) = 650.138, p < .001.
Mean time to the first fixation (ms) on the AOI for nonnative speakers by verb type and time with native speaker comparison.

To compare groups at each time point, we first carried out a two-way ANOVA at pretest with group (nonnative speakers, native speakers) and verb type (active, passive) as variables and found a statistically significant two-way interaction at pretest, F(1, 62) = 11.743, p < .001, partial η 2 = .159. Using two separate one-way ANOVAs, we identified significant differences between nonnative speakers and native speakers for both active [F(1, 32) = 966.877, p < .001] and passive verbs [F(1, 32) = 205.967, p < .001]. We then repeated this procedure at posttest, using the native speakers pretest values, and found a statistically significant two-way interaction, F(1, 62) = 20.490, p < .001, partial η 2 = .248. Using two separate one-way ANOVAs, we identified significant differences between nonnative speakers and native speakers for both active [F(1, 32) = 406.240, p < .001] and passive verbs [F(1, 32) = 88.815, p < .001].
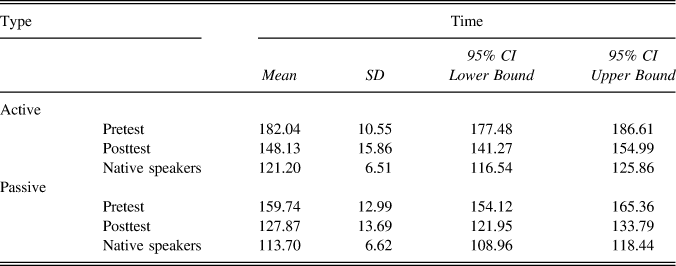
These results indicate that native and nonnative speakers were significantly faster to first fixate in the AOI for active over passive verb types. The nonnative speakers benefitted from instruction such that time to first fixation in the AOI significantly decreased on both active and passive verb types. The nonnative speakers were significantly faster to first fixate in the AOI for active over passive verb types even after instruction. The nonnative speakers’ time to first fixate in the AOI on both active and passive verb types, after instruction, decreased significantly but did not reach the native speaker level.
Mean First Fixation Duration (ms) in the AOI
Descriptive statistics for the mean first fixation duration in the AOI are presented in Table 4. We carried out a two-way repeated measures ANOVA for the nonnative speakers group with time (pretest, posttest) and verb type (active, passive) as variables. We did not find any significant interaction between time and verb type, F(1, 22) = .167, p = .687, partial η 2 = .008. We carried out separate one-way repeated measures ANOVAs and found significant differences between pretest and posttest mean first fixation duration on active verbs [F(1,22) = 63.477, p < .001, partial η 2 = .743] and passive verbs [F(1, 22) = 61.810, p < .001, partial η 2 = .738]. We then used two separate one-way ANOVAs to isolate the pretest and posttest data for the nonnative speakers group and found a statistically significant difference between mean first fixation by verb type (active, passive) at pretest, F(1, 44) = 40.829, p < .001, partial η 2 = .481, and at posttest, F(1, 44) = 21.491, p < .001, partial η 2 = .328. We then carried out a one-way ANOVA for the native speakers group with verb type (active, passive) as a variable and found a significant difference on mean first fixation duration, F(1, 19) = 6.526, p < .020.
Mean first fixation duration (ms) in the AOI for nonnative speakers by verb type and time with native speaker comparison.

To compare groups at each time point, we carried out a two-way ANOVA at pretest with group (nonnative speakers, native speakers) and verb type (active, passive) as variables and found a statistically significant two-way interaction at pretest, F(1, 62) = 6.822, p < .01, partial η 2 = .099. Using two separate one-way ANOVAs, we identified significant differences between nonnative speakers and native speakers for both active [F(1, 32) = 282.574, p < .001] and passive verbs [F(1, 32) = 11.412, p < .001]. We repeated this procedure at posttest, using the native speakers pretest values, but did not find a statistically significant interaction, F(1, 62) = .309, p = .580, partial η 2 = .005. Using two separate one-way ANOVAs, we identified significant differences between nonnative speakers and native speakers for both active [F(1, 32) = 26.477, p < .001] and passive verbs [F(1, 32) = 9.592, p < .05].
These results indicate that the duration of native and nonnative speakers’ first fixation in the AOI was significantly longer for active over passive verb types. The nonnative speakers benefitted from instruction such that the duration of their first fixation in the AOI significantly decreased for both active and passive verb types. The duration of the nonnative speakers’ first fixation in the AOI was significantly longer for active over passive verb types even after instruction. The duration of the nonnative speakers’ first fixation in the AOI on both active and passive verb types, although significantly shorter after instruction after instruction, did not reach the native speaker level.
Mean First Pass Time through the AOI
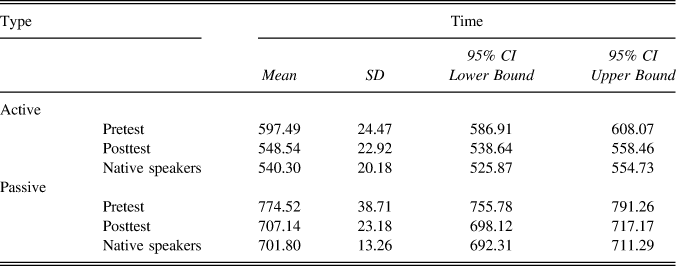
Descriptive statistics for the mean first pass time (ms) through the AOI are presented in Table 5. We carried out a two-way repeated measures ANOVA for the nonnative speakers group with time (pretest, posttest) and verb type (active, passive) as variables. We did not find any significant interaction between time and verb type, F(1, 22) = .167, p = .687, partial η 2 = .008. We carried out separate one-way repeated measures ANOVAs and found significant differences between pretest and posttest mean first pass time on active verbs [F(1,22) = 61.810, p < .001, partial η 2 = .738] and passive verbs [F(1, 22) = 63.477, p < .001, partial η 2 = .743]. We then used two separate one-way ANOVAs to isolate the pretest and posttest data for the nonnative speakers group and found a statistically significant difference between mean first pass time by verb type (active, passive) at pretest, F(1, 44) = 41.833, p < .001, partial η 2 = .485, and at posttest, F(1, 44) = 20.549, p < .001, partial η 2 = .331. We then carried out a one-way ANOVA for the native speakers group with verb type (active, passive) as a variable and found a significant difference on mean first pass time, F(1, 19) = 4.402, p = .050.
Mean first pass time (ms) through the AOI for nonnative speakers by verb type and time point with native speaker comparison.

To compare groups at each time point, we carried out a two-way ANOVA at pretest with group (nonnative speakers, native speakers) and verb type (active, passive) as variables and found a statistically significant two-way interaction at pretest, F(1, 62) = 7.558, p < .01, partial η 2 = .109. Using two separate one-way ANOVAs, we identified significant differences between nonnative speakers and native speakers for both active [F(1, 32) = 111.412, p < .001] and passive verbs [F(1, 32) = 279.819, p < .001].
We repeated this procedure at posttest, using the native speakers pretest values, but no interaction was found, F(1, 62) = 3.823, p = .055, partial η 2 = .058. Using two separate one-way ANOVAs, we identified significant differences between nonnative speakers and native speakers for both active [F(1, 32) = 9.592, p < .001] and passive verbs [F(1, 32) = 27.754, p < .001].
These results indicate that native and nonnative speakers’ first pass time through the AOI was significantly shorter in duration for active over passive verb types. The nonnative speakers benefitted from instruction such that the first pass time through the AOI significantly decreased for both active and passive verb types. The nonnative speakers’ first pass time through the AOI was significantly shorter in duration for active over passive verb types even after instruction. The nonnative speakers’ first pass time through the AOI on both active and passive verb types, after instruction, did not reach the native speaker level.
Mean Second Pass Time through the AOI
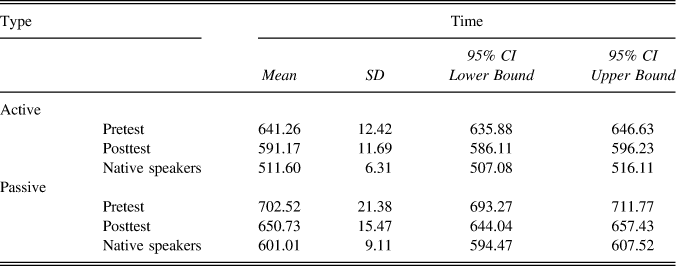
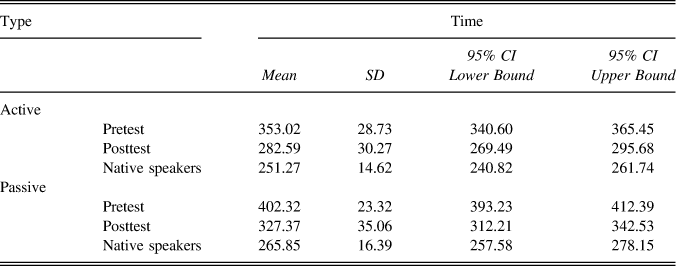
Descriptive statistics for the mean second pass time through the AOI are presented in Table 6. We carried out a two-way repeated measures ANOVA for the nonnative speakers group with time (pretest, posttest) and verb type (active, passive) as variables. We did not find any significant interaction between time and verb type, F(1, 22) = 4.241, p = .051, partial η 2 = .162. We carried out separate one-way repeated measures ANOVAs and found significant differences between pretest and posttest mean second pass time on active verbs [F(1,22) = 63.444, p < .001, partial η 2 = .743] and passive verbs [F(1, 22) = 65.319, p < .001, partial η 2 = .748]. We then used two separate one-way ANOVAs to isolate the pretest and posttest data for the nonnative speakers group and found a statistically significant difference between mean second pass time by verb type (active, passive) at pretest, F(1, 44) = 350.646, p < .001, partial η 2 = .889, and at posttest, F(1, 44) = 132.168, p < .001, partial η 2 = .750. We then carried out a one-way ANOVA for the native speakers group with verb type (active, passive) as a variable and found a significant difference on mean second pass time, F(1, 19) = 151.313, p < .001.
Mean second pass time (ms) through the AOI for nonnative speakers by verb type and time with native speaker comparison.

To compare groups at each time point, we carried out a two-way ANOVA at pretest with group (nonnative speakers, native speakers) and verb type (active, passive) as variables and found a statistically significant two-way interaction at pretest, F(1, 62) = 25.214, p < .001, partial η 2 = .289. Using two separate one-way ANOVAs, we identified significant differences between nonnative speakers and native speakers for both active [F(1, 32) = 115.572, p < .001] and passive verbs [F(1, 32) = 282.574, p < .001]. We repeated this procedure at posttest, using the native speakers pretest values, and found a statistically significant two-way interaction, F(1, 62) = 5.547, p < .05, partial η 2 = .082. Using two separate one-way ANOVAs, we identified significant differences between nonnative speakers and native speakers for both active [F(1, 32) = 9.159, p < .005] and passive verbs [F(1, 32) = 22.951, p < .001].
These results indicate that native and nonnative speakers’ second pass time through the AOI was significantly shorter in duration for active over passive verb types. The nonnative speakers benefitted from instruction such that the second pass time through the AOI significantly decreased for both active and passive verb types. The nonnative speakers’ second pass time through the AOI was significantly shorter in duration for active over passive verb types even after instruction. The nonnative speakers’ second pass time through the AOI on both active and passive verb types, after instruction, did not reach the native speaker level.
DISCUSSION
Our results revealed a very consistent pattern. There was a processing cost associated with passive sentences and verb forms in both native and nonnative processing. After receiving PI on active and passive verb forms, nonnative speakers became more accurate in their responses, were quicker to make an interpretation of agent/patient roles, and allocated less visual attention to both active and passive verb forms. Their eye movements became more nativelike after instruction. We begin our discussion with accuracy and answer selection times followed by a discussion of the eye-movement results.
ACCURACY AND CORRECT ANSWER SELECTION RESPONSE TIME
Before Instruction
The pretest sentence interpretation mean scores showed that the nonnative speakers’ accuracy was low on passives (45%) but much higher on actives (88%) and that the difference was significant. The native speakers’ results also showed a significant difference between accuracy on passive (88%) and active sentences (95%). Obviously, the degree of difference is greater for the nonnative speakers. Our results align with those of previous research that native speakers usually show a high level of accuracy on passives but are not perfect (Dabrowski & Street, Reference Dabrowski and Street2006; Ferreira, Reference Ferreira2003; Kim & Kim, Reference Kim, Kim and Voss2013). There are two different underlying causes for the differences in accuracy. The nonnative speakers lack knowledge (none of the participants had studied the passive in a formal setting) and regularly relied on a word-order–based processing strategy. The native speakers did not pay enough attention or lost focus the few items they misinterpreted (Ferreira, Reference Ferreira2003).
The nonnative speakers’ low level of accurate comprehension of the thematic roles of agent and patient in reversible passive sentences, before instruction, mirrors the findings of previous research on the L1 acquisition of English passives (Baldie, Reference Baldie1976; Fraser, Bellugi, & Brown, Reference Fraser, Bellugi and Brown1963; Slobin, Reference Slobin1966), L1 acquisition of Spanish passives (Pierce, Reference Pierce1992), and the L2 acquisition of Spanish passives (Lee, Reference Lee2017). Our eye-tracking study allows us to add to this knowledge base. Our results show that the nonnative speakers, before instruction, allocated visual attention differently to active and passive verb forms. They allocated more visual attention (longer first and second pass times) to passive than active verb forms even though they misassigned the thematic roles of agent and patient. That is, the nonnative speakers were sensitive to the different morphological forms even though they use a processing heuristic to assign thematic roles.
The nonnative speakers’ correct answer selection mean response time was significantly faster for active over passive sentences on the pretest. They showed a similar sensitivity to sentence type than the native speakers did. The native speakers, however, responded faster than the nonnative speakers did on the pretest on both active and passive sentences. Although these learners showed sensitivity to verb form before instruction, instruction brought about changes.
After Instruction
Our results show that PI effectively improved the nonnative speakers’ accuracy interpreting both active (92%) and passive (88%) sentences. This result confirms that of previous research on the effects of PI on the passive in a variety of second languages (Benati & Lee, Reference Benati and Lee2010; Lee, Reference Lee, Benati, Laval and Arche2014b, Reference Lee2015; Qin, Reference Qin2008; Uludag & VanPatten, Reference Uludag and VanPatten2012). Our results show that the nonnative speakers’ posttest scores were not significantly different from the native speaker scores on either active (95%) or passive (88%) sentences. This finding is novel to our study because previous PI research has not included a native speaker comparison group. Interestingly, interpreting passive sentences is more difficult for both native and nonnative speakers; they are more accurate with actives than passives even after the nonnative speakers received PI that included explanation and practice with both active and passive sentences. Some proficient L2 learners can perform to the same level of accuracy as native speakers (Kim & Kim, Reference Kim, Kim and Voss2013) and some highly educated L2 learners outperform less educated native speakers (Dabrowski & Street, Reference Dabrowski and Street2006) when processing passive sentences. Our results show that, after receiving PI (explanation and structured input practice), instructed nonnative speakers performed to the same level of accuracy as native speakers when processing active and passive sentences.
Instruction also affected the nonnative speakers’ correct answer selection response time. Their response times were significantly faster after instruction on both the active and passive sentences although their response times were still faster for active over passive sentences. The native speakers were also faster responding to active than passive sentences. Although the native speakers responded faster than the nonnative speakers did on the pretest on both active and passive sentences, the posttest times showed a different result. There was no difference in answer selection response times between the native and the nonnative speakers on the posttest. PI effectively brought the nonnative speakers’ answer selection response times to the level of a native speaker. The faster response time reflects that processing active and passive sentences became more efficient after instruction and suggests that the nonnative speakers became more confident with their thematic role assignments in the sentences they read.
The pretest results support the claim that the participants aligned the semantic role of agent with the grammatical role of subject and aligned the subject argument with preverbal position (Borer and Wexler, Reference Borer, Wexler, Roeper and Williams1987; Hyams et al., Reference Hyams, Ntelitheos and Manorohanta2006; Lee, Reference Lee2017; Pienneman, Reference Pienneman1998; VanPatten, Reference VanPatten, VanPatten and Williams2007). The improved posttest accuracy scores show that the effects of instruction are to dissolve, disestablish, or destabilize both the alignment of semantic and grammatical roles and the alignment of the subject argument with preverbal position. The instruction provided positive evidence of sentences in which roles and position aligned (active sentences) but, importantly, it provided positive evidence of sentences in which roles and position did not align (passive sentences). In other words, PI pushed the nonnative speakers not to interpret sentences through the frame of canonical word order with its canonical alignment of semantic/grammatical roles and position (VanPatten, Reference VanPatten1996, Reference VanPatten and VanPatten2004, Reference VanPatten, VanPatten and Williams2007).
Eye Tracking in the AOI: The Verb Forms
We first discuss the nonnative speakers’ performance before they received instruction and follow it with a discussion of their performance after instruction. The results show a consistent picture that more visual attention is allocated to passive than active verb forms, both before and after instruction, and that after instruction, the nonnative speakers’ processing behaviors became more nativelike but did not reach a native level.
Before Instruction
The native and nonnative speakers’ mean times to the first fixation on the AOI is faster for active than passive verbs but their mean first fixation durations on the AOI are longer on active than passive verbs. Both native and nonnative speakers move their visual attention to an active verb form faster than they do to a passive verb form but then they spend more time initially (first fixation duration) on active verbs compared to passive verbs. The allocation of visual attention then shifts toward allocating more visual attention to passive verb forms. Both groups’ mean first pass times and mean second pass times are longer for passive than active verb forms. These results reveal two aspects of L2 processing of which we were previously unaware. First, the results show that nonnative speakers are sensitive to the two different verb forms even at a point in time at which they had not been instructed in passive verb forms. Even though they misassign thematic roles in most of the passive sentences, the nonnative speakers cognitively process passive verb forms differently than active ones. Second, the pattern of performance by verb type is the same for the nonnative speakers as it is for the native speakers. Processing passive verb forms comes at a cost to both groups. There are, however, very consistent differences by group for both active and passive verb forms. The nonnative speakers’ mean time to the first fixation on the AOI is slower than the native speakers’ is. Their mean first fixation duration on the AOI is longer. Their mean first pass second pass times are longer. In short, nonnative speakers, before receiving instruction, allocate more visual attention when processing active and passive verb forms than native speakers do. But, instruction makes a difference.
After Instruction
Our results show that there are significant positive effects for PI on nonnative speakers’ cognitive processing behaviors on active and passive verb forms. The pretest to posttest comparisons show that the nonnative speakers’ mean time to first fixation is faster after instruction while their mean first fixation duration on the verb is shorter. Their mean first pass second pass times are shorter. These results apply to both active and passive verb forms. Nonnative speakers allocate less visual attention to active and passive verb forms after receiving PI. Other eye-tracking research has found that treatment increases attention to the target form. These studies, however, examined attention at a different point in time than we did in our research. That is, they tracked eye movements during the treatment, but we tracked eye movements after the treatment, on the posttest and compared that to eye movements on the pretest. Ellis and Sagarra (Reference Ellis and Sagarra2010) showed that L2 learners who received training on adverbs in Latin allocated attention to the adverbs whereas those who received training on verbs allocated attention to verbs. Indrarathne and Kormos (Reference Indrarathne and Kormos2017) showed that L2 learners who received explicit conditions for focusing on the English causative “had” allocated more attention to the form than those who received implicit conditions. Issa and Morgan-Short (in press) showed that L2 learners allocated more visual attention to Spanish accusative case pronouns under directed attention conditions. Indrarathne and Kormos (Reference Indrarathne and Kormos2017) and Issa and Morgan-Short (in press) used the pre- and posttests for accuracy scores to measure language development.
Lee and Doherty (Reference Lee, Doherty and Leowforthcoming) have examined one aspect of the participants’ processing behavior during the treatment phase. We compared the effect of the type of feedback received on a target passive sentence on processing the next passive sentence. Feedback on a passive sentence interpretation (the green tick shown in Figure 2 earlier) indicated to the learner whether the answer was correct. Participants allocated more visual attention to the subsequent passive verb form when they had incorrectly interpreted the previous passive item. They allocated less visual attention to the subsequent target when they had correctly interpreted the previous one. This result aligns with previous research on learned or directed attention and lend support to Leow’s (Reference Leow2015) conceptualization of depth of processing.
The L2 learners’ pattern of performance is the same after instruction as we found before instruction. First, there remains a processing cost associated with processing passive verb forms. Both the nonnative and native speakers’ mean times to the first fixation on the AOI are slower for passive than active verb forms. Their mean first fixation durations on the passive verb forms are longer. Their mean first pass times and their mean second pass times on passive verb forms are longer. Both groups allocate different amounts of visual attention to the two different verb types. Second, PI does not bring the nonnative speakers processing speed to a native speaker level on either active or passive verb forms. After instruction, the nonnative speakers’ mean time to the first fixation on the verb AOI is slower than the native speakers’ is. Their mean first fixation duration on the AOI is longer. Their mean first pass time and their mean second pass times are longer. Processing both active and passive verbs comes at a greater processing cost to nonnative speakers compared to native speakers. Even though the nonnative speakers’ processing is more efficient after instruction, they do not reach native speaker levels. This finding is common in studies of bilingual processing (e.g., see Papadopolou’s Reference Papadoulou2005 review). But, given the changes in the nonnative speakers’ performance, we can assert that the nonnative speakers become more nativelike after instruction.
An anonymous reviewer referred to the discrepancy between online and offline measurements. That is, accuracy and selection time reached a native level, but cognitive processes evidenced in eye movements became more nativelike but at the native level. What does it mean for previous research? We hypothesize that, given the large effect sizes associated with PI, the L2 learners in previous research reached a native level of accuracy. We hypothesize that their cognitive processing behaviors became more nativelike but not nativelike. In the present study, we emphasize that the patterns of performance for the two groups are consistently the same when comparing the processing of active and passive sentences and verb forms before and after instruction. The milliseconds of difference between native and nonnative processing speeds is not the main finding of the present study. One difference between the present study and previous research on PI with the Spanish passive is the number of passive sentences used in the treatment phase of the study. Lee (Reference Lee2015) had more than 100 passive items in the structured input activities whereas we had 20 mixed in with 20 actives. We obtained the results we did with fairly limited exposure to the targets. Future research can examine the effect of amount of exposure on cognitive processing behaviors. Does more exposure and practice lead to native levels of processing?
LIMITATIONS AND CONCLUSIONS
All research has limitations. We were unable to include a delayed posttest in the current study such that the durative effects of PI on L2 learners’ cognitive processing behaviors remains a question for future investigation. Lee and Benati (Reference Lee and Benati2009) reviewed the then-existent research on PI and found that the effects on accuracy scores were very stable and durative although individual studies found a decrease in delayed posttest scores. Future research could reveal whether decreases in accuracy scores are associated with L2 learners reverting to pre-instruction processing behaviors. The present study has no control group, but it has a native speaker comparison group in its place, unique among PI research. We did not isolate the effects of explicit information and structured input practice, but many PI studies have, from VanPatten and Oikennon (Reference VanPatten and Oikennon1996) to Wong and Ito (Reference Wong and Ito2017). We assert that the research points strongly to structured input, not explicit information, as the causative element responsible for L2 development. We hypothesize that if we were to isolate the effects of explicit information and structured input practice that reduced processing costs would be seen in the structured input groups’ behaviors but not in the explicit information groups’ behaviors. Prior knowledge is also a factor to consider. The within-group scores varied in this study as they do in most PI studies that use an upper limit on the pretest score. Leow (Reference Leow2015) sees variable prior knowledge as a limitation on PI research and prefers the participants to have no prior knowledge. Point taken from a research perspective, but the reality of instructed SLA is that a typical classroom consists of learners with different levels of knowledge. The participants in the present study had never received formal instruction or exposure to the ser passive, yet the mean score on the pretest was 4.5/10, below chance. Future research could examine the processing behaviors characteristic of correct interpretation with those of incorrect interpretation. (See Stromswold, Reference Stromswold2006 as an example of L1 research that did this.)
The present study revealed similarities in accuracy and response times but differences in eye movements between native and nonnative speakers. We suggest that future research continue to incorporate a native speaker comparison group and expand the database to include heritage speaker comparison groups, too. For example, eye tracking would reveal how L2 learners of Japanese, heritage speakers of Japanese, and native speakers of Japanese process the various morphological cues to meaning in Japanese active and passive sentences. What is the interplay of those cues in active and passive sentence interpretation before and after instruction? Do native speakers, heritage speakers, and instructed L2 learners of Japanese process these cues similarly or differently from the L2 learners?
The results of our study lead to the following conclusions. PI is an effective intervention because it leads to improved accuracy in thematic role assignment and more efficient allocation of visual attention. Changes in cognitive processing behaviors is the strongest evidence that PI changes the L2 learners’ developing systems. Prior to instruction, L2 learners are sensitive to the morphological differences between active and passive verb forms, but instruction directed attention to the grammatical information the verb forms encode. Processing passive sentences and passive verb forms comes at a cost to both native speakers and L2 learners (before and after instruction). However, L2 learners, after instruction, reach native levels of accuracy and speed in selecting correct answers, but they do not reach native levels in processing times while reading the linguistic input.
SUPPLEMENTARY MATERIAL
To view supplementary material for this article, please visit https://doi.org/10.1017/S027226311800027X
APPENDIX
VERBS USED
Pretest/Posttest

Instructional Materials