


Introduction
There have been many Studies of Sea-ice draft/thickness in the arctic and antarctic. whilst Satellite Studies can provide Synoptic data on ice thickness (e.g. Reference Laxon, Peacock and SmithLaxon and others, 2003), the Spatial resolution is not as high as other methods. these higher-resolution methods include drilling holes (e.g. Reference P., Lange and AckleyWadhams and others, 1987), using upward-looking Sonars (uls) attached to moored buoys (e.g. Reference Strass, Tian and NemotoStrass and others, 1998; Reference Worby, Bush and AllisonWorby and others, 2001) and use of uls on Submarines. almost 50 years of Submarine uls data have enabled determination of Significant changes in thickness in the arctic ice cover (Reference Rothrock, Yu and MaykutRothrock and others, 1999). the use of Similar technology in the antarctic has only been possible with the recent development of autonomous underwater vehicles (auvs) (Reference BrierleyBrierley and others, 2002).
Autosub is a 7m long auv designed with long-range capability ∽800km (up to 6 days endurance) that was designed, built and operated by the uk national oceanography centre, Southampton (for further details See Reference MillardMillard and others, 1998). autosub has to date completed in excess of 350 Scientific missions, with the longest mission over 250 km in length. with a diameter of 0.9 m, autosub carries a variable Scientific payload (∽1m3 volume) according to mission requirements.
This paper presents the use of autosub to gather data on the distribution of Sea-ice draft by using the difference between vehicle depth and range to ice Surface as measured by an acoustic doppler current profiler (adcp). this is the first time that adcp has been used to measure ice draft from a moving vehicle; previously Reference Visbeck and FischerVisbeck and fischer (1995) used adcp to Sense the presence of Sea ice, and Reference Shcherbina, Rudnick and TalleyShcherbina and others (2005) measured ice draft from a bottom-mounted adcp. the data for this Study were collected as part of research cruise jr84 in march 2003 when autosub was deployed under Sea ice from rrs James Clark Ross in the amundsen Sea.
AUV Instrumentation
The payload for these missions included two rd instruments adcps located towards the rear of autosub, one looking in an upward direction and the other in a downward direction. the upward-looking adcp had a notional operating frequency of 300 khz and it is from this instrument that values of range to Surface (or underside of Sea ice) have been recorded. in addition, two Sea-bird electronics 9plus ctd (conductivity–temperature–depth) Sensors were fitted in the nose Section of the vehicle, providing pressure, Salinity and temperature values at a Sampling frequency of 24 hz. autosub was also fitted with an ixsea phins inertial navigation System (ins). the Sampling frequency for all variables other than the ctds was 0.5 hz. other instrumentation was in operation but was not required for the analyses here, except to note that other Sonar Systems may possibly interfere with returns to the adcp as discussed below.
When autosub is horizontal in the water, the upward-looking adcp is arranged with four beams at right angles to each other (in the horizontal plane) pointing towards the Surface at 30˚ from the vertical axis (Rd instruments, 1996). each of these beams provides a Separate value of range to the Surface. clearly this is a Simplification, as the vehicle is a moving platform and thus it is pitching and rolling and the heading is constantly changing.
Whilst the adcp is fitted with attitude Sensors, the ins provides more precise and reliable values of pitch, roll and heading. we have used rotation matrices to convert the ranges and locations of the beams on the Surface to take into account the offset of the beams from the vehicle, attitude of the vehicle and also of the vehicle’s heading.
Data
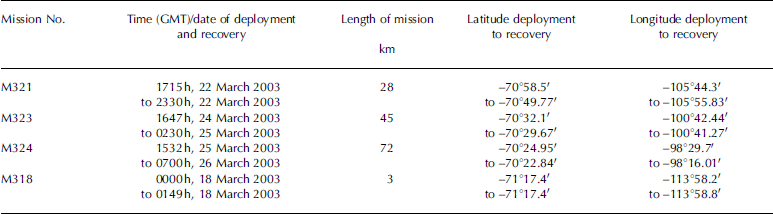
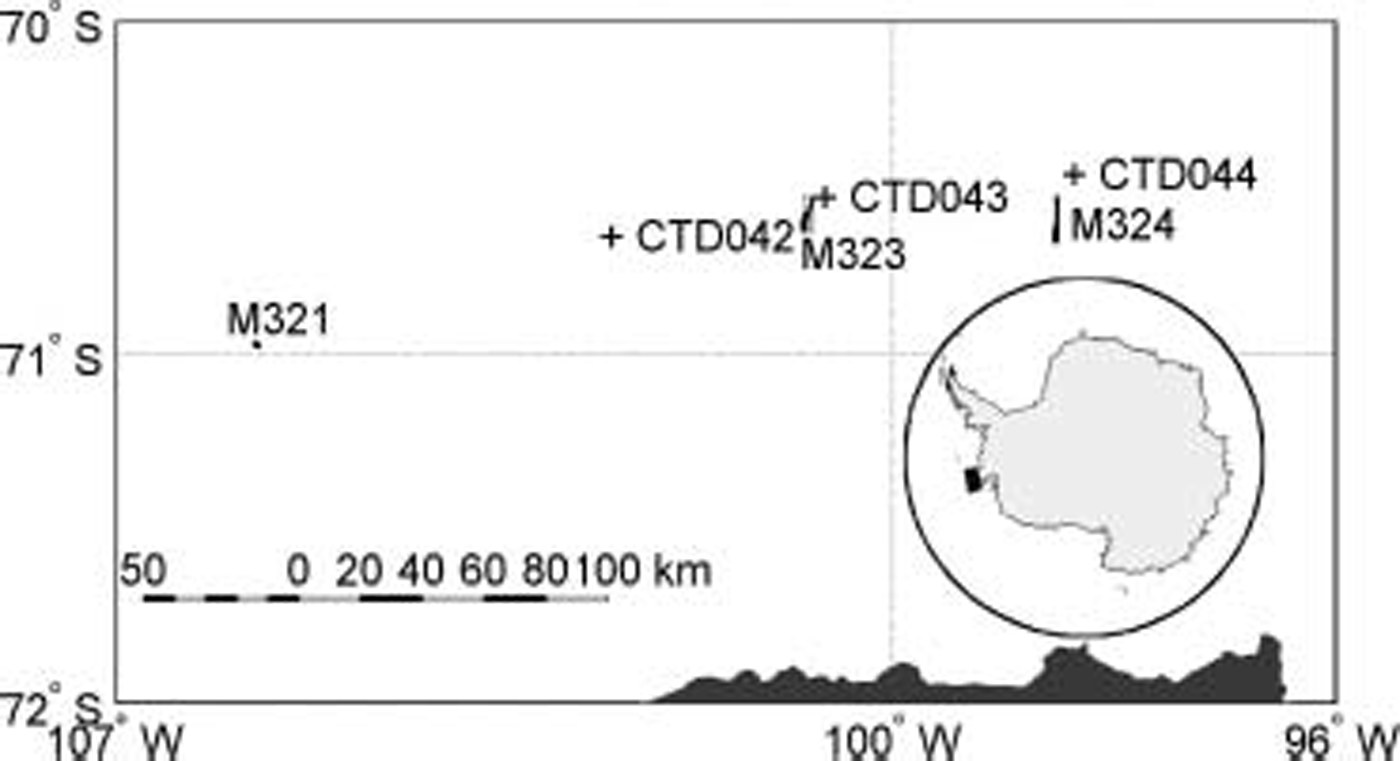
There are three under-ice and one under-open-water autosub missions used in this Study and also data from rrs James Clark Ross (fig. 1; table 1). adcp data were used to measure the range to the reflecting Surface, either Sea–ice or Sea–atmosphere interface. the ctd Sensors on board autosub measured pressure, temperature and Salinity, and attitude data from the ins are used to correct the orientation of the adcp range to Surface vectors in Space. the Specifics of the analyses of these data are described below.
Details of the three under-ice missions (M321, M323 and M324) as well as an under-open-water mission (M318)
Sources of data for project where M321, M323 and M324 are Sites of the three under-ice Autosub missions. CTD042, CTD043 and CTD044 are locations of full water-depth profiles of conductivity and temperature made from RRS James Clark Ross providing data for analysis of Sound Speed profiles.
Pressure-to-Depth Conversion
There are a number of algorithms for converting pressure to depth depending on the density of the water, which in turn is dependent on the temperature and Salinity of the water. the values used in this paper are calculated using
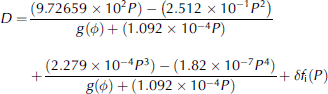
From Reference C.C. and ParthiotLeroy and parthiot (1998), where P is the pressure (in decibars), δf i(P) = (4×10⁻² P) - (2×10⁻⁴ P 2) for circumpolar antarctic waters and the correction for latitude, δ) , is given by g(δ) = 9:780318 1 + 5:2788 × 10-3sin2 δ -(2:36×10-5sin4 δ . this algorithm has a reported accuracy of 0.1 m in the calculated depth. values of atmospheric pressure did not change Significantly during an individual mission, and resultant differences in auv depth are negligible (e.g. ∽3 cm difference in ∽10 hours for m321).
The ctd and adcp were 4 m apart along autosub’s long axis, So there is a difference between the ctd depth and the adcp depth when the vehicle is not horizontal. an additional correction (sine (pitch)×horizontal Separation) was made to correct for this.
Sound Speed
In order to calculate the range from the vehicle to the Surface (interface with atmosphere or ice) the Speed of Sound must be known accurately, as it represents the largest Source of error. the Speed of Sound depends on the temperature and Salinity of the water as well as the pressure (depth) (Reference UrickUrick, 1983). based on our limits for temperature, Salinity and depth, Reference LeroyLeroy (1969) gives the Speed of Sound, c, as:
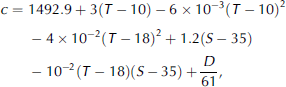
Where T is temperature in degrees celsius, S is Salinity in practical Salinity units (psu) and D is the depth in metres.
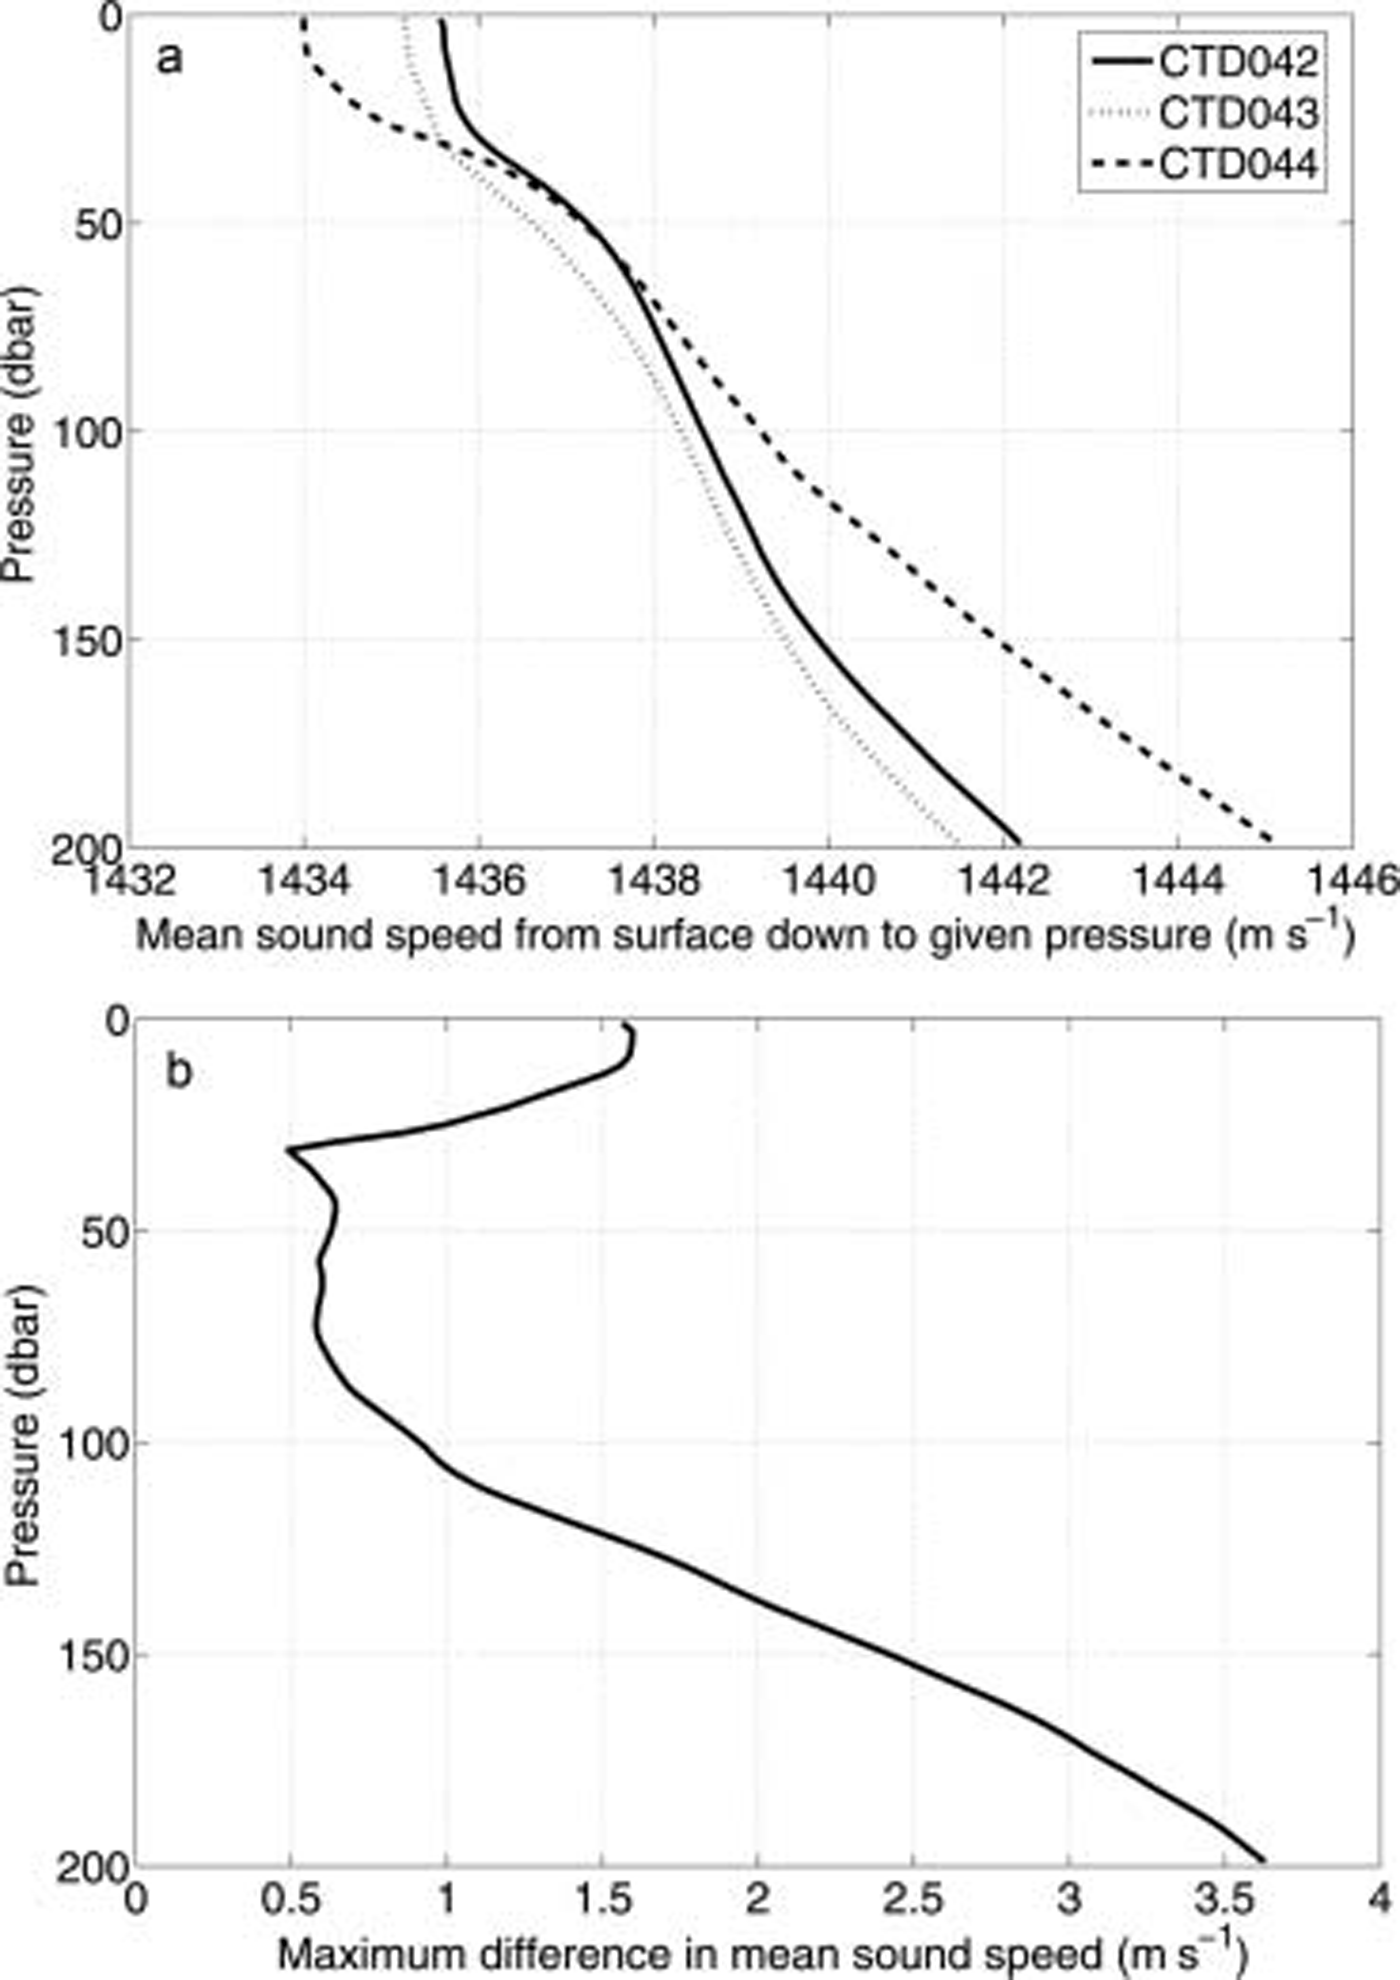
For the three ctd profiles from rrs James Clark Ross we calculated the Sound Speed in 2 dbar bins and then found the average value of all bins from the Surface down to a given pressure (fig. 2a). for each bin the difference between the highest and lowest values of Sound Speed are Shown in figure 2b. most autosub ice-draft data were collected at a depth of approximately 100m (≈100 dbar), which corresponds in figure 2b to a maximum difference in Sound Speed between the three ctd profiles of ∽0.9ms–1. at 100m depth the difference in Sound Speed is equivalent to a difference in measured depth and hence ice draft of the order of 6 cm. this value Sets a limit on the possible accuracy of the method at 100 m depth to be 6 cm.
Plots of (a) mean Sound Speed down to given depth for three CTD profiles; and (b) maximum difference in mean Sound Speed between three CTD profiles.
Method
The details for the three under-ice missions are given in table 1. for each under-ice mission, autosub was deployed in open water close to the ice edge and programmed to fly under the Sea ice following a Series of parallel transects. a collision avoidance System was undergoing testing, and to reduce the possibility of a collision with a deep-keeled iceberg the missions were run at a minimum depth of ∽100 m.
For each data cycle, there are a maximum of four possible values for range to Surface (one for each beam). these four values are initially rotated to give location vectors in the vehicle’s frame of reference in order to take account of the 30˚ vertical offset of the beams and their different horizontal orientations. these vectors are then rotated to take account of vehicle attitude (pitch, roll and heading), and possibly a correction for an offset in alignment between the adcp unit and the attitude Sensors as discussed later, to give coordinates of the ocean Surface with respect to autosub. Subtracting the vertical component of these coordinates from the depth provides a value of ice draft.
The Start and finish of the continuous ice zones have been identified for each of the missions by looking at the profiles of ice draft against time elapsed. only records within these Start and finish values are included for analysis within this paper; readings outside of these areas are considered open water and neglected here. this approach ignores a few cases where there are values of ice draft outside the region of continuous ice, but these are limited and relate to individual floes or icebergs within open water.
Data processing
For each mission a number of data points have been removed representing noise in the data, for example, implausible values of ice draft and where values of range are identical for more than one beam. we believe the latter represents interference from another on-board Sonar System.
We investigated the effects on ice-draft measurements based on values, in particular extreme values, of pitch, roll and changes in vehicle depth. within the values of vehicle pitch and roll experienced, there was no evidence of ice-draft values being biased, because results at extreme values of ice draft occurred with as much regularity with near-zero values of pitch and roll as they did with extreme values of pitch and roll. however, changes in depth between Successive readings did have a noticeable effect on values of ice draft as Shown in figure 3. Studying figure 3 and the distribution of changes in depth, a value of 12cm was chosen as the absolute maximum value that depth could vary by from the previous reading. values of readings outside of this cut-off (i.e. less than –12 cm or above 12 cm) are treated as missing data. for m321 this resulted in 11% of ice-draft values being rejected (i.e. autosub maintained its depth to within 12 cm of the previous measurement in 89% of cases).
Plot of change in vehicle depth from previous reading (2 S previously) against measured value of ice draft, Showing a trend in higher ice draft with larger values of changes in depth. The vertical dashed lines Show the ±12cm limit explained in the text. Mission is M321.

Maximum range and Signal attenuation
Rd instruments, the manufacturer of the adcp, recommend a maximum range to Surface of a ∽300 khz adcp System of about 120 m, due to attenuation of the Signal (Rd instruments, 1996). values of range above this contained a large number of Spurious values for ice draft and So all values of range in excess of this were recoded to be missing values.
figure 4 Shows the effect the Surface condition has on the number of returns by plotting histograms of the percentage of Surface returns when the vehicle depth was 90–115m for two missions, one under ice and one in open water. m318 was under open water using the Same Set-up of autosub and instrumentation as the under-ice missions (location detailed in table 1). the under-open-water mission (m318) clearly has few returns from the Surface compared with the number of returns from m321 which was under Sea ice. we conclude that there are clearly more returns from an ice-covered Surface than from an open-water Surface. ideally, the range to open water would have been used to verify the depth of the vehicle, but this was not possible due to the non-return of the Signal from open water.
Histograms of the percentage of Surface returns when the vehicle depth was 90–115m for two missions M318 (open water) and M321 (under ice). N is the number of valid data cycles. Note mission M318 gives relatively few Surface returns.

There exist within the dataset a large number of pings that contain values of zero for range. these occur because if no return Signal was received by the adcp, then the range was recorded as zero. it is not possible to detect whether these zero ranges relate to no return from open water or if there was another reason, Such as the Surface being out of range. as the vehicle was moving at a considerable Speed (∽1.5ms–1), it is not possible to use averaging techniques over Successive readings unlike work using fixed upward-looking Sonars.
Offset in Adcp instrument
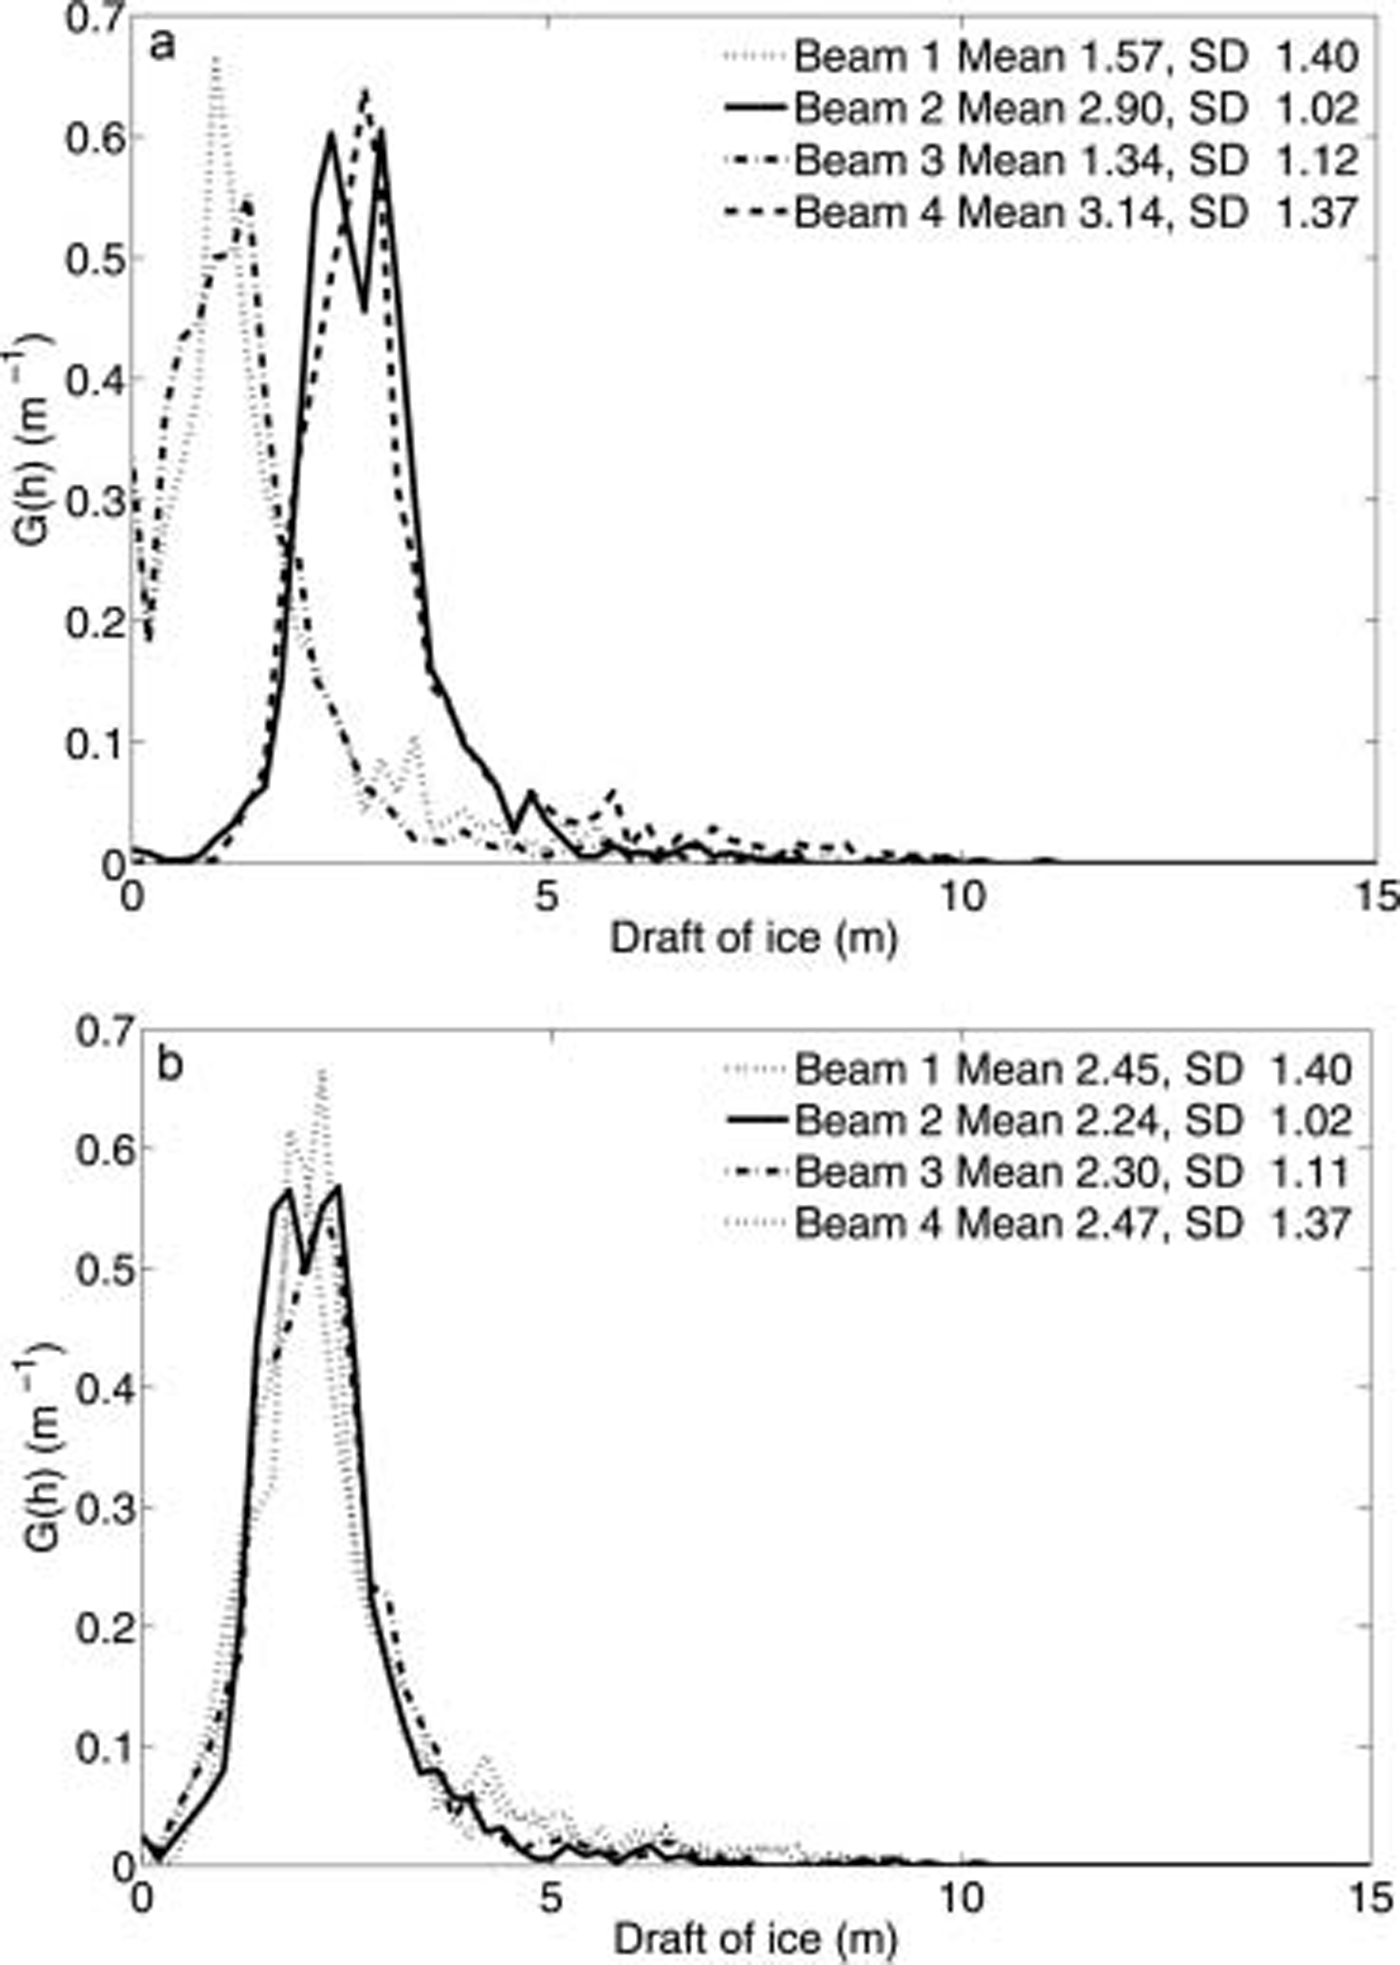
At this Stage, the values of ice draft for each of the four beams were compared and found to differ Significantly as Shown in the preliminary pdfs for m321 in figure 5a, and the Same pattern is repeated for the other two missions. the discrepancy can be removed by adjusting the orientation of the adcp unit with respect to the vehicle’s attitude Sensors (pitch and roll) as demonstrated in figure 5b. the values of offsets for pitch and roll were found by minimizing the differences between the means from each of the four beams. the values, obtained by experimentation, were 1.15˚ for pitch and 0.03˚ for roll. it is possible that there is a Similar difference in the heading of the auv and that of the adcp, but this does not affect derived values of draft.
Preliminary PDFs for the four beams for M321 Showing (a) different locations of modes and (b) the Same plot when pitch-and-roll offsets are applied as described in the text. Beams 1 and 3 are forward-looking, whereas beams 2 and 4 are backward-looking.
When all of the above corrections were complete, the data from the four individual beams were combined and the frequencies of ice drafts assigned to 20 cm bins, with the first bin centred on zero, and hence any value with a draft of less than –10 cm was considered as missing data.
Comparing mission means
A useful question to ask is whether the distributions of ice draft from each of the missions are Significantly different from each other. we use an analysis of variance (anova) to test the hypothesis that the means of the three missions are equal. two post hoc tests were performed to identify differences in the means between missions. the first, the least Significant difference (lsd) test, is a liberal test and hence the most appropriate for Showing no Significant difference in mean between missions. the Second, the Scheffé test, is a conservative test and hence appropriate for the opposite case that there is a Significant difference. given the large Sample Sizes, the ice draft for each mission is approximately normally distributed.
Results
Preliminary results
Within the data are values for the draft of glacial ice. whilst very large values of ice draft can be accounted for by icebergs, the cut-off value at which this occurs is not obvious, as it is of course possible and likely to have both bergy bits and Sea ice with a draft of 2–3 m.
Studying the distributions for the three missions, an attempt could be made to remove Some of the Signal attributable to icebergs. for both m323 and m324, there were negligible numbers of cases of ice draft above 14m, and for m321 there were no values of ice draft above 10.3 m. a value of 14 m was chosen as the cut-off for large icebergs; this only represents a Small proportion of the data (<0.1%).
Final results
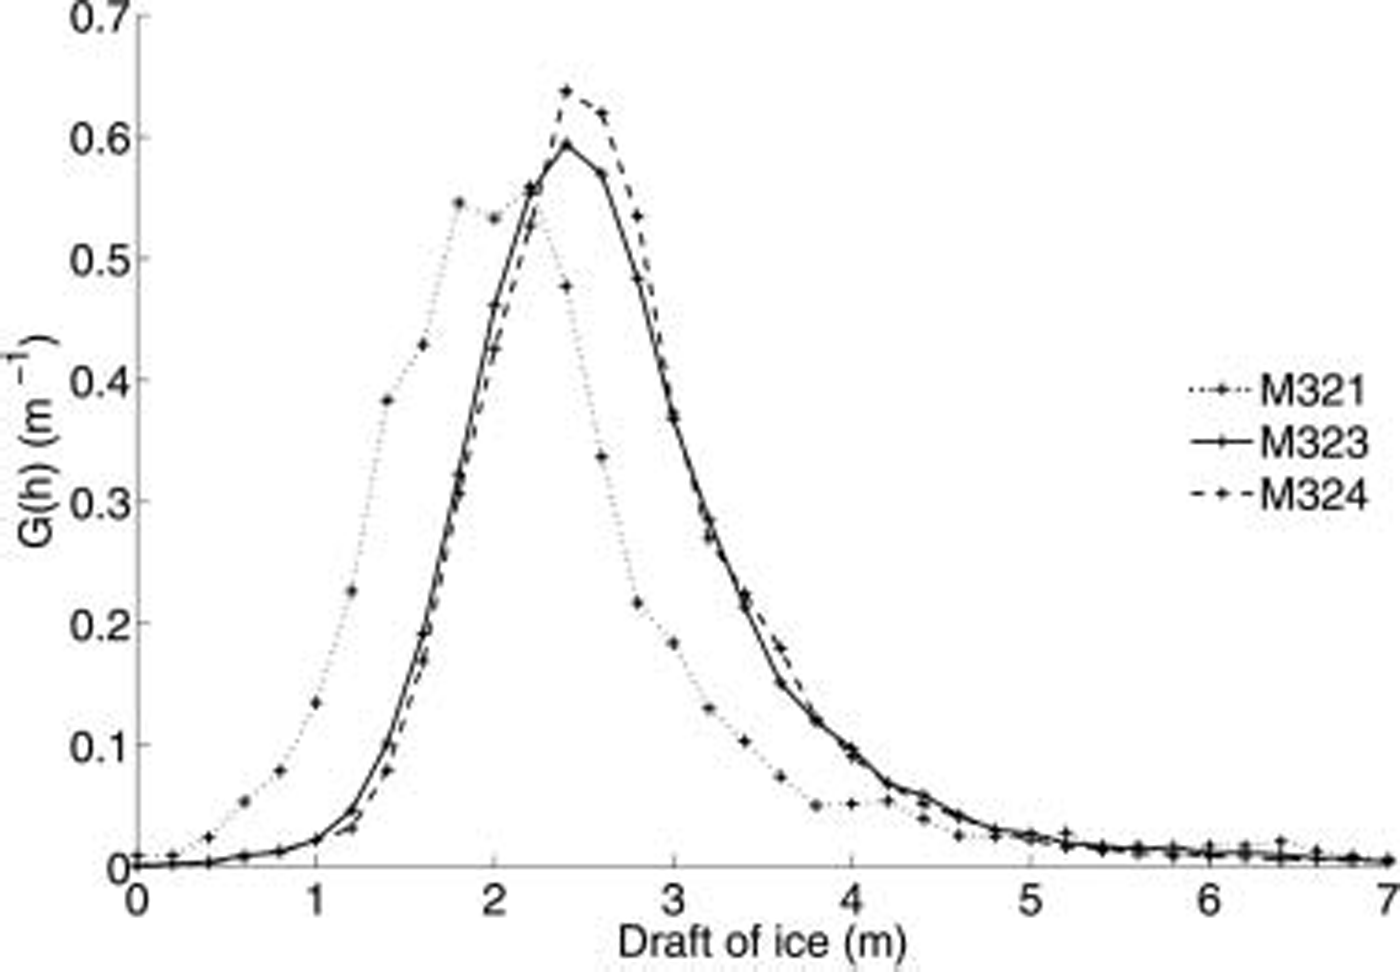
figure 6 Shows the ice profile beneath the Surface for m321 from a Single beam (forward, Starboard beam) at the beginning of the continuous ice zone. the keels of pressure ridges are clearly visible in figure 6, as the drafts are noticeably greater compared with the majority of data, which have drafts between 1 and 4 m. this pattern is further exemplified in figure 7, which Shows the pdfs of ice draft, with the bulk of the ice-draft values for m321 also between 1 and 4 m. the difficulties in obtaining unambiguous values of zero draft are Shown in figure 7 as the lack of the expected peaks for open water (at h = 0 m). at the mission depth of 100 m the Size of the footprint for each of the adcp beams is a few metres on the Surface. figure 7 Suggests that in general the ice draft in m321 is less than that in m323 and m324. these observations are confirmed in table 2, where the modal bins for m323 and m324 are highest centred at 2.4m compared with m321 at 2.2 m. the mean of m324 is highest at 2.76 m, next highest is m323 at 2.74 m, and the Smallest mean draft is 2.36 m for m321. this rank ordering is repeated with the medians of 2.58 m, 2.56m and 2.12 m for m324, m323 and m321 respectively.
Sample plot of distance travelled (from Start of Section) against ice draft from Start of under-ice region for M321 from a Single beam.

Pdf for measurements of ice draft in the range up to 7m draft from M321, M323 and M324 without values for open water (h=0m).
Descriptive Statistics on ice draft from the three under-ice missions
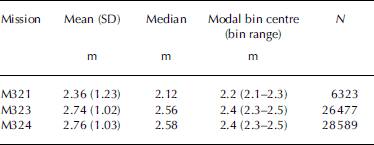
The Standard deviations for m323 and m324 are very Similar, whereas that for m321 is larger. all of the missions have long upper tails, which could be because of the presence of bergy bits within the Sea-ice zone. m321 has more values of ice draft at lower values and this probably explains the apparent higher variability.
An anova of the ice-draft data indicates that the values of ice draft for the three missions do not come from a Single population (F = 384.6, Sig. = 0.000), i.e. the ice draft changes along the ice front. using the Scheffé test, m321 is clearly different from both m323 and m324 (significance in both cases is 0.000), but the difference between m323 and m324 is not Significant (sig. = 0.090). the lsd test also indicates Significant differences between m321 and the other two missions and also Suggests that m323 and m324 do not have the Same mean (sig. = 0.028).
Discussion and Conclusions
We have presented the pdfs for the three under-sea-ice missions Showing the general agreement in Shape. the Single mode for each mission Suggests that there is only one major ice type within each of the missions. however, an adjustment to the distributions is required because the data do not contain values for open water, as these were not recorded at the depth that the vehicle was operating at.
Anova techniques have Shown that the mean of m321 is Statistically different from the other missions. figure 1 Shows that m321 is further away from m323 than m323 is from m324, and, although the three missions were not carried out Simultaneously, there is only about 3 days difference between the periods of data collection. we conclude that the differences between m323/m324 and m321 are Spatial and not temporal, i.e. the draft of ice varies along the ice front. the difference between m323 and m324 is more complex; the Scheffé test does not Suggest that the null hypothesis that the means are different Should be rejected.
Using the results of the lsd test, we would accept the hypothesis that the means were different, but the lsd test is not as appropriate for testing for a Significant difference. in addition, the analysis does not allow for correlation between the observed measurements, which given the Spatial nature of the data would probably tend to increase the Significance of the results. hence, we conclude that the mean values of the ice drafts of m323 and m324 do not Seem to differ.
The pdfs in figure 7 assume that all pings (i.e. a Single measurement of ice draft from a Single beam) are independent values for ice draft (i.e. take no account of how close the beams are to each other). it may be more appropriate to produce the pdfs using a geostatistical approach taking into account the higher correlation between points that are closer together compared to those further apart. work is Still required to ground-truth the distributions by comparing the results reported here with Simultaneous Ship-borne observations using the approach documented in Reference WorbyWorby (1999). these observations allow us to make estimates of the missing open-water proportions for each of the missions. for both m323 and m324, the nearest Ship-based observations of ice concentration are 100% ice cover, whereas for m321 the closest observation is 60% ice cover. as Such, we are more certain of the pdfs of Sea-ice draft for m323 and m324, as there is probably no open water present, whereas for m321 we are not accurately representing the true pdf. the antarctic ice chart for the region issued by the us national ice center for the period 24–28 march 2003 Supports the observation that the region around m321 has a lower concentration of Sea ice than that around m323/m324 (∽70–90% for m321 compared with 90–100% for m323/m324).
The distributions of ice draft Show a number of values in the long upper tails, most likely as a result of icebergs within the Sea ice. it is not clear how to account for icebergs within the Sea-ice Signal apart from using an arbitrary cut-off in draft that will not remove Smaller icebergs and conversely could remove large pressure ridges. a future paper will investigate the Spatial distribution of icebergs within Sea ice to establish whether the icebergs are randomly distributed in Space and can be included in the pdf as they represent icebergs over a larger area.
We do note that whilst for late Summer there are limited Sea-ice draft/thickness data in the region of the autosub missions, Reference HaasHaas (1998) reported combined Snow and ice thickness with a mean of 3.12 m and modes at 2.7 and 3.1 m determined with an electromagnetic Sensor. these are comparable to our data, and hence increase confidence in our method and results. the pdf for the combined thickness of ice and Snow reported in haas indicates that most values are between zero and 6 m, which is also Similar to the values reported here (fig. 7).
We believe we have Shown the potential for using adcp on an auv to measure ice draft, although the depth of the vehicle is a critical factor. depth is not only a factor in the Strength of the returned Signal but also impacts because of the relatively large beamwidth (2.2˚) Spreading the insoni-fied area as the depth increases, an effect enhanced by the 30˚ beam offset from the vertical. future work using adcp on an auv to measure ice draft will have to consider the beamwidth and depth of the vehicle and hence the footprint. the relative locations of the depth and attitude Sensors with respect to the adcp, which ideally Should be as close as possible, must also be taken into account. the benefits of using adcp compared to a uls are that the adcp has four ice-draft measurements per data cycle and can potentially also be used to provide ice velocities.
Acknowledgements
The work was funded by the uk natural environment research council (ner/s/r/2001/06749). thanks to the autosub team at the national oceanography centre (noc), Southampton, in particular S. mcphail, and to the officers and crew of rrs James Clark Ross. also thanks to k. Stansfield of noc and povl abrahamsen of the british antarctic Survey for their invaluable advice. this paper was improved by the useful advice of j. morison (scientific editor), d. hayes of the university of cyprus and one anonymous reviewer.



