Introduction
Active crop canopy sensors are commonly used to estimate rice nitrogen (N) status at key crop growth stages to guide in-season top-dressing or side-dressing N application to improve N use efficiency (NUE) and reduce negative environmental impacts caused by over-application of N fertilizers (Yao et al., Reference Yao, Miao, Huang, Gao, Ma and Zhao2012). The GreenSeeker sensor with two vegetation indices (VIs), the normalized difference vegetation index (NDVI) and the ratio vegetation index (RVI), has been used to estimate rice N nutrition index (NNI) (Yao et al., Reference Yao, Miao, Cao, Wang, Gnyp and Bareth2014) and the result was not very promising (R2<0.40). One possible approach to improve the estimation of NNI is to use red edge-based VIs, due to their better reported performance for estimating crop N status (Cao et al., Reference Cao, Miao, Wang, Huang, Cheng and Khosla2013 and Reference Cao, Miao, Feng, Gao, Li and Liu2015). RapidSCAN (Holland Scientific Inc., Lincoln, Nebraska, USA) is a new portable active canopy sensor with three wavebands including red (670 nm), red-edge (730 nm), and near infrared (780 nm) regions. How much improvement can the red edge-based VIs obtained from this sensor improve the estimation of NNI at key rice growth stage for guiding topdressing N application compared with NDVI or RVI?
Another approach to improve the estimation of NNI is to use N sufficiency index (NSI), values normalized to a non-limiting N reference area that can offset confounding factors (Tremblay et al., Reference Tremblay, Fallon and Ziadi2011). Xia et al. (Reference Xia, Miao, Wu, Shao, Khosla and Mi2016) found that NDVI or RVI-based NSI could significantly improve estimation of spring maize NNI than using original NDVI or RVI. Will the performance of the red edge-based VIs be further improved using NSI for estimating rice NNI?
The objectives of this study were to determine how much improvements would red edge-based VIs obtained using the RapidSCAN sensor achieve for estimating rice NNI at stem elongation (SE) stage and if their performance could be further improved using the NSI approach.
Materials and methods
Study site and experiment design
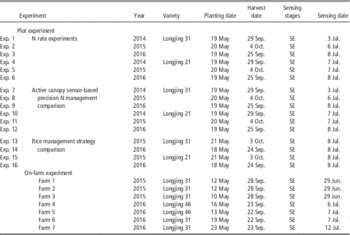
The study was conducted in Sanjiang Plain, Heilongjiang Province, Northeast China (47.2°N, E132.6°). Sixteen plot experiments were conducted from 2014 to 2016 at Jiansanjiang Experiment Station of China Agricultural University, involving two different varieties, different N rates, and different sensor-based N management strategies and different precision rice management strategies (Table 1). N fertilizer was generally distributed in three splits: 40% as basal N before transplanting, 30% at tillering stage and 30% (or determined according to crop sensor-based N recommendation strategies) at the stem elongation stage. EXP. 1–6 had the same five N rates (0, 40, 80, 120 and 160 kg N ha−1). The total N rates of active canopy sensor-based precision N management comparison (EXP. 7–12) were about 120 kg N ha−1, and the specific amount of N applied was determined according to crop sensor-based N recommendation strategies at stem elongation stage. The rice management strategy comparison experiments all had seven rice management strategy treatments: (i) the control treatment, with 0 kg N ha−1, (ii) farmer’s practice, with 150 kg N ha−1 as total N rates, (iii) regional optimum rice management, with 110 kg N ha−1 as total N rates, (iv) GreenSeeker-based precision rice management, (v) Crop Circle-based precision rice management system 1, (vi) Crop Circle-based precision rice management system 2, and (vii) Crop Circle-based precision rice management system with both chemical and organic fertilizers. The total N rates of the treatment iv to vii were about 110 kg N ha−1 on the basis of regional optimum rice management, and the specific amount of N applied was determined according to crop sensor-based N recommendation strategies at stem elongation stage or heading stage. All plot experiments were replicated three times in a randomized complete block design. The N source was granular urea. For all the treatments, 50 kg P2O5 ha−1 in the form of Ca(H2PO4)2 was applied before transplanting and 105 kg K2O ha−1 was applied as two splits: 50% before transplanting and 50% at stem elongation stage. Rice seedlings were prepared in a greenhouse and transplanted into the experimental fields.
Detailed information about the experiments conducted in this study.

In addition to the above mentioned sixteen plot experiments, seven on-farm experiments were conducted in cooperation with farmers (three fields in 2015 and four fields in 2016) in two villages of Qixing Farm in Jiansanjiang, Heilongjiang Province, under on-farm conditions (Table 1). Treatments in each experiment were three rice management strategies including farmer’s practice (FP), regional optimum rice management (RORM), and active canopy sensor-based or UAV-based precision rice management (PRM).
RapidSCAN-based sensing data collection
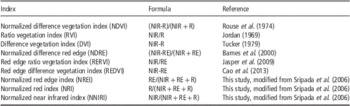
The RapidSCAN portable active sensor was used to collect canopy reflectance data at 0.7–0.9 m above rice canopy at a consistent speed in each plot. The average reflectance values were used to represent each plot. Nine VIs were evaluated in this study (Table 2).
Spectral indices used in this study

Plant sampling and measurement
Right after collecting sensor data at SE stage, plant samples of above ground biomass were taken by random clipping three hills according to the average tillering numbers in each plot. All samples were rinsed with water, and the roots were removed. The samples were separated into leaves and stems, which were put into oven for deactivation of enzymes under 105°C for half an hour, and then dried at 80°C until constant weight and weighed. Aboveground dry matter was determined. N concentration was analyzed using the Kjeldahl-N method.
Calculation of nitrogen nutrition index
The NNI was calculated following Lemaire et al. (Reference Lemaire, Jeuffroy and Gastal2008):
 $${\rm NNI \,{\equals}\, N}_{{\rm a}} {\rm /N}_{{\rm c}} $$
where Na is the actual measured N concentration and Nc is the critical N concentration as determined using the critical N dilution curve developed by Huang et al. (Reference Huang, Miao, Zhao, Yuan, Ma and Tan2015) for rice in Northeast China.
Statistical analysis
Data collected from the plot experiments and on-farm experiments were pooled together and then randomly divided into calibration dataset (67% of the observations) and validation dataset (33% of the observations). The coefficients of determination (R2) for the relationships between VIs and NNI were calculated using SPSS 18.0 (SPSS Inc., Chicago, Illinois, USA), and the models with the highest R2 were selected. In addition to R2, the performance of the model for predicating rice status indicators was also evaluated using the root mean square error (RMSE) and the relative error (RE).
NSI values were determined using RapidSCAN-based VIs of check plots or plots receiving normal N rates divided by that of N-rich plots (plots receiving sufficient N supply). In this study, the plots of 160 kg N ha−1 and farmer’s practice in on-farm experiments with sufficient N supply (126 to 160 kg N ha−1) were used as N rich plots, and their average VI values were used for NSI calculation.
Results
Red edge-based vegetation indices vs. NDVI and RVI
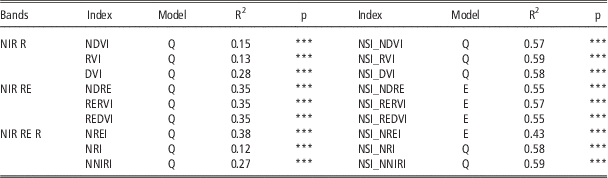
Across site-years and varieties at SE stage, two band red edge-based normalized difference red edge (NDRE), red edge ratio vegetation index (RERVI) and red edge difference vegetation index (REDVI) had similar relationship with NNI (R2=0.35), which were all better than NDVI (R2=0.15), RVI (R2=0.13) and DVI (R2=0.28). For three band VIs, the normalized red edge index (NREI) had the highest correlation with NNI (R2=0.38) among all the tested VIs (Table 3).
Coefficients of determination (R2) for the relationships between vegetation indices (VIs) and N Sufficiency Index based on vegetation indices (NSI_VIs) calculated from RapidSCAN and N nutrition index (NNI) at stem elongation (SE) stage across sites, varieties and years.

L, Q, E, P and Log denote linear, quadratic, exponential, power, logarithmic fit. *, ** and *** mean significance at p<0.05, 0.01, 001, respectively. NS means no significance at p>0.05.
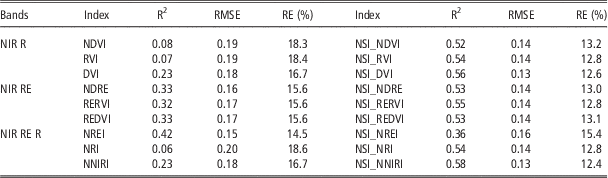
The validation results confirmed that NREI (R2=0.42, RE=14.5%) had the best performance to estimate NNI. For two band VIs, red edge-based VIs (R2=0.32–0.33, RE=15.6%) had better performance than NDVI and RVI (R2=0.08 and 0.07, RE=18.3% and 18.4%, respectively) (Table 4).
Validation results of vegetation indices (VIs) and N sufficiency index based on vegetation indices (NSI_VIs) calculated from RapidSCAN for estimating N nutrition index (NNI) at stem elongation (SE) stage across sites, varieties and years

RMSE: root mean square error; RE: relative error, RE in %.
Vegetation indices vs. vegetation index-based nitrogen sufficiency indices
Compared with the weak correlation of VIs to NNI at SE stage, the NSI calculated from VIs (NSI_VIs) were more strongly related to NNI (Table 3). All NSI_VIs had improved performances (R2=0.43–0.59) than their corresponding original VIs (R2=0.12–0.38) at SE stage.
The validation results also confirmed this observation (Table 4). All the NSI_VIs except NSI_NREI (R2=0.52-0.58, RMSE=0.13-0.16, RE=12.4–13.2%) had better performance than their corresponding original VIs (R2=0.07–0.33, RMSE=0.16-0.20, RE=15.6–18.6%) at the SE stage. The NSI_NNIRI (R2=0.58, RMSE=0.13, RE=12.4%) performed the best among all tested VIs and NSI_VIs.
Conclusion
The performance of red edge-based vegetation indices (VIs) for estimation of rice NNI was better than NDVI and RVI. Across site-years and varieties at the SE stage, red edge-based indices, NDRE, RERVI and REDVI, had similar relationship with NNI (R2=0.35), which were all better than NDVI (R2=0.15) and RVI (R2=0.13). For three band VIs, NREI (R2=0.38) had the best correlation with NNI among the tested VIs. Nitrogen sufficiency index calculated from RapidSCAN original vegetation indices (R2=0.43–0.59) were more stable and more strongly related to NNI than the corresponding VIs (R2=0.12–0.38). The validation results confirmed this observation. More studies are needed to further evaluate the red edge-based vegetation indices and NSI_VIs for the diagnosis of rice N status under-diverse on-farm conditions in Northeast China.