




No CrossRef data available.
A CONVERGENT t-STATISTIC IN SPURIOUS REGRESSIONS
Published online by Cambridge University Press: 01 October 2004
Abstract
This paper investigates the asymptotic properties of the t-statistic in spurious regressions when the bandwidth in the estimation of the heteroskedasticity and autocorrelation consistent (HAC) standard error is set proportional to the sample size. Using autocovariances of large lags, the so-defined HAC estimator is capable of capturing the high persistence of the regressor and regression residuals. It is shown that the resulting t-statistic converges to a nondegenerate limiting distribution for all cases of spurious regressions considered in the literature. This finding sheds some new light on the nature of spurious regressions.I am very grateful to Bruce Hansen and two anonymous referees for helpful comments and suggestions. All remaining errors and omissions are mine alone.
Information
- Type
- Research Article
- Information
- Copyright
- © 2004 Cambridge University Press
1. INTRODUCTION
Since the first Monte Carlo study by Granger and Newbold (1974), many efforts have been made to understand the nature of spurious regressions. Phillips (1986) develops an asymptotic theory for a regression between I(1) processes, showing that the usual t-statistic does not have a limiting distribution but diverges at the rate of

as the sample size T increases. Extending the approach of Phillips (1986), Durlauf and Phillips (1988) and Marmol (1995, 1998) find that the usual t-statistic diverges at the same rate in a regression between an I(1) process and a linear trend and between two nonstationary I(d) processes. More recently, Tsay and Chung (2000) have found that the usual t-statistic diverges, albeit at a slower rate, in a regression between two stationary I(d) processes, as long as their memory parameters sum to a value greater than 0.5. The divergence of the usual t-statistic seems to be a defining characteristic of a spurious regression. In this paper, we show that the divergence of the usual t-statistic arises from the use of a standard error that underestimates the true variation of the ordinary least squares (OLS) estimator. We propose an alternative estimator of the standard error and use it to construct the t-statistic. We show that the resulting t-statistic no longer diverges.
The standard error estimator we used is the heteroskedasticity and autocorrelation consistent (HAC) standard error estimator with bandwidth (M) proportional to the sample size. Specifically, we set M = bT for some b ∈ (0,1] . This sharply contrasts with the usual HAC estimator in that the bandwidth is usually taken to grow at a slower rate than the sample size. We show that when M = bT, the t-statistic converges to a well-defined distribution. This is true for spurious regressions between two independent fractional processes, stationary or nonstationary, and between a fractional process and a linear trend. Our finding suggests that inferences based on the new asymptotic theory and critical values obtained via simulations will not lead to the finding of a spurious relationship. This result sheds some new light on the nature of spurious regressions. The inevitable significance of the usual t-ratio can be attributed to the use of a small bandwidth (M = o(T)) in the HAC estimation.
For all the cases considered, the limiting distributions are nonstandard and depend on the memory of the underlying processes. If memory parameters are known, these limiting distributions can be simulated using Monte Carlo experiments. However, in practice memory parameters are generally unknown. Given the nonstandard distribution that is not nuisance parameter free, the new asymptotic theory is more of theoretical interest than of practical importance. In fact, when the underlying processes are I(d), a narrow-band frequency-domain approach may dominate the time-domain approach employed in this paper. Robinson (1994) provides such an example. In view of these observations, this paper should be viewed as a theoretical investigation that helps deepen the understanding of spurious regressions.
The results of this paper are related to those of Kiefer and Vogelsang (2003). They consider the specification of M = bT in hypothesis testing when the time series are weakly dependent. In their framework, different specifications (M = bT or M = o(T)) simply give rise to different approximations. In finite samples, any observed value of the pair (M,T) may be regarded as compatible with M = bT or M = o(T). We can thus use the approximation that appears to be more accurate. These discussions apply to spurious regressions also. The difference is that in the usual regression the t-statistic converges regardless of whether M = bT or M = o(T), whereas in the spurious regression the t-statistic converges when M = bT and diverges when M = o(T). Other related papers that investigate the HAC estimator without truncation include the work of Robinson (1998), who provides conditions under which the HAC estimator without smoothing is consistent, Kiefer and Vogelsang (2002a, 2002b), who develop asymptotically valid tests in usual regressions under the specification M = T, Jansson (2004), who studies the accuracy of the M = T approximation for Gaussian location models, and Phillips, Sun, and Jin (2003a, 2003b), who propose a new family of kernels for HAC estimation without a bandwidth parameter.
The rest of the paper is organized as follows. Section 2 considers the spurious regressions with nonstationary fractional processes and linear trends. It establishes the asymptotic distributions when M = bT for some positive b. Section 3 extends the results in Section 2 to stationary fractional processes. Section 4 provides kernel estimates of the probability densities of the limiting t-statistics in Sections 2 and 3. Section 5 concludes. All proofs are given in the Appendix.
Throughout the paper, ⇒ signifies weak convergence in the D[0,1]k space endowed with the Skorohod topology; 1{·} is the indicator function; [·] signifies the integer part.
2. SPURIOUS REGRESSIONS WITH NONSTATIONARY PROCESSES
Consider the following data generating process:

where xt and ut are nonstationary I(d) processes such that

where dx, du > ½ and εxt and εut are two weakly dependent processes. For simplicity, we assume that xt is a scalar process. The results of this paper easily can be extended to multivariate cases.
We further assume that xt and ut satisfy the following functional central limit theorem (FCLT):

where

W(s) = (Wx(s),Wu(s))′ is a bivariate Brownian motion with positive definite long-run variance

The FCLT holds under a wide range of primitive conditions (e.g., Marinucci and Robinson, 2000). When xt and ut are unit root processes, the limiting process V(r) = (Vx(r),Vu(r))′ reduces to a scaled Brownian motion. For a general nonstationary fractional process, the limiting process is a type II fractional Brownian motion (Marinucci and Robinson, 1999).
When du ≥ dx, there is no cointegrating relationship between yt and xt, and we have a spurious linear model. When du < dx, yt and xt are fractionally cointegrated with cointegrating vector (1,−β). However, because the long-run equilibrium error ut is nonstationary, Marmol (1998) refers to the second situation as a partially spurious case. For convenience, we will refer to both cases as spurious cases.
Consider regressing yt on a constant and xt,

The OLS estimate of β is given by

where

. The heteroskedasiticity and autocorrelation consistent t-statistic is

, where

is the HAC estimator defined as

where


k(·) is a kernel function, and M is the bandwidth parameter.
To get a consistent estimate of the long-run variance of

, conventional asymptotic theory assumes that M → ∞ such that M = o(T). However,

is nonstationary, and the variance of

does not converge. In other words, the sum

is infinite with the probability approaching one as T → ∞. The infiniteness of this sum invalidates the usual truncation argument. As becomes clear later on, when M is taken to grow at a slower rate than T, the estimate

underestimates the variability of

by an order of magnitude. The resulting t-statistic will diverge, leading to the spurious rejection. A natural question is: what if M grows at the same rate as T? In the rest of the paper, we set M = bT for some b ∈ (0,1] and provide an answer to this question. For convenience, we call the asymptotics under the assumption of M = bT the large M asymptotics.
To ensure the positive definiteness of

, we assume that the kernel function belongs to the following class:

where

The class

is similar to class

in Andrews (1991).
The following theorem establishes the asymptotic distributions of

, and the resulting t-statistic

. The theorem uses the following notation:


and

THEOREM 1. Assume that xt and ut satisfy the FCLT in (3) and yt is generated by (1). Let k(x) be a continuous function in

and M = bT for b ∈ (0,1]. Then, as T → ∞,

Theorem 1 shows that when M = bT, the HAC estimator delivers a standard error estimate that is of the same stochastic order as

. Based on such a HAC estimate, the t-statistic is stochastically bounded and converges to a well-defined distribution. In contrast, the conventional variance estimator (also called the OLS variance estimator), which is

, ignores the autocorrelation in the underlying processes and underestimates var(

) by an order of magnitude. When the OLS estimator is normalized by the conventional standard error estimate, the resulting t-statistic is bound to diverge. The rate of divergence is

, as shown by Phillips (1986) and Marmol (1998).
Our finding is consistent with a result by Phillips (1998), who considers regressing a unit root process on a complete orthonormal system in L2 [0,1]. He shows that the t-statistic based on the usual HAC standard error with bandwidth M is of order Op((T/M)1/2). From this, one may deduce heuristically that when M = bT, the t-statistic is stochastically bounded, whereas when M = o(T), the t-statistic diverges at the rate of

.
Now we consider the spurious regression between a nonstationary I(d) process and a linear trend. The data generating process for ut is the same as before so that the invariance principle in (3) holds for T−(2du−1)/2u[Tr]. The data generating process for xt is replaced by xt = t so that T−(2dx−1)/2x[Tr] → r for

. Using arguments similar to the proof of Theorem 1, we can prove the following theorem immediately. The details are omitted.
THEOREM 2. Assume that xt = t, ut satisfies the FCLT in (3), and yt = α + βt + ut. Let k(x) be a continuous function in

and M = bT for b ∈ (0,1]. Then

where

Theorem 2 shows that when M = bT, the t-statistic is convergent, as in the case of a regression between two nonstationary fractional processes. In contrast, the usual t-statistic diverges at the rate of

(see Durlauf and Phillips, 1988; Marmol and Velasco, 2002).
Results similar to Theorem 2 have also been obtained by Marmol and Velasco (2002), who analyze the effects of spuriously detrending a nonstationary fractional process. Put in our context, they used the long-run variance estimate of the form:

where

. As a result of the difference in the construction of the variance estimate, their limiting distributions are different from ours. Nevertheless, the basic message is the same: it is necessary to let M = bT to deliver a convergent t-statistic.
Together with Theorem 1, Theorem 2 shows that when M = bT, the t-statistic converges in distribution in the spurious regression with nonstationary fractional processes. This finding implies that the t-test based on the large M asymptotics will not point to a significant relationship between two independent processes.
3. SPURIOUS REGRESSIONS WITH STATIONARY PROCESSES
In this section, we consider the regression between two stationary I(d) processes and that between a stationary I(d) process and a linear trend.
The first data generating process we consider is the same as that in Chung (2002). For completeness, we briefly describe the data generating process. We assume that yt is generated according to

where (xt,ut)′ is a vector linear process defined by

εt = (ε1t,ε2t)′ is a martingale difference sequence with respect to the natural filtration

for some matrix Σ, and {Ψj} is a sequence of 2 × 2 matrices. As in Chung (2002), we maintain the following assumptions.
A1. For some δ > 0,

, a.s. for i = 1 and 2.
A2. For some nonsingular constant matrix Π,

where ∼ means the ratio of the left- and right-hand-side elements tends to one and Γ(·) is the gamma function.
A3. 0 < dx,du < 0.5.
Define the random vector element

Under Assumptions A1–A3, the following lemma holds.
LEMMA 3. Let Assumptions A1–A3 hold. If dx + du > ½, then

where

Here ξ+d = [max(0,ξ)]d and (Wx(t),Wu(t))′ is a vector Brownian motion with variance matrix ΠΣΠ′.
Note that Bdx(r) and Bdu(r) are type I fractional Brownian motions (Marinucci and Robinson, 1999). Lemma 3 shows that the partial sum of a fractional process converges to fractional Brownian motion. This result is not new and has been proved by numerous authors, including Davidson and de Jong (2000) and Chung (2002). Lemma 3 also shows that the partial sum of the product process xtut converges to the non-Gaussian process Z(r). This result is obtained by Chung (2002, Theorem 2) but under the stronger assumption that dx,du ∈ (0.25, 0.5). A careful inspection of Chung's proof reveals that his Theorem 2 holds as long as dx + du > ½.
Using Lemma 3 and following the same steps as the proof of Theorem 1, we can establish the asymptotic distributions of

, and the t-statistic in the following theorem.
THEOREM 4. Let Assumptions A1–A3 hold. Assume that k(x) is a twice continuously differentiable function in

and M = bT for b ∈ (0,1]. If dx + du > ½, then

where

The theorem shows when xt and ut are correlated, the OLS estimate of β will be inconsistent. To facilitate the comparison with the existing literature on spurious regression between stationary long memory processes, we assume σux = 0 in the discussion that follows. It should be noted that when dx > du, β can be consistently estimated using a frequency domain approach even if σux ≠ 0 (cf. Robinson, 1994).
When σux = 0, Theorem 4 reveals the convergence of the t-statistic when M = bT. In contrast, Tsay and Chung (2000) show that the t-statistic based on the OLS standard error diverges at the rate of Tdx+du−0.5. As a consequence, the slope coefficient in the regression between two independent stationary long memory processes can be spuriously significant. The convergence of the t-statistic under the new asymptotics has profound implications. Note that the OLS estimator

is consistent, the R2 converges to zero, and the Durbin–Watson (DW)-statistic does not approach zero (Tsay and Chung, 2000). The behaviors of

, R2, and DW are thus the same as in the case of no spurious effect. The only qualitative difference is the divergence of the usual t-statistic. Therefore, under the large M asymptotics, all of the statistics behave as in the case of usual regression. Hence, inferences based on the large M asymptotics will not result in finding a significant relationship that does not actually exist. We may conclude that there is no spurious effect between two independent stationary long memory processes, as long as M is allowed to grow at the same rate as T and correct critical values are employed.
The preceding theorem assumes that the kernel function is twice continuously differentiable. This excludes the widely used Bartlett kernel. The following theorem establishes the asymptotic distributions of

, and the t-statistic when the Bartlett kernel is employed.
THEOREM 5. Let Assumptions A1–A3 hold. If k(x) = (1 − |x|)1{|x| ≤ 1}, M = bT for b ∈ (0,1], and dx + du > ½, then Theorem 4 holds with

replaced by

Tsay and Chung (2000) show that when a stationary I(d) process is regressed on a linear trend, the usual t-statistic diverges at the rate of Td. We proceed to investigate whether this is the case when M = bT. To this end, we assume that ut satisfies the FCLT as before:

Using summing by parts and the continuous mapping theorem, we have

Let

Then we can prove the following theorem using (26) and (27) and arguments similar to the proof of Theorem 4. Details are omitted.
THEOREM 6. Let xt = t and ut satisfy (26) with du ∈ (0,½). If k(x) is a twice continuously differentiable function in

and M = bT for b ∈ (0,1], then


If k(x) = (1 − |x|)1{|x| ≤ 1}, then (29), (30), and (31) hold with

replaced by

Theorem 6 shows that the OLS estimator is consistent and the t-statistic converges as in other cases. Therefore, detrending a stationary fractionally integrated process will not lead to the spurious effect of finding a significant trend, as long as critical values from the large M asymptotics are used.
4. KERNEL ESTIMATES OF ASYMPTOTIC DISTRIBUTIONS
The limiting distributions of

are nonstandard. In this section, we use Monte Carlo simulations to approximate their probability densities. Our goal is to see how the new limiting distribution differs from the standard normal distribution and to what extent the use of M = bT helps reduce the spurious effects.
For simplicity, we assume that there is no correlation between {xt} and {ut}. In this case, it suffices to simulate simple fractionally integrated processes. Specifically, we generate the fractional processes xt and ut according to (1 − L)dxxt = εxt and (1 − L)duut = εut, where εxt ∼ iidN(0,1), εut ∼ iidN(0,1) for t > 0, εxt = εut = 0 for t ≤ 0, and {εxt} is independent of {εut}. Without loss of generality, we let β = 0. For spurious regressions between nonstationary I(d) processes, we consider (dx,du) = (0.6, 0.6), (0.6, 1), (1, 0.6), or (1, 1), and for those between stationary ones, we let (dx,du) = (0.3, 0.3), (0.4, 0.2), or (0.2, 0.4). We let k(·) be the Bartlett kernel and consider the following values of b = 0, 0.025, 0.05,…,1. When b = 0,

becomes

. We use 5,000 replications and a sample size of 1,000. For the results reported here, 10,000 replications are employed.
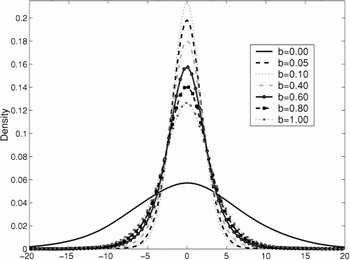
We first examine spurious regressions with nonstationary fractional processes. Figure 1 reports the kernel estimates of the probability densities for the case xt ∼ I(dx), ut ∼ I(du) with dx = du = 0.6. The qualitative results for other (dx,du) combinations are similar. The probability densities appear to be symmetric and are apparently more dispersed than the standard normal density. For example, when b = 0.1, the 95% quantile of the limiting distribution is 3.1012, which is larger than 1.645, the 95% quantile of the standard normal distribution. The quantile is not a monotonic function of b. When b is small, the quantile is decreasing in b, whereas when b is large, the quantile is increasing in b. In other words, when b moves closer to zero or one, the limiting distribution becomes more dispersed. This result is well expected when b is very close to zero. In this case, the behavior of the t-statistic may be better described by the conventional limit theory. However, when b is very close to one, one may think that the limiting distribution should become less dispersed as the variance estimate with a large bandwidth captures the strong autocorrelation in xtut. This is not what is happening. In fact, as b becomes close to one, the variance estimate

does not capture the strong autocorrelation very well. This is because ut is not observed and has to be replaced by the estimated residual

. As a consequence, when k(x) = 1 and b = 1,

is zero by construction. Of course, this is an extreme case. But for other kernels, when b is close to one, the effect of increasing b is similar. The estimate

tends to bias toward zero when

incorporates autocovariances of almost all lags.

Kernel estimates of densities of when xt ∼ I(0.6) and yt ∼ I(0.6).
For all the cases considered, the simulation results indicate that the limiting distribution is least dispersed or close to being least dispersed when b = 0.1. When dx = du = 0.6 and b = 0.1, the probability of

is 28.39%. Therefore, when M = 0.1T, we will erroneously reject the null 28.39% of the times when the wrong critical value is used. In contrast, when M = o(T), the rejection probability goes to one as the sample size increases. When T = 1,000 and the OLS standard error is used, the rejection probability is 75.9%, as shown by simulations. Hence, the use of M = 0.1T reduces the spurious effect substantially.
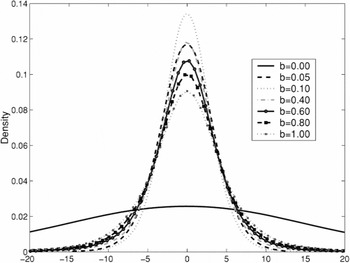
Figure 2 presents the same graph when yt is an I(0.6) process and xt is a linear deterministic trend. The graph is representative of other cases. The qualitative observations made for Figure 1 apply. However, the limiting distributions become more dispersed than those in Figure 1.

Kernel estimates of densities of when xt = t and yt ∼ I(0.6).
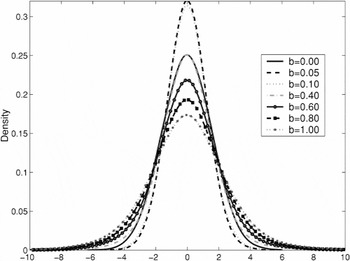
We next consider spurious regressions with stationary fractional processes. Figure 3 graphs the density estimates when (dx,du) = (0.4, 0.2). The density estimates for the other two cases turn out to be close to the case (dx,du) = (0.4, 0.2). The figure shows that the limiting distributions are more concentrated around the origin than in the nonstationary cases. For example, the 90% quantiles when b = 0, 0.1, 0.2, 0.3, 0.4, 0.5 are 1.9265, 1.5602, 1.6963, 1.8440, 2.0120, and 2.1654, respectively. The corresponding 95% quantiles are 2.4695, 2.0525, 2.2118, 2.4741, 2.6988, and 2.9385, respectively. Simulation results show that the limiting distribution becomes close to the standard normal when b is close to 0.1. For example, when b = 0.1, the probability of

is 11.70%, which is very close to 10%, the size of the test when

is standard normal. In other words, when M = 0.1T is used to test the null of β = 0, the probability of wrong rejection is only 11.70% even if the critical value does not come from the true limiting distribution. To a great extent, the new t-test eliminates the spurious effect.

Kernel estimates of densities of when xt ∼ I(0.4) and yt ∼ I(0.2).
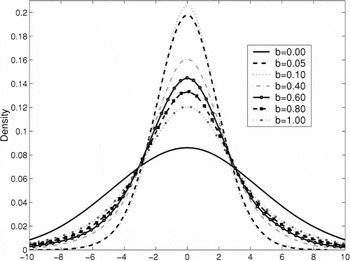
Figure 4 graphs the density estimates when yt ∼ I(0.3) and xt = t. Again, we find that the densities are more concentrated than in the nonstationary cases and become most concentrated when b is close to 0.1. Another feature of Figures 3 and 4 is that the densities appear to be slightly negatively skewed (skewed to the left).

Kernel estimates of densities of when xt = t and yt ∼ I(0.3).
5. CONCLUSION
This paper investigates the asymptotic properties of the t-statistic in spurious regressions. It was shown that the usual t-statistic diverges because the OLS standard error does not take into account the high persistence of the regressor and regression residuals. This finding helps to explain why the significant regression coefficients occur in nonsense regressions. Conventional wisdom is that the variables in a nonsense regression share the common feature of a trending mechanism. But there is no trending mechanism in a stationary long memory process, yet the usual t-statistic diverges and, therefore, ultimately exceeds any finite critical values and indicates a statistically significant relationship between two independent long memory processes. Our study suggests that it is the use of a small bandwidth (M = o(T)) in estimating the standard error that gives rise to spurious effects. If a large bandwidth (M = bT) is used, the convergence of the t-statistic can be restored.
When the bandwidth is proportional to the sample size, the t-statistic also converges to a well-defined distribution in the usual regressions with weakly dependent processes (Kiefer and Vogelsang, 2003). Therefore, the specification of M = bT has the potential to deliver a unified inferential framework. The advantage of setting M = bT is that the t-statistic converges in distribution without any normalization. In contrast, when M is chosen to grow at a slower rate than T, the t-statistic may have to be normalized to be convergent. The normalization factor is typically of the form Tκ for some parameter κ that depends on unknown memory parameters. In practice, researchers routinely use the t-statistic without any normalization. This practice thus runs the risk of overrejection when M is small and the underlying processes exhibit some persistence. The use of M = bT has the potential to reduce this risk.
APPENDIX OF PROOFS
Proof of Theorem 1. Combining the FCLT with the continuous mapping theorem, we have

and

Hence

As a consequence,

Now write

as

where the last line follows from the continuous mapping theorem. In view of (A.3) and (A.4), we have

This completes the proof of the theorem. █
Proof of Lemma 3. The results of the lemma have been established in Chung (2002) under the stronger assumption that both dx and du are greater than 0.25 and less than 0.5. A careful inspection reveals that his proof goes through without modification as long as dx + du > 0.5. █
Proof of Theorem 4. It follows from Corollary 1 in Chung (2002) that

Combining (A.6) with Lemma 3 yields

We next consider the limiting distribution of

Let

, for r ≥ 1/T and STv(r) = 0, for 0 ≤ r < 1/T. Then

where we have used

uniformly in r.
Using summation by parts twice, we have

where

and the last line follows from the identity that STv(1) = 0. Note that when T → ∞ such that (t/T,τ/T) → (r,s) in euclidean metric (∥·∥) for some r and s, we have

Because k(·) is twice continuously differentiable, the preceding convergence is uniform in r and s. In other words, for any given ε > 0, there exists a positive Δ that is independent of r and s such that

whenever ∥(t/T,τ/T) − (r,s)∥ < Δ for all (r,s) in [0,1] × [0,1]. For a proof of the uniformity, see Weinstock (1957).
Combining (A.9), (A.11), and (A.13) and invoking the continuous mapping theorem, we get

Therefore

Combining (A.7) with (A.15) yields the limiting distribution of the t-statistic. This completes the proof of the theorem. █
Proof of Theorem 5. For the Bartlett kernel, we have, after simple calculations,

Hence

The theorem now follows from (A.17) and the steps in the proof of Theorem 4. █
References
REFERENCES
Andrews, D.W.K.
(1991)
Heteroskedasticity and autocorrelation consistent covariance matrix
estimation.
Econometrica
59,
817–854.Google Scholar
Chung, C.-F.
(2002)
Sample means, sample autocovariances, and linear regression of
stationary multivariate long memory processes.
Econometric Theory
18,
51–78.Google Scholar
Davidson, J. &
R. de Jong
(2000)
The functional central limit theorem and weak convergence to
stochastic integrals, part II: Fractionally integrated processes.
Econometric Theory
16,
643–666.Google Scholar
Durlauf, S.N. &
P.C.B. Phillips
(1988)
Trends versus random walks in time series analysis.
Econometrica
56,
1333–1354.Google Scholar
Granger, C.W.J. &
P. Newbold
(1974)
Spurious regressions in econometrics.
Journal of Econometrics
2,
111–120.Google Scholar
Jansson, M.
(2004)
Autocorrelation robust tests with good size and power.
Econometrica,
forthcoming.Google Scholar
Kiefer, N.M. &
T.J. Vogelsang
(2002a)
Heteroskedasticity-autocorrelation robust testing using bandwidth
equal to sample size.
Econometric Theory
18,
1350–1366.Google Scholar
Kiefer, N.M. &
T.J. Vogelsang
(2002b)
Heteroskedasticity-autocorrelation robust standard errors using the
Bartlett kernel without truncation.
Econometrica
70,
2093–2095.Google Scholar
Kiefer, N.M. &
T.J. Vogelsang
(2003)
A New Asymptotic Theory for Heteroskedasticity-Autocorrelation Robust
Tests.
Working paper,
Center for Analytic Economics, Cornell University.
Marinucci, D. &
P.M. Robinson
(1999)
Alternative forms of fractional Brownian motion.
Journal of Statistical Planning and Inference
80,
111–122Google Scholar
Marinucci, D. &
P.M. Robinson
(2000)
Weak convergence to fractional Brownian motion.
Stochastic Processes and Their Applications
86,
103–120.Google Scholar
Marmol, F.
(1995)
Spurious regressions between I(d) processes.
Journal of Time Series Analysis
16,
313–321.Google Scholar
Marmol, F.
(1998)
Spurious regression theory with nonstationary fractionally
integrated processes.
Journal of Econometrics
84,
233–250.Google Scholar
Marmol, F. &
C. Velasco
(2002)
Trend stationarity versus long-range dependence in time series
analysis.
Journal of Econometrics
108,
25–42.Google Scholar
Phillips, P.C.B.
(1986)
Understanding spurious regressions in econometrics.
Journal of Econometrics
33,
311–340.Google Scholar
Phillips, P.C.B.
(1998)
New tools for understanding spurious regressions.
Econometrica
66,
1299–1325.Google Scholar
Phillips, P.C.B.,
Y. Sun, &
S. Jin
(2003a)
Consistent HAC Estimation and Robust Regression Testing Using Sharp
Origin Kernels with No Truncation.
Cowles Foundation Discussion paper 1407,
http://cowles.econ.yale.edu/P/au/d_phillips.htm.
Phillips, P.C.B.,
Y. Sun, &
S. Jin
(2003b)
Long Run Variance Estimation with Steep Origin Kernels without
Truncation.
Cowles Foundation Discussion paper 1437,
http://cowles.econ.yale.edu/P/au/d_phillips.htm.
Robinson, P.M.
(1994)
Semiparametric analysis of long memory time series.
Annals of Statistics
22,
515–539.Google Scholar
Robinson, P.M.
(1998)
Inference-without-smoothing in the presence of nonparametric
autocorrelation.
Econometrica
66,
1163–1182.Google Scholar
Tsay, W.-J. &
C.-F. Chung
(2000)
The spurious regression of fractionally integrated processes.
Journal of Econometrics
96,
155–182.Google Scholar
Weinstock, R.
(1957)
On continuous differentiability.
American Mathematical Monthly
64,
492.Google Scholar
Kernel estimates of densities of when xt ∼ I(0.6) and yt ∼ I(0.6).
Kernel estimates of densities of when xt = t and yt ∼ I(0.6).
Kernel estimates of densities of when xt ∼ I(0.4) and yt ∼ I(0.2).
Kernel estimates of densities of when xt = t and yt ∼ I(0.3).
 You have
Access
- 18
- Cited by