


Introduction
Depression has emerged as the foremost mental health challenge globally, accounting for 7.5% of disability-adjusted life years (Moreno-Agostino et al., Reference Moreno-Agostino, Wu, Daskalopoulou, Hasan, Huisman and Prina2021; Mo et al., Reference Mo, Qin, Ye, Hu, Wang, Zhao, Zheng, Lu, Li and Tang2024). However, traditional pharmacological treatments and psychotherapies show limited effectiveness in managing the condition, underscoring the critical importance of primary depression prevention (Thornicroft et al., Reference Thornicroft, Chatterji, Evans-Lacko, Gruber, Sampson, Aguilar-Gaxiola, Al-Hamzawi, Alonso, Andrade, Borges, Bruffaerts, Bunting, De Almeida, Florescu, de Girolamo, Gureje, Haro, He, Hinkov, Karam, Kawakami, Lee, Navarro-Mateu, Piazza, Posada-Villa, de Galvis and Kessler2017; McIntyre et al., Reference McIntyre, Greenleaf, Bulaj, Taylor, Mitsi, Saliu, Czysz, Silvesti, Garcia and Jain2023). Identifying predominant modifiable risk factors and pinpointing high-risk populations are thus imperative for informing effective depression prevention strategies.
Although existing research has documented the associations between modifiable risk factors and depression, most of it has concentrated on a limited spectrum of modifiable factors, leaving emerging factors, such as environmental exposure and social support, out of the framework (Hammen, Reference Hammen2018; van Gennip et al., Reference van Gennip, Schram, Köhler, Kroon, Koster, Eussen, de Galan, van Sloten and Stehouwer2023). In addition, previous studies failed to rank the importance of each risk factor from a more comprehensive view, which is rather critical in practical prevention, as prioritizing the control of predominant risk factors can achieve more effectiveness with less effort (Weersing et al., Reference Weersing, Shamseddeen, Garber, Hollon, Clarke, Beardslee, Gladstone, Lynch, Porta, Iyengar and Brent2016; Gronemann et al., Reference Gronemann, Jorgensen, Nordentoft, Andersen and Osler2020). Notably, multiple risk factors often act synergistically to influence the onset of depression (Diaz-Gallo et al., Reference Diaz-Gallo, Brynedal, Westerlind, Sandberg and Ramsköld2021). Effectively integrating these modifiable risk factors into predominant risk patterns is crucial for pinpointing high-risk populations.
Associations between risk factors and depression differed across age groups, with stronger associations among midlife individuals (Rong et al., Reference Rong, Cheng, Li, Wang and Zhao2024; Xu et al., Reference Xu, Li, Hu, He, Zhang and Jin2024). Growing evidence indicated that females were approximately twice as likely to be affected by depression as males (Dong et al., Reference Dong, Ironside, Belleau, Sun, Cheng, Xiong, Nickerson, Wang, Yao and Pizzagalli2022; Carvalho Silva et al., Reference Carvalho Silva, Pisanu, Maffioletti, Menesello, Bortolomasi, Gennarelli, Baune, Squassina and Minelli2023). It remains poorly understood regarding the extent to which modifiable risk factors differentially modulate depression risk across age and sex subgroups (Lee et al., Reference Lee, Yun, Ko, Ahn, Yoo, Her, Moon, Jung, Won and Kim2023; Zheng et al., Reference Zheng, Zhao, Zhou, Yang, Chen, Hu, Jiang, Zhang, Cai and Qiu2023). This ambiguity substantially hinders the development of prevention frameworks, necessitating a systematic reappraisal of age- and sex-specific prevention architectures.
We thus conducted this study with the aims to (1) reveal and prioritize age- and sex-specific modifiable risk factors affecting depression incidence, and (2) identify the age- and sex-specific predominant risk patterns to help find out high-risk populations susceptible to depression.
Methods
Study design and participants
We extracted data from the UK Biobank, a prospective population-based cohort study recruiting over half a million participants aged 37–73 years across 22 assessment centres (2006–2010) (Chen et al., Reference Chen, Cao, Ma, Xu, Zong and Yuan2023). Extensive information on demographic characteristics, socioeconomic status and lifestyles was collected at baseline, and health conditions were ascertained via linkages to the National Health System. Detailed information on the study protocol is described elsewhere (Allen et al., Reference Allen, Lacey, Lawlor, Pell, Gallacher, Smeeth, Elliott, Matthews, Lyons, Whetton, Lucassen, Hurles, Chapman, Roddam, Fitzpatrick, Hansell, Hardy, Marioni, O’Donnell, Williams, Lindgren, Effingham, Sellors, Danesh and Collins2024). The study was approved by the National Information Governance Board for Health and Social Care and the National Health Service North West Centre for Research Ethics Committee (updated Ref: 21/NW/0157). Of the 502,411 participants, participants diagnosed with depression at recruitment (N = 34,166), with non-White ancestry (N = 28,281) or with ‘Prefer not to answer’ data (N = 11,886) were excluded, leaving a total of 428,078 participants in the final analysis (Supplementary Figure S1). We excluded participants with non-White ancestry to prevent confounding from population stratification in our subsequent analyses with polygenic risk scores (mentioned below) (Kachuri et al., Reference Kachuri, Chatterjee, Hirbo, Schaid, Martin, Kullo, Kenny, Pasaniuc, Witte and Ge2024).
Collection of modifiable risk factors
Based on literature review a priori, we included a total of 28 modifiable risk factors associated with depression, which were subsequently grouped into five distinct clusters, including clusters of socioeconomic status, lifestyles, environmental exposure, social support and health condition (Willroth et al., Reference Willroth, Pfund, Rule, Hill, John, Kyle, Hassenstab and James2024). Detailed definitions and measurements are shown in Supplementary Table S1.
The socioeconomic status cluster was composed of four factors, including index of multiple deprivation (IMD), household income level, education level and employment status (Buckman et al., Reference Buckman, Saunders, Stott, Cohen, Arundell, Eley, Hollon, Kendrick, Ambler, Watkins, Gilbody, Kessler, Wiles, Richards, Brabyn, Littlewood, DeRubeis, Lewis and Pilling2022). IMD was a measure of relative neighbourhood-level deprivation used to rank across the UK (Qi et al., Reference Qi, Jia, Pan, Li, Wen, Hao, Liu, Cheng, Cheng, Yao and Zhang2022). The lifestyle cluster was composed of six factors, including smoking status, alcohol consumption, physical activity level, sedentary time, sleep status (good, moderate and poor) and diet quality. The environmental exposure cluster is comprised of six factors, including green space, blue space, average 24 h noise, PM2.5, NO2 and SO2. The social support cluster included childhood trauma, social isolation and loneliness (Cleary et al., Reference Cleary, Fang, Zahodne, Bohnert, Burmeister and Sen2023). The health condition cluster included nine factors, such as hand grip strength, forced expiratory volume in one second, forced vital capacity, C-reactive protein (Cleary et al., Reference Cleary, Fang, Zahodne, Bohnert, Burmeister and Sen2023), body mass index (BMI), cardiovascular disease (CVD), type 2 diabetes, cancer and menopause (exclusively for females) (Cabanas-Sánchez et al., Reference Cabanas-Sánchez, Esteban-Cornejo, Parra-Soto, Petermann-Rocha, Gray, Rodríguez-Artalejo, Ho, Pell, Martínez-Gómez and Celis-Morales2022; Hu et al., Reference Hu, Liu and Jia2024).
Covariables
We further included a set of important covariables including age at recruitment, sex (used in age-specific analysis), medication for lowering blood pressure, blood lipid, or blood glucose (yes, no), nonsteroidal anti-inflammatory drugs (NSAID, yes, no) and polygenetic risk score (PRS) for depression (Semenkovich et al., Reference Semenkovich, Brown, Svrakic and Lustman2015). Details of the PRS calculation are shown in Supplementary Methods (Howard et al., Reference Howard, Adams, Clarke, Hafferty, Gibson, Shirali, Coleman, Hagenaars, Ward, Wigmore, Alloza, Shen, Barbu, Xu, Whalley, Marioni, Porteous, Davies, Deary, Hemani, Berger, Teismann, Rawal, Arolt, Baune, Dannlowski, Domschke, Tian, Hinds, Trzaskowski, Byrne, Ripke, Smith, Sullivan, Wray, Breen, Lewis and McIntosh2019). These factors were reported to influence the incidence and development of depression, which should be considered in the analysis.
Ascertainment of outcome and follow-up
All participants were followed up longitudinally from baseline till the first diagnosis of depression, loss of follow-up, death or the latest date of available data (31 October 2022 for England; 31 August 2022 for Scotland; and 31 May 2022 for Wales), whichever came first. To ensure a more standardized and consistent diagnosis of depression, depression cases were ascertained via linkages to the hospital admission records according to the International Classification of Diseases, 10th revision (ICD-10), coded by F32 and F33 (Lin et al., Reference Lin, Yang, Zhang, Cao, Li, Sun, Zhang and Wang2023; Wang et al., Reference Wang, Wang, Li, Wang and Zhang2024).
Statistical analysis
Baseline characteristics among different age subgroups (middle-aged: <50 years; quinquagenarian: 50 to <60 years; and the elderly: ≥60 years) and sex subgroups (females and males) were summarized by one-way Analysis of Variance (ANOVA) or Chi-square test, as appropriate. These specific age cutoffs were selected a priori to capture distinct life stages and biological transitions associated with depression risk while ensuring sufficient sample size and event rates within each subgroup for robust statistical estimation (Tian et al., Reference Tian, Chen, Qian, Xia, Zhang, Zhang, Wang, Vaughn, Tabet and Lin2023). To refine and map age- and sex-specific modifiable risk factors associated with depression incidence, we applied a four-step analytical protocol as follows (Supplementary Figure S2).
Step 1: Estimating the associations between risk factors and depression across different subgroups
Multivariable Cox proportional hazards regression models with follow-up time as the time scale were applied to investigate the associations between modifiable risk factors and incidence risk of depression across age and sex subgroups, estimated by hazard ratios (HRs) with 95% confidence intervals (CIs). Age at recruitment, sex (adjusted in the age-specific model), medication usage and PRS levels were adjusted in the models. Schoenfeld residuals method was used to assess the proportional hazards assumption, and no violation was observed. We further included the interaction term (age subgroup * modifiable risk factor or sex * modifiable risk factor) in the model and used the likelihood ratio tests to investigate whether the associations between each risk factor and depression risk varied across different subgroups (Chen et al., Reference Chen, Cai, Li, Wang, Tian, Wu, Zhang and Lin2022).
Step 2: Calculating the average PAF of each risk factor
We estimated the average population-attributable fraction (PAF) of incident depression attributable to each factor to identify predominant modifiable risk factors (Tian et al., 2023). This method was developed by Eide and Gefeller (Reference Eide and Gefeller1995) and is recently used in epidemiological studies via the ‘averisk’ package in R software (Pacheco-Barrios et al., Reference Pacheco-Barrios, Giannoni-Luza, Navarro-Flores, Rebello-Sanchez, Parente, Balbuena, de Melo, Otiniano‐Sifuentes, Otiniano-Sifuentes, Rivera-Torrejón, Alva‐Diaz, Alva-Diaz and Fregni2022; Chen et al., Reference Chen, Cao, Ma, Xu, Zong and Yuan2023). The corresponding 95% CIs were calculated using 1,000 Monte Carlo simulations, with the parameter nsample_var set to 1,000 (Ferguson et al., Reference Ferguson, Alvarez-Iglesias, Newell, Hinde and O’Donnell2018). Detailed descriptions and assumptions are listed in Supplementary Methods.
Step 3: Integrating risk factors into predominant patterns
We further applied the self-organizing map (SOM) to integrate five risk clusters into predominant patterns to inform the high-risk population. Modifiable risk factors are homogeneous within the same pattern and heterogeneous between patterns (Christensen et al., Reference Christensen, Marcus, Naudé, Vanker, Eick, Caudle, Malcolm-Smith, Suglia, Chang, Zar, Stein and Hüls2024). Quantization error and topological error were used to determine the appropriate grids of each subgroup, and within-cluster sum of squares analyses were used to identify candidates for the optimal number of clusters (Supplementary Figure S3) (Rahman et al., Reference Rahman, Kono and Hosono2022). To investigate the associations between SOM patterns and depression risk, SOM patterns were subsequently added to Cox proportional hazards regression models (adjusted for the same covariables mentioned above) and Kaplan–Meier survival analysis as a categorical variable.
Step 4: Causal inference of top-ranked factors and depression incidence
We performed the two-sample Mendelian randomization (MR) analyses to explore the potential causal associations between the top five modifiable risk factors and depression incidence. Summary genetic information of the top 5 variables and the outcome is detailed in Supplementary Table S2. Details of the two-sample MR analysis are presented in Supplementary Methods.
Sensitivity analyses
We conducted several sensitivity analyses to examine the robustness of our results. First, we applied the competing analysis with all-cause death as the competing event. Second, we excluded participants with missing data for included variables to verify whether the exclusion would influence our estimates. Third, we excluded participants who were diagnosed with depression within 2 years of recruitment to avoid reverse causation. Fourth, we further included depression cases from primary care, self-reported data, hospital admission records, and death registry data to investigate whether the observed associations remained consistent when identifying outcomes from different sources. Fifth, we assigned participants into six age groups (<45 years, 45 to <50 years, 50 to <55 years, 55 to <60 years, 60 to <65 years, and ≥65 years) to test the robustness of our findings.
All analyses were performed using R 4.3.1, and a P-value <0.05 was considered statistically significant.
Results
Participants’ baseline characteristics
A total of 428,078 participants were included, with a mean (standard deviation, SD) age of 56.78 (8.03) years and a balanced sex distribution (53.50% female). During a mean follow-up of 13.11 years, 15,106 (3.53%) participants developed depression. Generally, the elderly (≥60 years) tended to have lower socioeconomic status and poor sleep status, and a higher prevalence of health conditions. Female participants were more likely to develop depression, be less educated and be unemployed relative to males (Table 1).
Baseline characteristics of participants

Table 1 Long description
Baseline characteristics are compared between females and males, as well as among the middle-aged, quinquagenarian, and the elderly, using mean values [standard deviation (SD)] for continuous variables and counts with percentages for categorical variables. A total of 428,078 participants were included, of which 95,467 were the middle-aged, 141,499 were quinquagenarian, and 190,982 were the elderly. A generally balanced sex distribution (53.50% for females) was also observed. During a mean follow-up of 13.11 years, 15,106 (3.53%) participants developed depression. The elderly (≥ 60 years) tended to have lower socioeconomic status and poor sleep status, and higher prevalence of health condition. Females were more likely to develop depression, be less educated and unemployed relative to males
The statistics are shown as mean (standard deviation [SD]) for continuous variables and number (%) for categorical variables.
IMD, index of multiple deprivation; FEV1, forced expiratory volume in one second; FVC, forced vital capacity; CRP, C-reactive protein; BMI, body mass index; PAF, population attributable fraction; CVD, cardiovascular disease; T2D, type 2 diabetes; PM2.5, fine particulate matter with diameter <2.5 μm; NO2, nitrogen dioxide; SO2, sulphur dioxide; NSAID, nonsteroidal anti-inflammatory drugs; PRS, polygenetic risk score.
Associations between modifiable factors and depression incidence by age and sex
Stronger estimates were observed in risk clusters of socioeconomic status and health condition. Larger HRs (95% CIs) were observed among younger participants relative to elder participants given the same factor level. For example, relative to employed status, the HRs (95% CIs) for unemployed status were 1.63 (1.48, 1.79), 1.61 (1.49, 1.73) and 1.42 (1.26, 1.59) for the middle-aged, quinquagenarian and the elderly, respectively. Significant interactions between age and socioeconomic status factors, CVD, BMI, lung function, sedentary time and SO2 exposure were observed (Figure 1(a)). The magnitudes of associations between risk factors and depression were generally identical across sex subgroups, while significant interactions between employment status, education level, lung function and sex subgroups were observed (Figure 1(b)).
Associations between modifiable risk factors and the incidence risk of depression stratified by age and sex. (a) Stratified by age subgroups; (b) stratified by sex subgroups. All modifiable risk factors, sex (in age-specific analyses), age at recruitment (in sex-specific analyses), PRS level and medication usage were fully adjusted in Cox proportional hazard regression models, with estimates presented by hazard ratios (HR) and corresponding 95% confidence intervals (CIs).

Figure 1 Long description
Age- and sex-specific associations between modifiable risk factors and depression incidence risk are displayed in Figure 1. All modifiable risk factors, sex (in age-specific analyses), age at recruitment (in sex-specific analyses), and medication usage were fully adjusted in Cox proportional hazard regression models, with estimates presented by hazard ratios (HR) and corresponding 95% confidence intervals (CIs). Larger HRs (95% CIs) were observed among younger participants relative to elder participants given the same factor level. For example, the HRs (95% CIs) for unemployed status were 1.63 (1.48, 1.79), 1.61 (1.49, 1.73), and 1.42 (1.26, 1.59) for the middle-aged, quinquagenarian, and the elderly respectively. The magnitudes of associations between risk factors and depression were generally identical across sex subgroups, while significant interactions between employment status, education level, lung function and sex subgroups were observed.
Similarly, the estimate of each cluster score was larger among younger participants than elder participants, while similar estimates were observed between females and males. Notably, regarding each specific modifiable risk factor, stronger associations between social isolation and depression incidence were observed among the elderly, with the HR (95% CI) up to 1.23 (1.14, 1.32) for the elderly. Regarding other modifiable risk factors, employment status, smoking, poor sleep quality and SO2 exposure showed predominant influence in the corresponding risk cluster across different subgroups (Figure 2(a) and (b)).
Associations between dichotomously-classified risk factors and the incidence risk of depression stratified by age and sex subgroups. (a) Stratified by age subgroups; (b) stratified by sex subgroups. All modifiable risk factors, sex (in age-specific analyses), age at recruitment (in sex-specific analyses), and medication usage were fully adjusted in Cox proportional hazards regression models, with estimates presented as hazard ratios (HR) and corresponding 95% confidence intervals (CIs). Overall score in each risk cluster indicated the sum of the scores of each specific risk factor.

Figure 2 Long description
In Figure 2, each modifiable risk factor was dichotomized with a score of 1 representing an unfavorable status, and 0 for a favorable status. All modifiable risk factors were classified into 5 clusters, including clusters of socioeconomic status, lifestyles, environmental exposure, social support, and health condition. Overall score in each risk cluster indicated the sum of score of each specific risk factor. The hazard ratio (HR) of each cluster score was larger among younger participants than elder participants, while similar estimates were observed between females and males. Notably, regarding each specific modifiable risk factor, stronger associations between social isolation and depression incidence were observed among the elderly, with the HR (95% CI) up to 1.23 (1.14, 1.32) for the elderly. Employment status, smoking, poor sleep quality and SO2 exposure showed predominant influence in corresponding risk cluster across different subgroups.
Average PAF attributable to each factor across subgroups
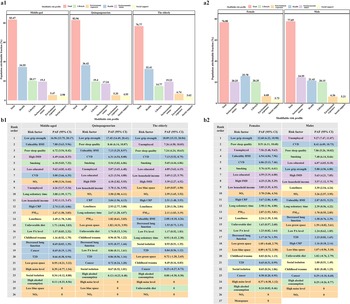
The modifiable risk factors jointly accounted for more than 75% of PAF for depression incidence across different subgroups, with 83.47%, 82.96%, 76.77%, 76.80% and 77.69% in the middle-aged, quinquagenarian, the elderly, females and males. Generally, the PAF for depression incidence attributable to each cluster shared almost similar patterns in age subgroups, with health condition cluster contributing the most, followed by socioeconomic status and lifestyles (Figure 3(a1) and (a2)). Regarding each definite modifiable risk factor, weak grip strength was generally the largest contributor to PAF, with up to 18.09% of PAF among elder participants (Figure 3(b1)). Smoking and poor sleep quality ranked the top five modifiable factors, with PAFs (95% CI) ranging from 5.54% (5.02%, 6.02%) to 7.40% (6.14%, 8.66%) for smoking, and from 6.72% (3.54%, 8.42) to 8.51% (6.11%, 10.68%) for poor sleep quality. Notably, great similarity was observed in the top 10 predominant risk factors across age and sex subgroups, and unemployed status, low household income level, less educated, high IMD and CVD ranked top 10 modifiable risk factors in both age and sex subgroups (Figure 3(b1) and (b2)).
Average population-attributable fractions (PAFs) for depression attributable to modifiable risk factors across age and sex subgroup. (a) Average PAFs attributable to five risk clusters for age subgroups (a1), and sex subgroups (a2). Average PAF attributable to each modifiable risk factor stratified by age subgroups (b1) and sex subgroups (b2).

Figure 3 Long description
The average population-attributable fraction (PAF) of incident depression attributable to each factor is shown in Figure 3. The modifiable risk factors accounted for more than 75% of PAF for depression incidence, with 83.47%, 82.96%, 76.77%, 76.80% and 77.69% in middle-aged, quinquagenarian, the elderly, females, and males. The PAF for depression incidence attributable to each cluster shared similar patterns in both age subgroups, with health condition cluster contributing the most, followed by socioeconomic status, and lifestyles (Figure 3A). Regarding each definite modifiable risk factor, weak grip strength was generally the largest contributor to PAF, with up to 18.09% of PAF among elder participants (Figure 3B). Notably, great similarity was observed in the top ten predominant risk factors across age and sex subgroups, and unemployed status, low household income level, less educated, high IMD, and CVD ranked top 10 modifiable risk factors in both age and sex subgroups.
Integrated patterns and corresponding associations with depression
The integrated risk patterns are shown in Figures 4 and 5. Six integrated risk patterns were subsequently defined in each age and sex subgroups (Figures 4(a) and 5(a)). We chose the risk pattern with the lowest risk estimates as the reference, and named other patterns according to the predominant risk clusters.
Associations between integrated risk patterns and incidence risk of depression stratified by age subgroup. (a) Integrated risk patterns identified by self-organizing map (SOM) among the middle-aged (a1), quinquagenarian (a2) and the elderly (a3); (b) Associations between integrated risk patterns and depression incidence among the middle-aged (b1), quinquagenarian (b2) and the elderly (b3); (c) Kaplan–Meier curves of depression among the middle-aged (c1), quinquagenarian (c2) and the elderly (c3).

Figure 4 Long description
The self-organizing map was used to integrate five risk clusters into predominated patterns, and six integrated risk patterns were subsequently defined in each age subgroups. Risk pattern predominated by socioeconomic status, health condition and lifestyles exhibited the largest influence across different age subgroups, and larger estimates were observed among the middle-aged participants, with a hazard ratio of 4.13. In addition, the age-specific Kaplan–Meier curve also indicated that the incidence risk of depression was about 2.47–4.13-fold for the highest-risk patterns relative to reference pattern.
Associations between integrated risk patterns and incidence risk of depression stratified by sex subgroup. (a) Integrated risk patterns identified by self-organizing map (SOM) among females (a1) and males (a2). (b) Associations between integrated risk patterns and depression incidences among females (b1) and males (b2). (c) Kaplan–Meier curves of depression among females (c1) and males (c2).

Figure 5 Long description
The self-organizing map was used to integrate five risk clusters into predominated patterns, and six integrated risk patterns were subsequently defined across sex subgroups. Different high-risk patterns were observed among different sexes, as pattern featured by socioeconomic status, health condition, and environmental exposure was observed with the highest risk in females (HR: 3.19), while pattern featured by social support and socioeconomic status was of the highest risk in males (HR: 4.37). In addition, the age-specific Kaplan-Meier curve also indicated that the incidence risk of depression was 3.19–4.37 folds for highest risk patterns relative to the reference pattern.
Regarding age-specific associations, the risk pattern predominated by health condition and lifestyle exhibited the largest influence, and larger estimates were observed among the middle-aged participants (Figure 4(b1)–(b3)). The age-specific Kaplan–Meier curve also indicated that the incidence risk of depression was about 2.47–4.13-fold for the highest risk patterns relative to the reference pattern (Figure 4(c1)–(c3)). In terms of the sex-specific risk patterns, compared with the reference pattern, the HRs (95% CIs) were up to 3.19 (2.95, 3.45) and 4.37 (3.95, 4.83) for patterns featured by socioeconomic status and health condition and environmental exposure in females, and social support and socioeconomic status in males (Figure 5(b1) and (b2)). Consistently, the Kaplan–Meier curve showed similar trends to the Cox results (Figure 5(c1) and (c2)).
Results of two-sample MR analyses
We observed that the top 5 genetically modifiable factors were associated with depression (Supplementary Figure S4). For example, genetically elevated BMI, smoking and poor sleep quality were associated with a higher depression risk. Genetically increased grip strength was linked to a lower risk of depression. The results from sensitivity analyses yielded similar estimates (Supplementary Figures S5–S6).
Sensitivity analyses
The results remained consistent with the main findings when treating all-cause death as competing events, excluding participants with missing data for candidate factors, or excluding participants developing depression within the first 2 years (Supplementary Tables S3–S5). Consistently, the PAF decreased with age when the depression cases were ascertained from multiple sources (Supplementary Table S6), and the participants were classified into finer subgroups (<45, 45 to <50, 50 to <55, 55 to <60, 60 to <65, and ≥65 years) (Supplementary Table S7). Generally, the largest PAF of depression was attributable to health-related factors, followed by socioeconomic status and lifestyles.
Discussion
In this nationwide cohort study, we observed that lower socioeconomic status, unhealthy lifestyle and poor health condition indicated stronger associations with depression among younger adults. No significant heterogeneity was observed among sex subgroups. Over 75% of depression incidence risk was statistically attributable to the included modifiable risk factors, with health condition factors contributing the most, followed by socioeconomic status factors and lifestyle factors. Weak grip strength, poor sleep quality and unemployed status were predominant risk factors irrespective of age or sex subgroups, and these associations were further verified by two-sample MR analyses. The integrated risk patterns were correlated with up to 4.37-fold risk relative to reference risk patterns. Our study identified a stronger influence of health condition, socioeconomic status and lifestyles among younger individuals, which shed new light on future depression prevention.
Health condition showed the largest influence among all modifiable risk factors, accounting for over 30% of PAF among age subgroups and approximately 20% of PAF among sex subgroups. Our findings were in line with previous studies, which also suggested that weak grip strength was an individual contributor to depression. For example, Cabanas-Sánchez et al. (Cabanas-Sánchez et al., Reference Cabanas-Sánchez, Esteban-Cornejo, Parra-Soto, Petermann-Rocha, Gray, Rodríguez-Artalejo, Ho, Pell, Martínez-Gómez and Celis-Morales2022) found that a 5 kg decrease in hand grip strength was associated with about a 7% higher risk of depression. To be noticed, we found a larger PAF attributable to weak grip strength among elder and female participants relative to younger and male adults, which could be explained by the fact that grip strength has been used as a surrogate for overall health status in the general population, especially in older age, which is correlated with muscular fitness (Ramírez-Vélez et al., Reference Ramírez-Vélez, Correa-Bautista, Lobelo, Izquierdo, Alonso-Martínez, Rodríguez-Rodríguez and Cristi-Montero2016). The elderly and female participants tended to have weaker grip strength and physical condition relative to younger and male adults, which would result in higher depression risk.
Despite weak grip strength, CVD and unhealthy BMI were also important modifiable risk factors predominantly responsible for depression. It was documented that depression was found in up to 20% of patients with acute myocardial infarction hospitalization (Ziegelstein, Reference Ziegelstein2001), with major depression generally being found in about 15% of CVD patients (Hare et al., Reference Hare, Toukhsati, Johansson and Jaarsma2014). CVD is associated with activation of inflammatory pathways and endothelial dysfunction, which may then induce elevated inflammatory markers and subsequently lead to major depressive disorder (Baune et al., Reference Baune, Stuart, Gilmour, Wersching, Heindel, Arolt and Berger2012). Consistently, an MR study conducted in the UK Biobank also indicated that BMI exerted a causal effect on a set of depression phenotypes, with stronger associations in females and in younger individuals (Karageorgiou et al., Reference Karageorgiou, Casanova, O’loughlin, Green, McKinley, Bowden and Tyrrell2023). Overweight or obesity may be accompanied by social withdrawal, eventually contributing to depression (Milaneschi et al., Reference Milaneschi, Simmons, van Rossum and Penninx2019).
Consistent with previous findings (Swartz et al., Reference Swartz, Hariri and Williamson2017; Buckman et al., Reference Buckman, Saunders, Stott, Cohen, Arundell, Eley, Hollon, Kendrick, Ambler, Watkins, Gilbody, Kessler, Wiles, Richards, Brabyn, Littlewood, DeRubeis, Lewis and Pilling2022), socioeconomic factors also influenced the depression incidence, with a larger difference in PAF observed by sex. Specifically, unemployment predominantly accounted for about 9.27% of PAF in males, followed by lower education level and household income level. LIFE-Adult-Study indicated that unemployment was correlated with higher depression risk for men (OR: 2.17) and women (OR: 1.98) (Zuelke et al., Reference Zuelke, Luck, Schroeter, Witte, Hinz, Engel, Enzenbach, Zachariae, Loeffler, Thiery, Villringer and Riedel-Heller2018). To be noticed, unemployment was the second predominant risk factor among elder adults, with approximately a 1.5-fold PAF compared with younger ones. Unemployed status among elder individuals may imply less social contact and lower income levels, which were recognized to be hazardous factors associated with depression (Li et al., Reference Li, Tang, Albert, Rauktis and Ohmer2024). Our findings suggested that socioeconomic status may play a crucial role in depression, highlighting the importance of social interventions involving financial sanctions and incentives in depression prevention and control (Gibson et al., Reference Gibson, Thomson, Banas, Lutje, McKee, Martin, Fenton, Bambra and Bond2017).
Unhealthy lifestyle statistically accounted for 14.77–20.35% of depression incidence risk, with poor sleep quality and smoking predominantly responsible for the impacts regardless of sex or age subgroups. Poor sleep quality disturbs circadian rhythms, which could influence brain activities involving the regulation of mood and behaviour (Bechtel, Reference Bechtel2015). The detrimental influence of smoking on depression was also reported in the Health and Retirement Study, with smokers being 20% more likely to develop depression compared to non-smokers (An and Xiang, Reference An and Xiang2015). Approximately 5% of PAF was statistically attributable to other lifestyle factors, such as long sedentary time, unfavourable diet and low physical activity level. This indicated that these factors may not play a crucial role in the depression incidence, albeit with significant influence. These findings emphasized the importance of good sleep quality and non-smoking in the prevention of depression, indicating that these two modifiable risk factors would be key points of further prevention strategies.
Exposure to PM2.5 and SO2, and loneliness were also related to a higher risk of depression, albeit with relatively small PAFs. Consistently, one systematic review with 22 citations found that per 10 μg/m3 increment in PM2.5 concentration was associated with a 10.2% higher risk of depression (Braithwaite et al., Reference Braithwaite, Zhang, Kirkbride, Osborn and Hayes2019). Another observational study launched in Korea found that the PAFs for all the major mental disorders attributable to SO2 were 2.2% (Ha et al., Reference Ha, Kim, Kang, Park, Shin, Cho and Kim2024). In terms of social support, social isolation, loneliness and childhood trauma were all significantly associated with increased depression risk, which is in line with several previous research. Several MR analyses yielded potential causal associations between these three factors and major depression (Sbarra et al., Reference Sbarra, Ramadan, Choi, Treur, Levey, Wootton, Stein, Gelernter and Klimentidis2023; Zhang et al., Reference Zhang, Jiang, Wang, Qiu, Li, Wang, Luo and Ju2025).
Generally, risk patterns predominated by unhealthy lifestyles, low socioeconomic status and poor health conditions showed higher depression risk. Though not including the same risk factors, research from the Emory Healthy Aging Study applied the same method and observed similar findings, as risk patterns with low socioeconomic status and high levels of air pollution exposure were associated with higher depression risk (Mei et al., Reference Mei, Christensen, Li, Waller, Ebelt, Marcus, Lah, Wingo, Wingo and Hüls2024). In this study, unhealthy lifestyle and low socioeconomic status were the shared risk factors in age- and sex-specific risk patterns, underlying the crucial significance of regulating these two risk clusters in depression prevention. The top three contributing lifestyle risk factors, including poor sleep quality, smoking and long sedentary time, should be prioritized for regulation in daily life. To be noticed, low socioeconomic status was widely featured in all subgroups, indicating that deprived socioeconomic status may limit adults’ access to healthcare and healthy food, leading to poor health conditions, including depression (Arlettaz and Ramos, Reference Arlettaz and Ramos2023). In addition, social support also showed larger HRs among females and the elderly, raising the possibility that these populations may be more vulnerable to the adverse effects of inadequate social support on depression risk, and interventions aimed at strengthening social support networks may yield greater mental health benefits in these populations (Sonnenberg et al., Reference Sonnenberg, Deeg, van Tilburg, Vink, Stek and Beekman2013; Yao et al., Reference Yao, Xiao, Li, Hou, Peng, Li, Zhou, Wang, Liao, Zhang and Song2025).
Importantly, we observed significant effect modification of these associations by age, but rarely by sex, aligning with previous studies on individual risk factors such as CVD and grip strength (Ramírez-Vélez et al., Reference Ramírez-Vélez, Correa-Bautista, Lobelo, Izquierdo, Alonso-Martínez, Rodríguez-Rodríguez and Cristi-Montero2016). Biologically, these findings may reflect differences in susceptibility to the risk factors across adult life stages. Furthermore, depression in younger participants is likely predominantly early-onset, which may differ etiologically from late-onset depression. Future studies are warranted to confirm the observed age disparities and elucidate the underlying pathological mechanisms. In addition, older adults free of depression at baseline might represent a healthier subset than the general population, which might also underlie the observed age differences.
In this cohort study with over 400,000 participants, we identified and integrated age- and sex-specific modifiable risk profiles for depression, as well as offered causal clues for these selected factors. Our findings emphasized the importance of regulating healthy lifestyles, maintaining good health conditions and socioeconomic status in the prevention of depression among the general population, especially younger adults. This would help inform evidence to prioritize regulations on these predominant factors among high-risk populations.
Several limitations also needed to be outlined. First, participants in this study were White/European ancestry with the onset age of depression over 40 years, which limited the generalizability of our findings. Further research is needed to identify the modifiable risk profiles in a relatively younger population with diverse ethnicities. Second, although the risk factors identified in our study were consistent with previous findings, differences in the distribution of modifiable risk factors across different population subgroups may influence the estimates to some extent (Tian et al., Reference Tian, Chen, Qian, Xia, Zhang, Zhang, Wang, Vaughn, Tabet and Lin2023). Validation across different areas and populations is needed to ensure the effectiveness of our findings. Third, all modifiable risk factors were collected at baseline; variation during the follow-up was not considered in this study, which may influence the results inevitably. Fourth, including hospital-sourced patients merely is more likely to capture individuals with more severe depression and may miss cases managed exclusively in primary care or outpatient settings, potentially leading to an underestimation of the true incidence of depression. Whereas we performed a set of sensitivity analyses including depression cases from multiple sources, such as self-reported data, primary care and death registry data and observed consistent results with our main findings, which suggested the robustness of the observed associations between modifiable risk factors and depression in our study. Fifth, the estimated average PAFs indicated the proportion of depression incidence that is statistically attributable to the included modifiable risk factors under the assumptions of the model. These estimates should not be interpreted as the proportion of cases that would necessarily be prevented through intervention, as they depend on the validity of the underlying model assumptions and causal interpretation.
Conclusions
Our study observed stronger associations and greater attributable fractions of health condition, socioeconomic status and lifestyle factors for depression among relatively younger adults, providing evidence to inform prevention strategies to lower depression risk and pinpointing the importance of prevention from an earlier age.
Supplementary material
The supplementary material for this article can be found at https://doi.org/10.1017/S2045796026100985.
Availability of data and materials
Data are available upon reasonable request. Data from UK Biobank (https://www.ukbiobank.ac.uk/) and the Health Surveys for England and the Scottish Health Surveys (https://data-archive.ac.uk/) are available to bona fide researchers on application.
Acknowledgements
We wish to acknowledge the UK Biobank Resource under Application Number 69550 and also gratefully acknowledge the valuable contributions of all participants, members of the UK Biobank centre.
Author contributions
L.C.: Writing – review and editing, writing – original draft, formal analyses, methodology, investigation, data curation, and conceptualization. S.W.: Investigation and conceptualization. J.Z.: Investigation. F.T.: Writing – review and editing and supervision. P.H.: Writing – review and editing. Y.S.: Writing – review and editing. X.W.: Investigation, conceptualization, supervision, and writing – review and editing. H.L.: Project administration, investigation, conceptualization, and writing – review and editing.
Financial support
Not applicable.
Competing interests
The authors declare they have no other conflicting interests.
Ethical standards
The study was approved by the National Information Governance Board for Health and Social Care and the National Health Service North West Centre for Research Ethics Committee (updated Ref: 21/NW/0157). All participants signed informed consent to participate and be followed up prior to recruitment.




 Open access

