Introduction
Swimmer's itch (SI), or cercarial dermatitis, is a painful itchy rash caused by avian schistosomes, a group of snail-borne helminth parasites that are closely related to the causative agents of human schistosomiasis (Brant and Loker, Reference Brant and Loker2009). Avian schistosomes (mainly Trichobilharzia spp.) normally have waterfowl definitive hosts and snail intermediate hosts (mostly lymnaeid snails in Northern Michigan; Muzzall et al., Reference Muzzall, Burton, Snider and Coady2003). However, the infective cercaria stage (produced by the intermediate host snail) sometimes mistakes humans for birds and attempts to penetrate our skin, resulting in the rash (Talbot, Reference Talbot1936; Verbrugge et al., Reference Verbrugge, Rainey, Reimink and Blankespoor2004a). SI is an important problem for communities near inland lakes in northern Michigan, where it has an economic impact on recreational water use (Muzzall et al., Reference Muzzall, Burton, Snider and Coady2003; Verbrugge et al., Reference Verbrugge, Rainey, Reimink and Blankespoor2004b). Reducing the impact of SI in these communities will require improving our ability to predict when and where SI cercariae will be most abundant.
Factors influencing the distributions of schistosome parasites have been studied for a variety of species at various spatial and temporal scales. Studies investigating spatial patterns have focused on variation at a local scale (Raso et al., Reference Raso, Matthys, N'Goran, Tanner, Vounatsou and Utzinger2005; Zhou et al., Reference Zhou, Yang, Yihuo, Liu, Wang, Wei and Jiang2011), at a regional scale (Coady et al., Reference Coady, Muzzall, Burton, Snider, Saxton, Sergeant and Sommers2006; Rudko et al., Reference Rudko, Reimink, Froelich, Gordy, Blankespoor and Hanington2018) and at a landscape scale (Clements et al., Reference Clements, Moyeed and Brooker2006; Brooker, Reference Brooker2007). Studies investigating temporal patterns in schistosomes have largely focused on among-year and among-season variation (Spear et al., Reference Spear, Zhong, Mao, Hubbard, Birkner, Remais and Qiu2004; Yang et al., Reference Yang, Gemperli, Vounatsou, Tanner, Zhou and Utzinger2006; Ciddio et al., Reference Ciddio, Mari, Gatto, Rinaldo and Casagrandi2015). Most of these studies focused on factors driving either abundance of the parasites' intermediate or definitive hosts at larger spatial and temporal scales or infection prevalence within hosts. For example, increasing temperature in spring is thought to trigger emergence and increased reproduction of overwintering host snails for SI-causing parasites (Clampitt, Reference Clampitt1970; Hodasi, Reference Hodasi1976), increased light intensity and temperature lead to increased growth of the periphyton eaten by snails (Halstead et al., Reference Halstead, Hoover, Arakala, Civitello, De Leo, Gambhir, Johnson, Jouanard, Loerns, McMahon, Ndione, Nguyen, Raffel, Remais, Riveau, Sokolow and Rohr2018), and insecticide application can reduce the abundance of arthropod predators that eat snails (Halstead et al., Reference Halstead, McMahon, Johnson, Raffel, Romansic, Crumrine and Rohr2014; Sokolow et al., Reference Sokolow, Huttinger, Jouanard, Hsieh, Lafferty, Kuris, Riveau, Senghor, Thiam, N'Diaye, Sarr Faye and De Leo2015).
In addition to variation on larger temporal scales (e.g. seasonal or annual), SI incidence at Crystal Lake, Michigan is commonly observed to vary widely from one day to the next (Al Flory, pers. comm.). Day-to-day risk assessment is an important endpoint for local lake management (see Bush et al., Reference Bush, Fossani, Li, Mukherjee, Gronlund and O'Neill2014 for an analysis of daily Escherichia coli risk), and extending that risk assessment to SI could be essential in mitigating the impact of SI cases. However, factors driving variation in SI incidence at daily time scales are less understood than, and are likely different from, factors driving variation at longer time scales. For example, daily fluctuations in SI incidence are probably driven by factors other than local infected snail abundance, which should not fluctuate on such short time scales because lymnaeid snails have multi-year generation times (Sunada et al., Reference Sunada, Totani, Nakamura, Sakakibara, Lukowaik and Ito2017), and trematode-infected snails continue producing cercariae for multiple weeks after developing a patent infection (Da Costa et al., Reference Da Costa, Dreyfuss, Rakotondravao and Rondelaud1994; McCreesh and Booth, Reference McCreesh and Booth2014; Byers et al., Reference Byers, Holmes and Blakeslee2016). It is possible that short-term fluctuations could be driven by synchronized cercaria emergence from multiple snails due to some random event (e.g. a group of local snails that were simultaneously infected during a single bird visitation). Such random events might result in unpredictable temporal clustering of SI cases, though the underlying cause might be difficult to discern.
Short-term fluctuations in SI incidence might also be driven by environmental factors that vary on short time scales. One factor known to be capable of driving short-term fluctuations in cercaria abundance is temperature variability. Cercaria emergence from schistosome-infected snails is well known to increase in response to a temperature rise, and as a result, controlled temperature shifts are commonly used in laboratory settings to induce or inhibit cercaria production (Kuntz, Reference Kuntz1947; McClelland, Reference McClelland1965; Frank, Reference Frank1966). However, the thermal history of a trematode-infected snail can also influence cercaria production. For example, Paull et al. (Reference Paull, Raffel, LaFonte and Johnson2015) found that snails infected with the trematode Ribeiroia ondatrae produced fewer cercariae following past exposure to warmer temperatures, compared to snails that had experienced cooler temperatures. These results suggest that extended exposure to warmer temperatures might be stressful to snails and their trematode parasites, resulting in subsequently decreased cercaria production at any given new temperature. Based on this ‘thermal stress’ hypothesis, we predicted a negative effect of past temperatures on SI incidence (i.e. average water temperature over the past 3–7 days), after controlling for potential positive effects of current-day water temperature on cercaria production rates within infected snails. A second factor that might drive short-term fluctuations in SI incidence is changes in light intensity, which is known to help induce cercaria emergence from snails. For example, SI-causing cercaria emergence from host snails is triggered by the gradual increase in sunlight and temperature starting at dawn, with peak emergence occurring a few hours later (Kuntz, Reference Kuntz1947; Anderson et al., Reference Anderson, Nowosielski and Croll1976; Soldánová et al., Reference Soldánová, Selbach and Sures2016; Rudko et al., Reference Rudko, Reimink, Froelich, Gordy, Blankespoor and Hanington2018). We therefore predicted higher SI incidence in the morning than the afternoon, and lower SI incidence on days with more cloud cover (i.e. overcast). A third factor that might influence SI incidence on short time scales is the local density of swimmers, though the directionality of this effect is uncertain. For example, a greater density of swimmers might attract more cercariae to the local swim area (Haas and van der Roemer, Reference Haas and van der Roemer1998; Haeberlein and Haas, Reference Haeberlein and Haas2008), or conversely a larger number of swimmers might mean fewer cercariae are available to attack each individual swimmer (i.e. ‘encounter dilution’ effect; Buck and Lutterschmidt, Reference Buck and Lutterschmidt2017).
Another set of factors that might drive short-term fluctuations in SI incidence is shifts in wind and water currents, which might influence the movement of cercariae towards swim areas following their emergence from infected snails. Wave action and water currents, which can be affected by changes in wind speed or direction (Weber, Reference Weber1983), have been shown to carry schistosome cercariae downstream from off-site locations (Upatham, Reference Upatham1974). Furthermore, lymnaeid snails often live in deep-water off-shore habitats not usually associated with recreational swimming (Laman et al., Reference Laman, Boss and Blankespoor1984), and avian schistosome cercariae are known to migrate toward the water surface in search of duck definitive hosts (Feiler and Haas, Reference Feiler and Haas1988; Rudko et al., Reference Rudko, Reimink, Froelich, Gordy, Blankespoor and Hanington2018), making surface water currents from off-shore a potentially important SI risk factor in deep-water inland lakes. As a result, SI cases might sometimes occur at sites that lack local populations of infected host snails, due to an influx of cercariae from off site (Leighton et al., Reference Leighton, Zervos and Webster2000; Rudko et al., Reference Rudko, Reimink, Froelich, Gordy, Blankespoor and Hanington2018). Anecdotally, beachgoers and lifeguards in Northern Michigan have reported seeing higher SI incidence when winds originate from offshore (Al Flory, pers. comm.). Recent results by Rudko et al. (Reference Rudko, Reimink, Froelich, Gordy, Blankespoor and Hanington2018) showed significant wind direction effects at multiple sites on northern Michigan lakes, though their analysis focused on weekly rather than daily variation and on cercaria abundance rather than the resulting SI incidence. Based on these observations and results, we hypothesized that a recreational beach would have a higher SI risk on days with stronger winds originating from offshore, leading to onshore surface currents that could transport cercariae from deep-water snail beds to the shallow-water swimming areas.
We tested these hypotheses using a dataset of SI reports collected at Congressional Summer Assembly (CSA) Beach on Crystal Lake, Michigan, where the dominant SI parasite is thought to be Trichobilharzia stagnicolae and the dominant host snail is Lymnaea catescopium [ = Stagnicola emarginata; Laman et al., Reference Laman, Boss and Blankespoor1984; Correa et al., Reference Correa, Escobar, Durand, Renaud, David, Jarne, Pointeir and Hurtrez-Bousses2010] (Rudko et al., Reference Rudko, Reimink, Froelich, Gordy, Blankespoor and Hanington2018). While traditional methods for determining SI risk are labour-intensive and require specialized expertise to identify parasites (Kolářová et al., Reference Kolářová, Horák and Skírnisson2010), recent DNA detection and quantification methods are faster and more accurate (Rudko et al., Reference Rudko, Reimink, Froelich, Gordy, Blankespoor and Hanington2018, Reference Rudko, Turnbull, Reimink, Froelich and Hanington2019). However, the distinctive rash caused by SI makes it amenable to data collection by citizen scientists, and public beaches have staff (e.g. lifeguards and park managers) during the summer months with the ability to collect SI incidence data and measurements of possible environmental drivers such as temperature, wind speed and wind direction. This study focused on using these kinds of data collected by lifeguards at CSA beach during each summer season over a 4-year period from 2013 to 2016.
Materials and methods
Data collection
Lifeguards at CSA collected daily data for 7 weeks from late June to early August each year during the 2013–2016 period (Table 1). Lifeguards counted the number of self-reported SI cases (by swimmers) each day. Lifeguard staff also counted the total number of swimmers twice daily, once per session. The morning sessions ran until 1100 h, and counts were performed at ~1000 h. Afternoon sessions ran from 1300 to 1700 h, and counts were performed at ~1600 h. The beach is open at all times, but lifeguards are on duty only during these sessions. Lifeguards also collected surface water temperature using a Pentair R141036-127 floating tube thermometer, wind speed using an Ambient Weather WM-2 handheld anemometer (miles per h) and wind direction to the nearest 8-way direction (i.e. N, E, S, W, NE, SE, SW or NW) using known landmarks oriented from a map of Crystal Lake. However, CSA beach is located in the western part of Crystal Lake and oriented such that northeast winds are directly onshore and perpendicular to the shoreline. We were unable to find a complete dataset for cloud cover at our survey site for the entirety of our sampling period. We therefore used precipitation as a proxy for cloud cover, where days with precipitation are more likely than not to have cloud cover. Precipitation data for all sampling dates was obtained from the NOAA Online Weather Data (NOWData) tool from a National Weather Service station located near CSA beach in Frankfort, MI. Precipitation was quantified using two methods: (1) presence/absence of precipitation as a binary variable (NWSprecip1) and (2) total precipitation per day in inches as a continuous variable (NWSprecip2). Days with trace precipitation (i.e. days with observed precipitation below the minimum reportable interval) were treated as having the presence of precipitation (NWSprecip1) as any day with precipitation might have a greater probability of being partially cloudy or overcast but having 0 inches of precipitation (NWSprecip2). All variables used in statistical analyses were generated based on these data.
Summary statistics for the dataset over the 4-year sampling period at CSA beach

Analyses based on self-reporting data are potentially unreliable due to the possibility of misidentified or unreported cases. However, CSA beach is a private community that is only open to members and their guests, Crystal Lake has a long history and familiarity with SI and many members have been visiting CSA beach for generations. CSA members were informed about the study via regular meetings and newsletters, and they were encouraged to report cases to the lifeguard on duty. They were provided with informational brochures describing SI and its symptoms, and a large sign was posted at the beach informing people about potential SI risk (Figs S1 and S2). Brochures and a publicly available newsletter were also distributed to members and posted throughout Benzie County, Michigan. Based on the high level of local awareness and education about SI risks and symptoms, we decided it was reasonable to analyse changes in relative risk through time within this dataset, making the implicit assumption that any errors due to misidentification or under-reporting were randomly distributed across time.
To allow analysis of temporal autocorrelations and lagged effects of past temperatures, we calculated the average of previous 1-, 3-, 5- and 7-day SI cases and temperatures (PrevTotal1, 3, 5, 7 and AvgPrevTemp1, 3, 5, 7), and we restricted the analysis to days when these data were available (i.e. removing the first 6 days of each year). The PrevTotal variables also served the purpose of accounting for other sources of temporal autocorrelation, including well-described summer peaks in trematode cercaria abundance for many species (Kube et al., Reference Kube, Kube and Dierschke2002; Valdovinos and Balboa, Reference Valdovinos and Balboa2007; Galaktionov et al., Reference Galaktionov, Bustnes, Bårdsen, Wilson, Nikolaev, Sukhotin, Skírnisson, Saville, Ivanov and Regel2015) or the potential for a random event to cause synchronized emergence of cercariae from multiple snails (e.g. simultaneous snail infections from a single bird visitation). We excluded a single day that was missing temperature data, as well as subsequent days for which previous average temperatures could not be calculated. We also removed one datapoint from the analysis due to missing wind speed data. There was a single day where the recorded number of SI cases was greater than the recorded total number of swimmers; in this case, we adjusted the total number of swimmers to equal the reported number of SI cases (i.e. proportion of SI that day = 1.0).
Statistical methods – environmental factors and time of day
We used generalized linear mixed-effects models within program R (‘glmer’ function in the lme4 package) to determine the best predictors of the SI cases on a daily time scale (Bates et al., Reference Bates, Maechler, Bolker and Walker2015; R Core Team, 2019). We used a binomial distribution in these models to test for effects of environmental factors on the probability of a given swimmer contracting swimmer's itch, based on the count of swimmers positive (i.e. number of reported SI cases) and negative (i.e. the difference between total swimmers and number of reported SI cases) for SI. We included a random effect of ‘Day’ in each model to account for daily variation and to ensure the day was treated as the unit of replication for treatment variables measured on a daily timescale, rather than individual swimmer (which would have resulted in sample size inflation). To test for a time of day (TimeOfDay) effect, we ran a separate set of models in which the morning and afternoon counts were coded separately in the dataset; these models also included a random effect of ‘Day’.
We had trouble achieving convergence for complex models that included large numbers of predictor variables, precluding the use of backward selection procedures to explore parameter space. However, most models converged readily with fewer predictors included. Therefore, we used a forward selection approach to explore contributions of various environmental factors to SI risk. In forward selection, we start with simple models that only include one predictor variable at a time, select the predictor that explains the most variation, and systematically add predictors to the model until no additional variables significantly improve the model. We used a P value threshold of 0.05 from a likelihood-ratio test (‘Anova’ function in the package car) as our criterion for variable inclusion in each final model (Fox and Weisberg, Reference Fox and Weisberg2011). We encountered convergence warnings in ~15% of all models run during model selection. Warnings (unlike errors) indicate that the model converged successfully but one or more convergence criteria exceeded default tolerances. To confirm whether outcomes from models with convergence warnings were reasonable, we conducted alternative models using a traditional linear regression approach, with the arcsine-square root transformed proportion of swimmers contracting SI (on a given day or session) as the response variable. We chose to use the traditional arcsine-square-root transformation over a logit transformation because our dataset contained several 0's and 1's, which would have required separate transformations to these data points. Additionally, all final models were compared to arcsine-square root linear models with the same predictors.
In the analysis of wind direction effects in the full binomial model, we initially treated wind direction as a single categorical predictor with eight categories (resulting in seven dummy variables added to each model). However, this model converged with warnings, apparently due to high autocorrelation among dummy variables. We therefore generated new wind-direction variables in which adjacent wind directions were paired (e.g. N + NE, E + SE, etc.). Pairing directions generated two possible wind direction variables, which we considered as possible predictors in model selection (N + NE for WindDirGroup1 vs NW + N for WindDirGroup2). This reduced the number of categories to four per predictor (i.e. three dummy variables per predictor), greatly reducing model complexity and allowing model convergence without warnings. We found that WindDirGroup1 was the better predictor of the two wind-direction variables during model selection, and the two variables explained much of the same variation leading to exclusion of WindDirGroup2, likely due to directly perpendicular northeast winds paired with north or east winds hitting the site at similar angles. Other predictors considered in model selection included: current daily water temperature (WaterTempC), wind speed (WindVel), a wind speed and direction interaction (WindDirGroup1 × WindVel), and the average of previous 1-, 3-, 5- and 7-day temperatures and number of SI cases (AvgPrevTemp1, 3, 5, 7 and PrevSi1, 3, 5, 7), the number of swimmers per day (SwimTotal) and two metrics of precipitation (NWSprecip1 and NWSprecip2). To investigate the time of day effect, we used an alternative version of the dataset separated into two rows per day (i.e. AM and PM counts for total swimmers and SI cases) and conducted forward selection considering the same predictors as above plus TimeOfDay and number of swimmers per session.
No temporal predictors (i.e. previous temperature or SI cases) were significant throughout model selection in either the daily or the time-of-day analysis, so we re-ran our final models using a full version of each dataset (i.e. adding back days for which previous-day temperature or SI data were unavailable). To explore the proportion of variation ‘explained’ by each of the final binomial models, we calculated the generalized coefficient of determination (R 2 for likelihood statistics) as detailed by Nagelkerke (Reference Nagelkerke1991).
Post-hoc comparisons – wind direction
To further investigate the wind direction effect, we conducted post-hoc comparisons of each combination of adjacent wind directions, by running binomial mixed-effects models on subsets of the data (e.g. N vs NE, NE vs E, etc.). P values from this analysis were then corrected to control for the false discovery rate of multiple comparisons (FDR = 0.05). We also used binomial mixed models on data subsets to investigate the effect of wind speed (WindVel) on the number of SI cases for each individual wind direction (N, NW, W, etc.).
Data availability
Data are available on GitHub: https://github.com/jasonsckrabulis/sckrabulis_etal_wind_predicts_si.
Results
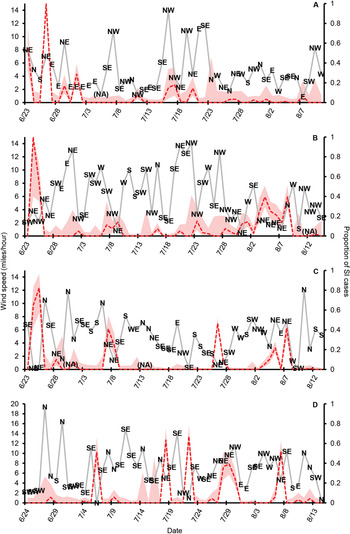
Consistent with anecdotal reports, the CSA data documents large day-to-day variation in the proportion of swimmers reporting SI (Fig. 1). The best binomial mixed-effects model for predicting daily SI risk included wind direction, wind speed and total number of swimmers, all of which were significant in the full model (P < 0.05; R 2 = 0.11; Table 2). The wind direction explained more variation as a single predictor (R 2 = 0.09) than either wind speed (R 2 = 0.005) or number of swimmers (R 2 = 0.009). Multiple comparisons analysis of adjacent wind directions revealed a significant increase in the probability of a swimmer contracting SI on days when winds originated from the northwest, north or northeast, with the highest risk of SI on days with northeasterly winds (P adj < 0.05; Fig. 2). No other wind directions were significantly different from adjacent directions (P adj > 0.05; Table 3). We found no significant effects of precipitation or current-day temperature in any statistical model, and none of the temporal variables (past temperatures or SI cases) was significant predictors in any model at any of the temporal scales we examined (P > 0.05). Temperature was not autocorrelated with the wind direction, wind speed or either precipitation variable (P > 0.05).
Daily variation in the wind direction, wind speed (solid grey line; primary axis) and proportion of swimmers reporting SI (dashed red line; secondary axis) at CSA beach in (A) 2013, (B) 2014, (C) 2015 and (D) 2016. The wind direction is indicated by text labels (N, NE, E, SE, S, SW, W, NW). The shaded area represents 95% Clopper–Pearson exact confidence intervals for binomial proportion data (‘exactci’ function in the package PropCIs; Scherer, Reference Scherer2018). In Panel A, the ‘(NA)’ label indicates missing a wind direction datapoint. In panels B and C, the ‘(NA)’ labels indicate no confidence interval calculation due to zero swimmers those days.

Proportion of swimmers reporting SI on days with winds originating from each direction at CSA beach. The solid black line represents the average proportion of SI cases per day (arcsine-square root transformed to improve normality). Dashed red lines indicate ± 1 s.e.. Significant differences between adjacent directions are indicated by * (P adj < 0.05 after adjusting to control the false discovery rate; paired comparisons using binomial mixed-effects models). CSA beach image© 2017 Google map data, altered by J.P. Sckrabulis.

Likelihood ratio statistics indicating the significant contribution of environmental predictors in the final best fit models for environmental effects and time of day on SI cases

All statistics were based on both binomial mixed-effects models (χ 2 test) that incorporated a random effect of ‘Day’, which was the replication unit in the environmental predictors model, and arcsine-square root transformed linear models (F test). All other analysed predictors failed to significantly improve the model (P > 0.05) and were therefore excluded from the final model. χ 2 degrees of freedom in the binomial models were equal to the numerator degrees of freedom in the linear models. Coefficients were derived from the binomial models.
a Categorical predictors comprised multiple ‘“dummy variables’” and therefore do not have a single meaningful coefficient.
b Model ran but with convergence warnings.
* Significant effect (P < 0.05).
Multiple comparison statistics indicating the significant contribution of wind speed to SI cases in models by individual direction

All statistics were based on both binomial mixed-effects models (χ 2 test) that incorporated a random effect of ‘Day’, which was the replication unit in the environmental predictors model, and arcsine-square root transformed linear models (F test). χ 2 degrees of freedom in the binomial models were equal to the numerator degrees of freedom in the linear models. All predictors are categorical; therefore, all dummy variables do not have meaningful coefficients. Original and adjusted for false discovery rate (0.05) P values are reported.
a Model ran but with convergence warnings.
* Significant effect P < 0.05.
The overall effect of the wind speed on SI risk had a negative coefficient, with higher wind speeds resulting in a lower probability that an individual swimmer would report SI on a given day (P < 0.001; Table 2). A follow-up analysis of wind-speed effects for individual wind directions revealed that this effect was largely driven by winds coming from the north (Fig. 3). The wind speed had a significant negative effect on the proportion of SI cases when the wind came from the north (P = 0.0142; Table 4) but not from other directions (P > 0.05; Table 4).
Proportion of swimmers reporting SI as a function of wind speed, for days with wind originating from one of three directions: North (open squares; dashed line), Northeast (open circles; solid line) or East (open triangles; dotted line).

Likelihood ratio statistics indicating the significant contribution of wind speed to SI cases in models by individual direction

All statistics were based on both binomial mixed-effects models (χ 2 test) that incorporated a random effect of ‘Day’, which was the replication unit in the environmental predictors model, and arcsine-square root transformed linear models (F test). χ 2 degrees of freedom in the binomial models were equal to the numerator degrees of freedom in the linear models.
a Model ran but with convergence warnings.
b Model failed to run due to an absence of swimmer's itch cases on days with southerly winds.
* Significant effect (P < 0.05)
In the model describing within-day variation, time of day had a significant negative effect on the number of SI cases reported, with afternoon swimmers being less likely to report SI (Fig. 4; Table 2). The best binomial mixed-effects model for predicting the risk of SI in the time-of-day model also contained significant wind direction and wind speed effects, consistent with the final model from the analysis of daily variation (all P < 0.01; R 2 = 0.24; Table 2). The final time-of-day model converged with warnings; however, the time of day effect remained significant when the other daily predictors were removed from the model (Table 2). Time of day explained more variation as a single predictor (R 2 = 0.19) than either wind direction (R 2 = 0.04) or wind speed (R 2 = 0.002). Unlike in the among-day variation model (Table 2), the number of swimmers per day did not emerge as a significant predictor. This result implied that the SwimTotal effect in the among-day analysis was entirely accounted for by incorporating TimeOfDay into the statistical model, potentially indicating an autocorrelation between these two predictor variables. Upon investigation, we confirmed a relationship between these predictors, where days with more total swimmers also had a significantly smaller proportion of swimmers in the morning session (Fig. S3).
Average proportion of swimmers reporting SI in the morning and afternoon sessions at CSA beach. Error bars indicate ± 1 s.e..

The results from linear models (with arc-sine-transformed SI prevalence as the response variable) were qualitatively consistent with binomial model outputs (Tables 2–4), with one exception. There was no significant interaction between the wind direction and wind speed interaction in the binomial mixed-effects models, but linear regression indicated a significant interaction between these predictors in both of among day and within day analyses (both P < 0.05). An interaction between these two variables would indicate that the wind speed effect depended on the wind direction. However, wind speed effects for individual wind directions were consistently negative or non-significant (Table 4), suggesting that any interaction between these variables was driven by quantitative rather than qualitative differences (i.e. changes in the strength of the wind-speed effect).
Discussion
We found that the wind direction had highly significant effects on the probability of a swimmer reporting SI at the CSA beach, with the greatest SI risk occurring on days with direct onshore winds from the northeast (i.e. perpendicular to the shoreline; Fig. 2). The wind direction was also highly variable at CSA beach from day to day, helping to account for the large fluctuations in SI incidence from one day to the next (Fig. 1). Our findings corroborate anecdotal evidence from the lifeguards at CSA beach, where onshore wind is a commonly cited SI risk factor, as well as field monitoring conducted by Rudko et al. (Reference Rudko, Reimink, Froelich, Gordy, Blankespoor and Hanington2018), where wind direction was a significant predictor of cercaria abundance. This might be because most cercariae that attack swimmers at CSA beach are produced by infected snails living in offshore beds and are transported to shore via wind-driven surface currents (Upatham, Reference Upatham1974). Lymnaeid snails are known for preferring deep-water habitat (Laman et al., Reference Laman, Boss and Blankespoor1984), and SI-causing cercariae are known to move towards the water surface to seek out definitive hosts (Price, Reference Price1931; Talbot, Reference Talbot1936; Najim, Reference Najim1956; Rudko et al., Reference Rudko, Reimink, Froelich, Gordy, Blankespoor and Hanington2018). Direct onshore winds can cause surface currents perpendicular to the shoreline (Weber, Reference Weber1983), and a combination of wind-driven onshore surface currents and surface-seeking cercaria behaviour likely results in cercariae aggregating in the shallow water where most recreational swimming occurs (Leighton et al., Reference Leighton, Zervos and Webster2000; Verburgge et al., Reference Verbrugge, Rainey, Reimink and Blankespoor2004a). While there was a significant negative effect of swimmer numbers in the among-day variation model, this effect disappeared when we accounted for the time of day in the within-day analysis (Table 2). This was likely caused by a confoundment between the number of swimmers and time of day, where days with more total swimmers had a smaller proportion of swimmers in the morning session (Fig. S3).
Northeasterly winds led to dramatically increased SI risk relative to northerly or easterly winds, despite each of these wind directions being arguably ‘on-shore’. At CSA beach, northerly or easterly winds hit the shore at an angle (Fig. 2), which might generate surface currents parallel to the beach rather than directly toward the beach, carrying cercariae away from the site and preventing an aggregation by the shoreline. This might account for northerly and easterly winds resulting in so many fewer SI cases per swimmer than direct northeasterly winds (Fig. 2). Wind from the north or northwest also generated significantly more SI cases than wind from the west or south (Fig. 2), which hints at the possible presence of an important source of cercariae located to the north of the CSA beach.
The wind speed had a significant negative effect on SI risk in our statistical models, contrary to our a priori prediction. There are a few possible explanations for this result. Relatively slow surface currents have been shown to bring cercariae many times further than they could swim on their own (Upatham, Reference Upatham1974), so perhaps even slow onshore winds are sufficient to induce cercaria aggregation in the shallows. Higher wind speeds likely increase wave action and turbulence, which might decrease the ability of trematode cercariae to locate and find a suitable host by continuously changing their orientations to various stimuli (Jousson and Bartoli, Reference Jousson and Bartoli2000; Fingerut et al., Reference Fingerut, Zimmer and Zimmer2003). We also noticed that high-speed winds (greater than 10 mph) nearly always came from the north (Figs 1 and 3), and it is possible that this correlation between wind speed and wind direction influenced the overall negative effect of the wind speed in the primary statistical model (Table 2). As discussed above, northerly winds likely drive currents parallel to the shore that might prevent cercaria aggregation in the shallows, and these currents might be stronger on days with higher wind speeds. Further research is thus needed to determine whether the wind speed has a generally negative effect on SI incidence, rather than an effect specific to the orientation or hydrology of the CSA beach.
The absence of any hypothesized current or past temperature effects on SI risk was initially surprising to us, given the strong temperature effects reported in past laboratory studies of snail-borne parasites. However, relatively low local snail abundance on the CSA beach (Al Flory, pers. comm.), combined with the highly significant effect of wind direction on SI risk, suggests that a large proportion of the cercariae causing SI at this site are drifting into shore from deeper water. If this is true, then local temperatures at the CSA beach might have little effect on the deep-water infected snails that actually produced most of the cercariae. Lymnaeid snails are known for preferring deeper, colder waters far from shore and for migrating in and out of the shallows (Clarke, Reference Clarke1981; Correa et al., Reference Correa, Escobar, Durand, Renaud, David, Jarne, Pointeir and Hurtrez-Bousses2010). Some species of snails have also been shown to exhibit a sort of reverse behavioural fever, seeking out cool microhabitats in response to trematode infection or injury, which might result in avian schistosome-infected snails moving into even deeper water than uninfected snails (Hodasi, Reference Hodasi1976; Żbikowska and Cichy, Reference Żbikowska and Cichy2012; Żbikowska and Marszewska, Reference Żbikowska and Marszewska2018). Most hypotheses regarding temperature effects (i.e. the thermal stress hypothesis; Paull et al., Reference Paull, Raffel, LaFonte and Johnson2015) focus on cercaria production within snails, where direct temperature effects are well documented for schistosomes and non-schistosome trematodes (Ataev, Reference Ataev1991; Paull et al., Reference Paull, LaFonte and Johnson2012; Studer and Poulin, Reference Studer and Poulin2013). Since the current dataset is limited to environmental data collected in the nearshore environment, it is poorly suited to test for hypothesized temperature effects on deep-water snail hosts. Therefore, these temperature hypotheses remain to be rigorously tested as potential drivers of day-to-day variation in trematode infection risk.
As predicted, SI risk was elevated in the morning swimming session. This was likely due to light- or temperature-induced diurnal patterns of schistosome cercaria emergence from infected host snails at sunrise (Kuntz, Reference Kuntz1947; Horák et al., Reference Horák, Mikeš, Lichtenbergová, Skála, Soldánová and Brant2015) or increased recreational swimming activity in the morning (Verbrugge et al., Reference Verbrugge, Rainey, Reimink and Blankespoor2004a; Reference Verbrugge, Rainey, Reimink and Blankespoor2004b). Exposure to light after prolonged darkness (i.e. night) has been shown to induce high rates of cercaria emergence in the morning (Soldánová et al., Reference Soldánová, Selbach and Sures2016). Some SI-causing cercariae also have a strong attraction to light (Talbot, Reference Talbot1936; Wright, Reference Wright1974). Avian schistosome cercariae have short lifespans due to a limited energy reserve (Islam, Reference Islam1986; Żbikowska, Reference Żbikowska2005), so any cercariae still present later in the day probably have depleted energy reserves and limited capacities to seek or infect hosts (Lawson and Wilson, Reference Lawson and Wilson1980; Whitfield et al., Reference Whitfield, Bartlett, Khammo and Clothier2003). These results are consistent with the findings of Rudko et al. (Reference Rudko, Reimink, Froelich, Gordy, Blankespoor and Hanington2018), who found higher abundance of avian schistosome cercariae in water samples collected in the morning, compared to afternoon samples collected on the same day from the same sites.
As with any correlational study, the day-to-day patterns of SI risk we detected in this study would need to be further studied to determine if predictor variables are truly causal. This is particularly true for conclusions drawn from the current dataset, which was based on self-reporting data on SI incidence and collected by lay scientists. Furthermore, SI symptoms can sometimes take more than one day to appear (Augustine and Weller, Reference Augustine and Weller1949); thus, it is possible for SI reports to come from people who contracted SI the previous day, or after swimming at another beach. It is also important to note that the scope of this study was restricted to CSA beach, which may have unique biological or hydrological characteristics that increase the importance of wind direction compared to other locations in northern Michigan. However, the wind direction effects observed in this study were strong and consistent across multiple years, suggesting that there is a real biological connection between wind direction and SI incidence at the CSA site. Furthermore, our results support the more recent findings from Rudko et al. (Reference Rudko, Reimink, Froelich, Gordy, Blankespoor and Hanington2018) across multiple Michigan lakes, including CSA beach. However, further study of daily SI incidence at additional sites is needed to determine if our results are generalizable to other beaches on Crystal Lake or other lakes.
Conclusions/future directions
Overall, the wind direction was a key predictor of SI risk at CSA beach. On days when winds originated from the northeast, the risk of swimmers contracting SI was significantly increased, likely due to transport of cercariae from offshore lymnaeid snail beds via wind-induced surface currents. We also found that wind speed was a significant negative predictor in the overall model, possibly because high-speed winds create more turbulent water that decrease the ability of cercariae to find and penetrate hosts. However, this pattern was largely driven by a negative effect of high-speed winds from the north, which was less associated with high SI risk than northeasterly winds and more likely to generate water currents parallel to the shoreline. Time of day was also a key predictor of SI risk at CSA beach, with morning swimmers being more at risk for SI than afternoon swimmers, likely due to light-induced emergence of infectious cercaria at sunrise (Soldánová et al., Reference Soldánová, Selbach and Sures2016).
The results of this study highlight the importance of understanding factors driving day-to-day variation in parasite exposure, and the potential utility of this information for developing local control strategies. Indeed, CSA staff already use this information to generate recommendations for ways swimmers can mitigate their exposure to SI, by warning swimmers of potentially elevated SI risk on days with direct onshore wind. Few studies have examined drivers of day-to-day variation in exposure to trematode parasites, including the causative agents of human schistosomiasis, in part because the scientific tools needed to measure cercaria abundance in the water have only been developed in the past decade (Jothikumar et al., Reference Jothikumar, Mull, Brant, Loker, Collinson, Secor and Hill2015; Rudko et al., Reference Rudko, Reimink, Froelich, Gordy, Blankespoor and Hanington2018, Reference Rudko, Turnbull, Reimink, Froelich and Hanington2019). Future studies aimed at reducing incidence of these parasitic diseases should consider the potential importance of factors driving daily or diurnal fluctuations in exposure risk.
Supplementary material
The supplementary material for this article can be found at https://doi.org/10.1017/S0031182020000074
Acknowledgements
We would like to thank Ted Fisher, Joel Buzzell, Jana Way, Ellen Herscher, the Congregational Summer Assembly, Crystal Lake Watershed Association and especially Leslie Buntin Ritter and the CSA Waterfront Staff for their efforts in collecting data for this study.
Financial support
This work was partially supported by a personal financial contribution by A.R.F. and his wife Monica Schultz. Partial support was also provided by an NSF-CAREER grant to T.R.R. (IOS-1651888) and a Teaching Assistantship from Oakland University to J.P.S.
Conflict of interest
None.
Ethical standards
The study protocol was reviewed by the Oakland University Institutional Review Board for the Protection of Human Subjects and it was determined that the project does not meet the definition of human subjects research under the purview of the IRB according to federal regulations. More specifically, the study used a deidentified data set that cannot be linked back to individuals. It complies with the Helsinki Declaration of 1975, as revised in 2008.