Introduction
Deterioration of seeds during storage has profound influences on agriculture and conservation. In agriculture, seed quality in terms of seed longevity is rarely considered in breeding programmes, yet the ability to deliver improved traits in a well-storing seed, to extend the marketable life of a seed lot, and to prevent losses of inventory by ‘unscheduled’ deterioration would be highly beneficial to the industry. Ex situ conservation efforts depend on maintaining seed viability in seed banks, and major challenges are predicting when inventories should be regenerated and detecting early stages of deterioration without consuming samples in repetitive viability monitoring assays.
The physical, chemical and biological properties of the seed that contribute to its stability in storage remain poorly understood. We know that deterioration rate is dependent on the temperature and relative humidity (which determines seed water content) of the storage conditions (Roberts and Ellis, Reference Roberts and Ellis1989; Walters, Reference Walters1998). Relative longevity among species is determined by the general response to storage conditions (Justice and Bass, Reference Justice and Bass1978; Priestley et al., Reference Priestley, Cullinan and Wolfe1985; Ellis, Reference Ellis1991; Walters et al., Reference Walters, Wheeler and Grotenhuis2005a).
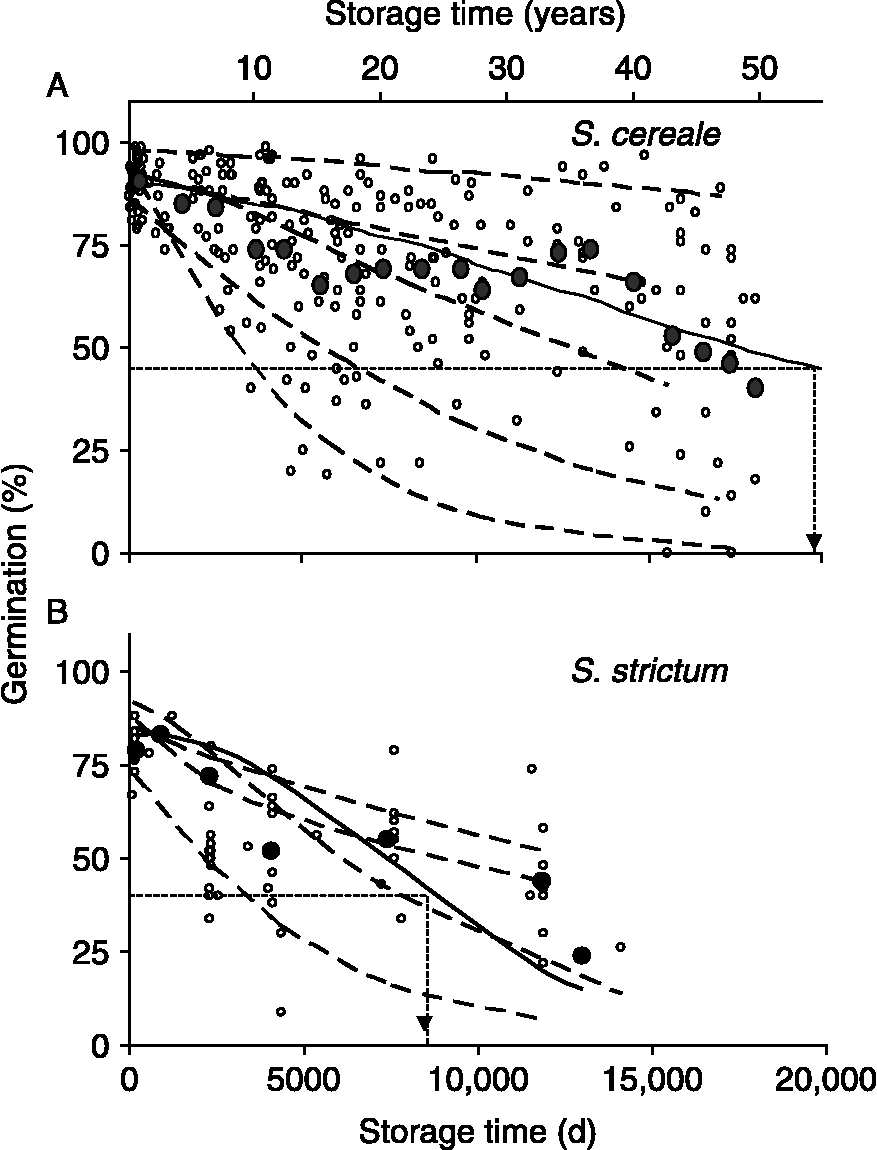
However, species characteristics for seed longevity are only guidelines that provide gross estimates of how long seeds will survive in storage. Within a species, longevity varies greatly. An illustration of this is given by germination results of accessions of Secale seeds stored for 40–50 years under standard conditions at the USDA-ARS National Center for Genetic Resources Preservation (formerly National Seed Storage Laboratory) (see Fig. 1). These seeds were produced and harvested between 1960 and 1975 under prescribed procedures, and stored at 30–50% relative humidity (RH) and 5°C until 1978 when freezer systems were introduced to NCGRP and seeds were switched to − 18°C storage. In other words, efforts were made to produce, store and evaluate seeds under standardized conditions. Longevity of S. cereale and S. strictum grains under these storage conditions was estimated by pooling germination data for 36 and 10 accessions, respectively, and the storage time in which viability declined to 50% of original (P50) was about 54 and 23 years, respectively. P50 values calculated for individual accessions differed by eightfold to >100-fold, ranging from 11 to 1709 (median = 48) and 9 to 72 (median = 25) years for S. cereale and S. strictum, respectively. This wide variation in longevity arises from unknown differences in seed quality that are likely influenced by genetic and environmental factors during growth, seed maturation and post-harvest. Hence, understanding the nature of seed quality factors that contribute to seed longevity would lead to better predictions of longevity, detection of the early signs of deterioration and, ultimately, enhancement of seed quality.
Changes in germination of 36 accessions of Secale cereale (A) and ten accessions of S. strictum (B) seeds harvested between 1957 and 1975 and stored at USDA-ARS-NCGRP (experiment 1). Seed water content was between 0.085 and 0.105 g H2O (g dw)− 1, and storage temperature was 5°C until 1978 when it was switched to − 18°C. Open symbols represent germination assays conducted by certified seed analysts. Solid symbols represent pooled data to describe the overall trend for the species (Walters et al., Reference Walters, Wheeler and Grotenhuis2005a): mean germination was calculated within each thousand-day interval. Solid curves are the least squares fit of the Avrami equation to pooled data and dashed curves represent the model fitted to selected individual accessions to give representative examples of deterioration time courses [there are a total of 36 (A) and ten (B) individual time courses, one for each accession]. These curves were used to calculate the time to 50% of maximum germination (P50) for pooled data (dashed arrows) and individual accessions.
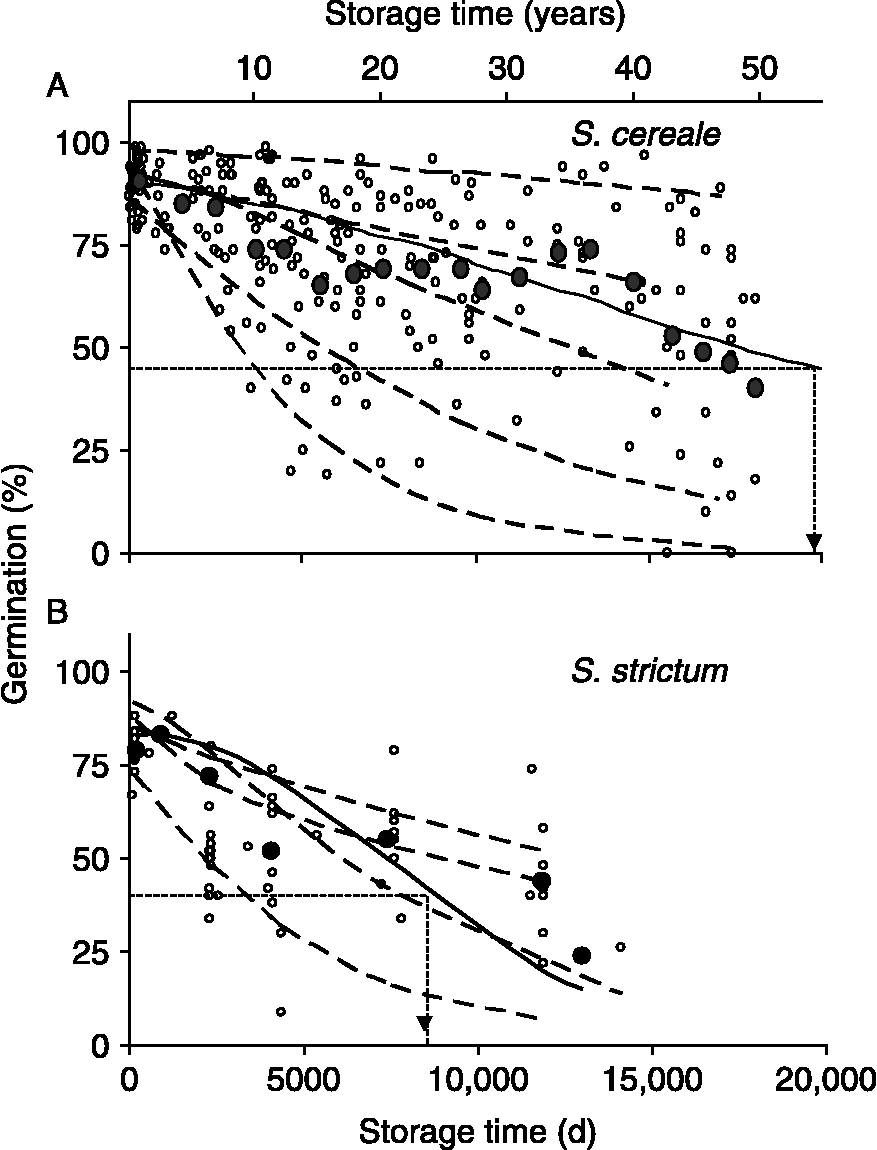
The relationship between initial seed quality and seed longevity is difficult to discern, largely because seed longevity is so difficult to measure under realistic conditions. The early stages of seed deterioration are asymptomatic and the time frame necessary to reliably detect ageing is impractically long. Hence, longevity is often quantified ‘after the fact’, when the lost viability makes it impossible to ascertain the initial condition of the seed. Traditionally, quality was approximated by initial germination percentage, based on the presumption that seed lots having low germination were stressed or already ageing and so were likely to reach 0% germination faster. However, low germination may arise from a number of factors that do not affect ageing rate (Mead and Gray, Reference Mead and Gray1999), and poor correlations between initial germination percentage and longevity of a seed lot is now generally acknowledged. Moreover, seed lots with high initial germination percentages have widely varying longevities (Fig. 1). Tests to measure vigour and stress tolerance were developed to distinguish among seed lots with initially high germination percentages (Delouche and Baskin, Reference Delouche and Baskin1973; Powell and Matthews, Reference Powell and Matthews1981). These challenge tests, called ‘accelerated ageing’ (AA) or ‘controlled deterioration’ (CD) tests, measure viability loss of seeds following exposure to warm (40–60°C), humid (75–100% RH) conditions. Because seeds die within an experimentally tractable time frame, AA/CD tests are now commonly used to estimate relative differences in seed longevity among seed lots (Jianhua and McDonald, Reference Jianhua and McDonald1997; McDonald, Reference McDonald1999; Tesnier et al., Reference Tesnier, Strookman-Donkers, vanPijlen, van der Geest, Bino and Groot2002; Black, 2006). Moreover, models of seed deterioration, such as Roberts and Ellis's viability equations, use scaling factors to predict seed longevity under warehouse or genebank storage conditions from viability losses measured under AA/CD conditions (Ellis, Reference Ellis1991; Hay et al., Reference Hay, Mead, Manger and Wilson2003; Ellis and Hong, Reference Ellis and Hong2007). The scaled response is assumed to be uniform across seed lots (i.e. models have species-dependent constants).
Using AA/CD tests to predict actual or relative longevity under dry storage presumes that deteriorative reactions under AA/CD and dry conditions are the same and that moisture and temperature have the same effect on reaction kinetics across seed lots within a species. Precedence from empirical observations and thermodynamic considerations strongly suggest that moisture and temperature have complex effects on chemical activity and physical structure within seeds. For example, we know that respiration and microbial proliferation occur under AA/CD conditions (Walters et al., Reference Walters, Hill and Wheeler2005b), that low oxygen levels within sealed containers increase damage (Ibrahim et al., Reference Ibrahim, Roberts and Murdoch1983; Walters et al., Reference Walters, Pammenter, Berjak and Crane2001), and that these stresses do not occur under dry conditions, but a host of other reactions do (Walters, Reference Walters1998; Walters et al., Reference Walters, Hill and Wheeler2005b). We also know that water and heat plasticize aqueous glasses and eventually dissolve solutes; that mobility within solid–fluid structures, such as glasses, is critical to ageing kinetics (Buitink and Leprince, Reference Buitink and Leprince2004; Walters, Reference Walters2004; Ballesteros and Walters, Reference Ballesteros and Walters2007); and, further, that water and heat affect mobility of solid–fluid structures differently, depending on biochemical composition and molecular organization (Walters and Koster, Reference Walters, Koster, Jenks and Wood2007). Many studies relate seed longevity to solutes that influence water behaviour (e.g. Horbowicz and Obendorf, Reference Horbowicz and Obendorf1994), and there is an implicit assumption to these studies, that seed ageing rates are strongly influenced by moisture × composition interactions which are likely to vary within species. Hence, the presumed correlation between seed ageing rates under humid and dry conditions is questionable and must be verified before AA/CD tests are accepted as a reliable method to estimate seed longevity under typical storage conditions.
The purpose of this paper is to quantify the relationship between deterioration rates of seeds stored under humid and dry conditions among cultivars of rye, wheat and the intergeneric cross triticale. Optimum design for this type of study would require large amounts of high-quality grain from diverse seed lots having relatively similar growth and harvest provenance. Our compromise to this near-impossible circumstance was to use the closely related taxa, Secale cereale (rye) and Triticum aestivum (wheat), and the intergeneric cross, triticale, to obtain diversity; cultivars to obtain high-quality seeds at sufficient quantity; and seed sources harvested from experimental stations in defined regions of Poland to control growth, harvest and processing conditions.
Secale cereale (rye) and Triticum aestivum (wheat) are consistently rated as grains producing seeds having medium–short and medium shelf-life, respectively (Priestley et al., Reference Priestley, Cullinan and Wolfe1985; Walters et al., Reference Walters, Wheeler and Grotenhuis2005a). Rye and wheat have similar geographic origins and domestication histories, although the lesser agronomic importance of rye is sometimes attributed to its off-flavour. Rye plants are more tolerant than wheat to drought or cold growing conditions, and wheat is generally a higher-yielding grain crop. Rye grains are usually smaller than wheat and have lower gluten and soluble sugar contents (about 2–4% less by dry mass) but higher soluble fibre and protein content (about 2–5% more per dry mass) (Earle and Jones, Reference Earle and Jones1962; Kuo et al., Reference Kuo, Van Middlesworth and Wolf1988). Triticale cultivars tend to have the high stress tolerance exhibited by rye crops. Triticale grains are larger than rye and smaller than wheat and are more digestible than rye. Triticale has a higher starch content than rye and lower gluten content than wheat (Oettler, Reference Oettler2005). Here we report that triticale seeds have longevity intermediate between rye and wheat.
Materials and methods
The studies were divided into experiments that demonstrate the problem of within-species variation in longevity under typical seed-banking operations and the time frame needed to detect differences (Fig. 1), and a second set of experiments that investigated storage conditions which can be meaningfully used to study variation in longevity within a shorter period of time. The second set of experiments was conducted at 35°C only, to eliminate storage temperature as a variable. Even at this relatively high temperature, deterioration under the drier conditions occurred over a period of 5–6 years. Investigating the hypothesis of moisture × cultivar interactions required a highly replicated experimental design which was achieved through parallel experiments conducted independently in two collaborating laboratories.
Plant materials, storage temperature and viability assays
Experiment 1
To illustrate inherent variability of seed longevity in rye, viability monitoring results are given for 36 accessions of S. cereale and ten accessions of the wild progenitor, S. strictum (formerly S. montanum) that were received by USDA-National Center for Genetic Resources Preservation (NCGRP) between 1960 and 1975. These accessions were grown at various locations in the USA and Canada under controlled pollination conditions and shipped to Fort Collins within 1–2 years after harvest, where they were stored at 5°C until 1978 and − 18°C thereafter. Rye seeds received at NCGRP in the 1960s and 1970s were dried to water contents between 0.08 and 0.095 g g− 1 and sealed in paper–foil–polyethylene laminate bags that had gussets. Over the years, water content of the seed increased to between 0.11 and 0.13 g g− 1. Germination percentage was assayed every 5–7 years, giving 4–9 germination data points per accession.
Experiment 2
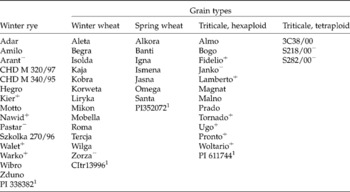
To assess variability of longevity under different storage RH, 50 cultivars of rye, winter wheat, spring wheat and triticale were acquired in 2001 from plant breeding stations in the western and southern parts of Poland (Table 1). Grains were processed within 5 months of harvest and sent to the Polish Academy of Sciences Botanical Garden (PBG), Warsaw, Poland and to NCGRP, Fort Collins, Colorado (USA) where the parallel experiments were conducted. An additional set of four NCGRP accessions that were harvested in 1999 and stored at a constant − 18°C were used as ‘internal standards’ to control for variation in germination conditions (Table 1). Germination percentage was assayed weekly to semi-annually, depending on water content.
Polish cultivars used in longevity experiments conducted at 35°C and four water contents (Experiment 2)

+ and − , Seed lots with initial percentage germination above and below the 95% confidence interval calculated for rye (96–98%), wheat (99–100%) and triticale (95–98%).
1 Control accessions at NCGRP that were stored at − 18°C and used as an internal standard for each germination assay.
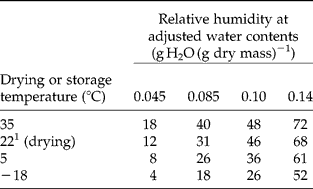
Water content was adjusted by placing seeds at room temperature over saturated solutions of ZnCl2 (6–12% RH), MgCl2 (32–35% RH), Mg(NO3)2 (38–55% RH) and NaCl (70–75% RH) for 1–2 weeks. These procedures gave similar water contents for rye, wheat and triticale within laboratories, but between-laboratory water contents varied using the same methods: 0.066 and 0.046 g g− 1 (ZnCl2), 0.084 and 0.081 g g− 1 (MgCl2), 0.105 and 0.082 g g− 1 Mg(NO3)2, 0.135 and 0.143 g g− 1 (NaCl) for PBG and USA, respectively. Standard error for water content measurements was less than 0.001 for each replicate and treatment. Seeds with water contents adjusted as described were packaged in foil laminate bags and placed at 35°C. Water content, measured when viability was tested, did not change during the storage period (data not shown). Water content is expressed on a dry mass basis, dry mass being measured after a subsample of seeds was heated for 24 h at 130°C (PBG) or 5 d at 95°C (USA). Water contents on a dry mass basis can be converted to fresh mass basis: wcf = wcd/(1+wcd), where wcf and wcd are water contents expressed on a fresh and dry mass basis, respectively, and wcd = (fm − dw)/dw, where fm and dw are fresh and dry mass, respectively. RH values of salt solutions do not reflect storage conditions because seeds were packaged and stored at different temperatures (Walters, Reference Walters2007). The approximate RH at the storage temperature was determined by placing HOBO temperature–RH data loggers (GE Sensing, Inc., Billerica, Massachusetts, USA) in bags with rye seeds adjusted to different water contents (Table 2).
Storage RH of rye seeds adjusted to different water contents, sealed into foil laminate bags and placed at indicated temperatures. RH was measured using data loggers sealed into the bags with the seeds
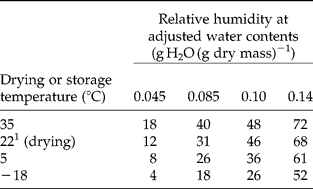
1 Moisture of seeds was adjusted at this temperature.
Both experiments
Seed viability during storage was evaluated from standard germination assays. Seeds were planted in damp paper towel rolls and incubated at either 25/15°C 16/8 h day/night (PBG) or 20°C for 8 d (USA). Percentage germination assays used two replicates of 20 (PBG) or 50 (USA) seeds each. Monitoring tests were most recently performed in November 2007 (Experiment 2) and February 2008 (Experiment 1). Data of storage time and reduced viability for each accession or cultivar were fit to an Avrami equation:
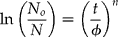
where N o and N are the initial % germination and % germination at storage time t, and Avrami parameters ϕ and n were calculated from the slope and intercept of the linear regression of ln(t) and ln(ln(N o/N)). Initial % germination for each accession or cultivar was calculated from the average of the highest 2–3 or 10 germination percentages of that genetic line in Experiments 1 and 2, respectively. Longevity is expressed as P50, the time required for % germination to decrease to half the initial value. A pooled longevity representing the general behaviour of the species (Walters et al., Reference Walters, Wheeler and Grotenhuis2005a), was calculated by pooling germination data within species or treatment and averaging data within storage time intervals to obtain a series of points (solid symbols in Fig. 1) that were then fitted to an Avrami curve (solid curves in Fig. 1). Ageing rate is expressed as the reciprocal of P50 (P50− 1), and this parameter was used when there was a wide range of P50s within a comparison. Statistical comparisons and analyses of variance and covariance were made using R statistical packages (R Development Core Team, 2007).
Results
Experiment 1
Variability of seed longevity in a genebank is illustrated from data on Secale accessions stored at 5 or − 18°C for nearly 50 years at NCGRP (Fig. 1). Initial germination of S. cereale seeds was higher than those of its wild progenitor S. strictum [95% confidence intervals (CI) for initial germination were 87–92% and 77–85%, respectively]. The pooled P50s for S. cereale and S. strictum were 20,000 and 8500 d (54 and 23 years), respectively, and P50s calculated for individual accessions ranged from 9 to 1709 years for S. cereale seeds (95% CI of mean and median P50 were 36–246 and 39–97 years, respectively) and 10–72 years for S. strictum seeds (95% CI of mean and median P50 were 17–42 and 18–45 years, respectively). Analysis of covariance for the general linear model of the response variable P50− 1 (i.e. ageing rate), and the explanatory factors initial germination percentage, species and harvest year, indicated significant effects of initial germination, harvest year and harvest year × initial germination interactions (P < 0.01), and minor effects of species and species interactions with other factors (P < 0.08). Initial germination percentage was highly influenced by year between 1960 and 1975 (P < 0.002) and less so by species of Secale (P < 0.07). Seeds produced in 1964 and 1970 had above-average initial germination and above-average P50s. Seeds produced in 1965 had below-average initial germination and P50s. However, seeds produced in 1958 and 1961 had average initial germination but lower P50, and seeds produced in 1970 had higher initial germination but average P50.
Experiment 2
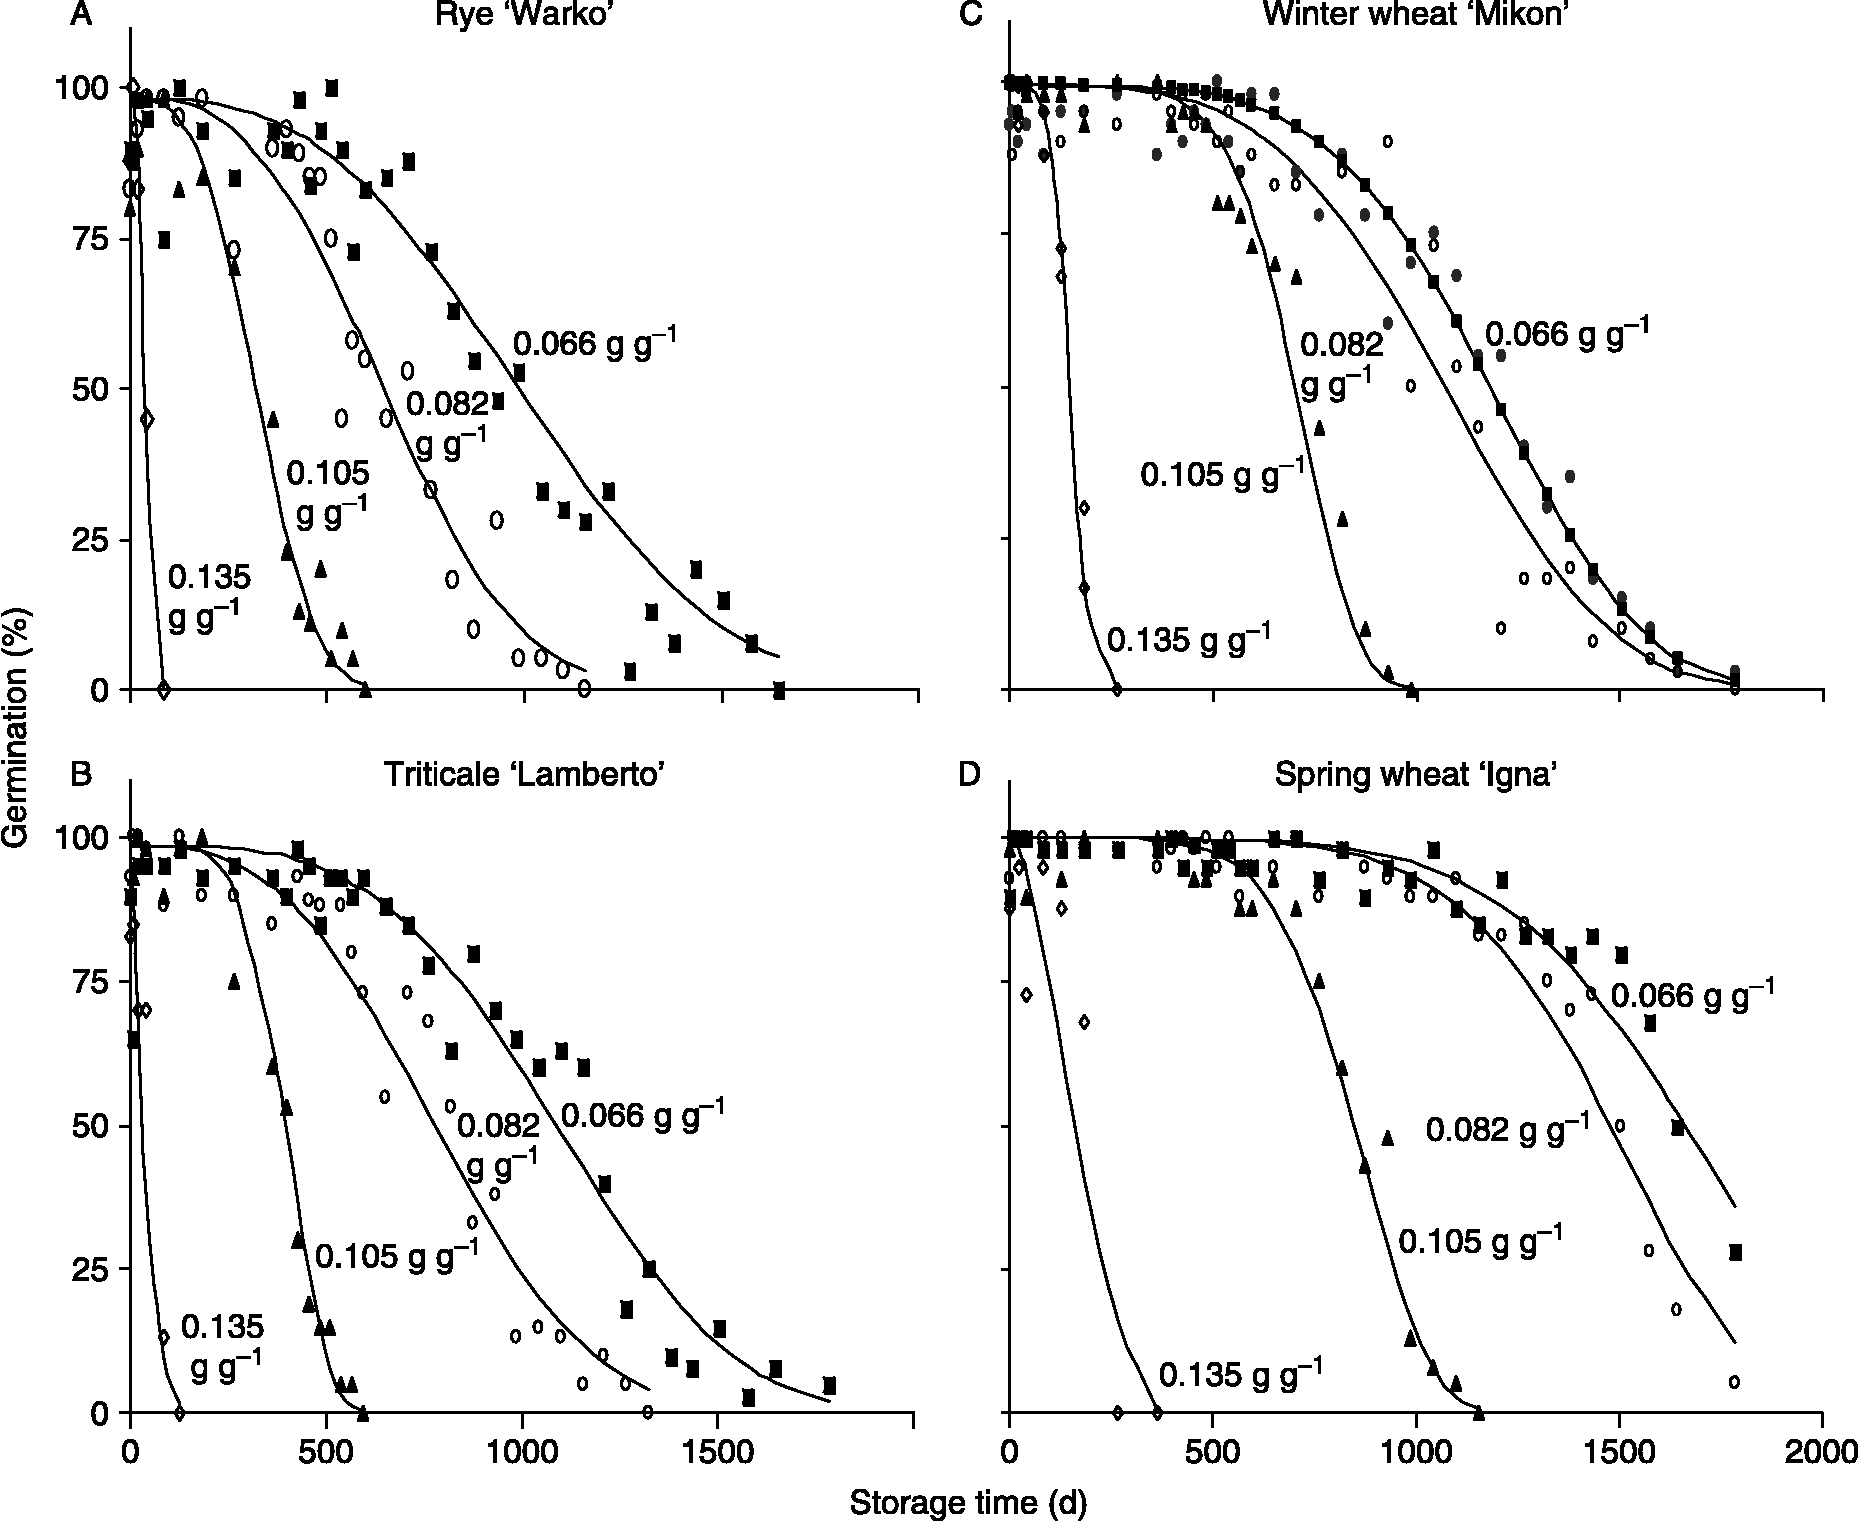
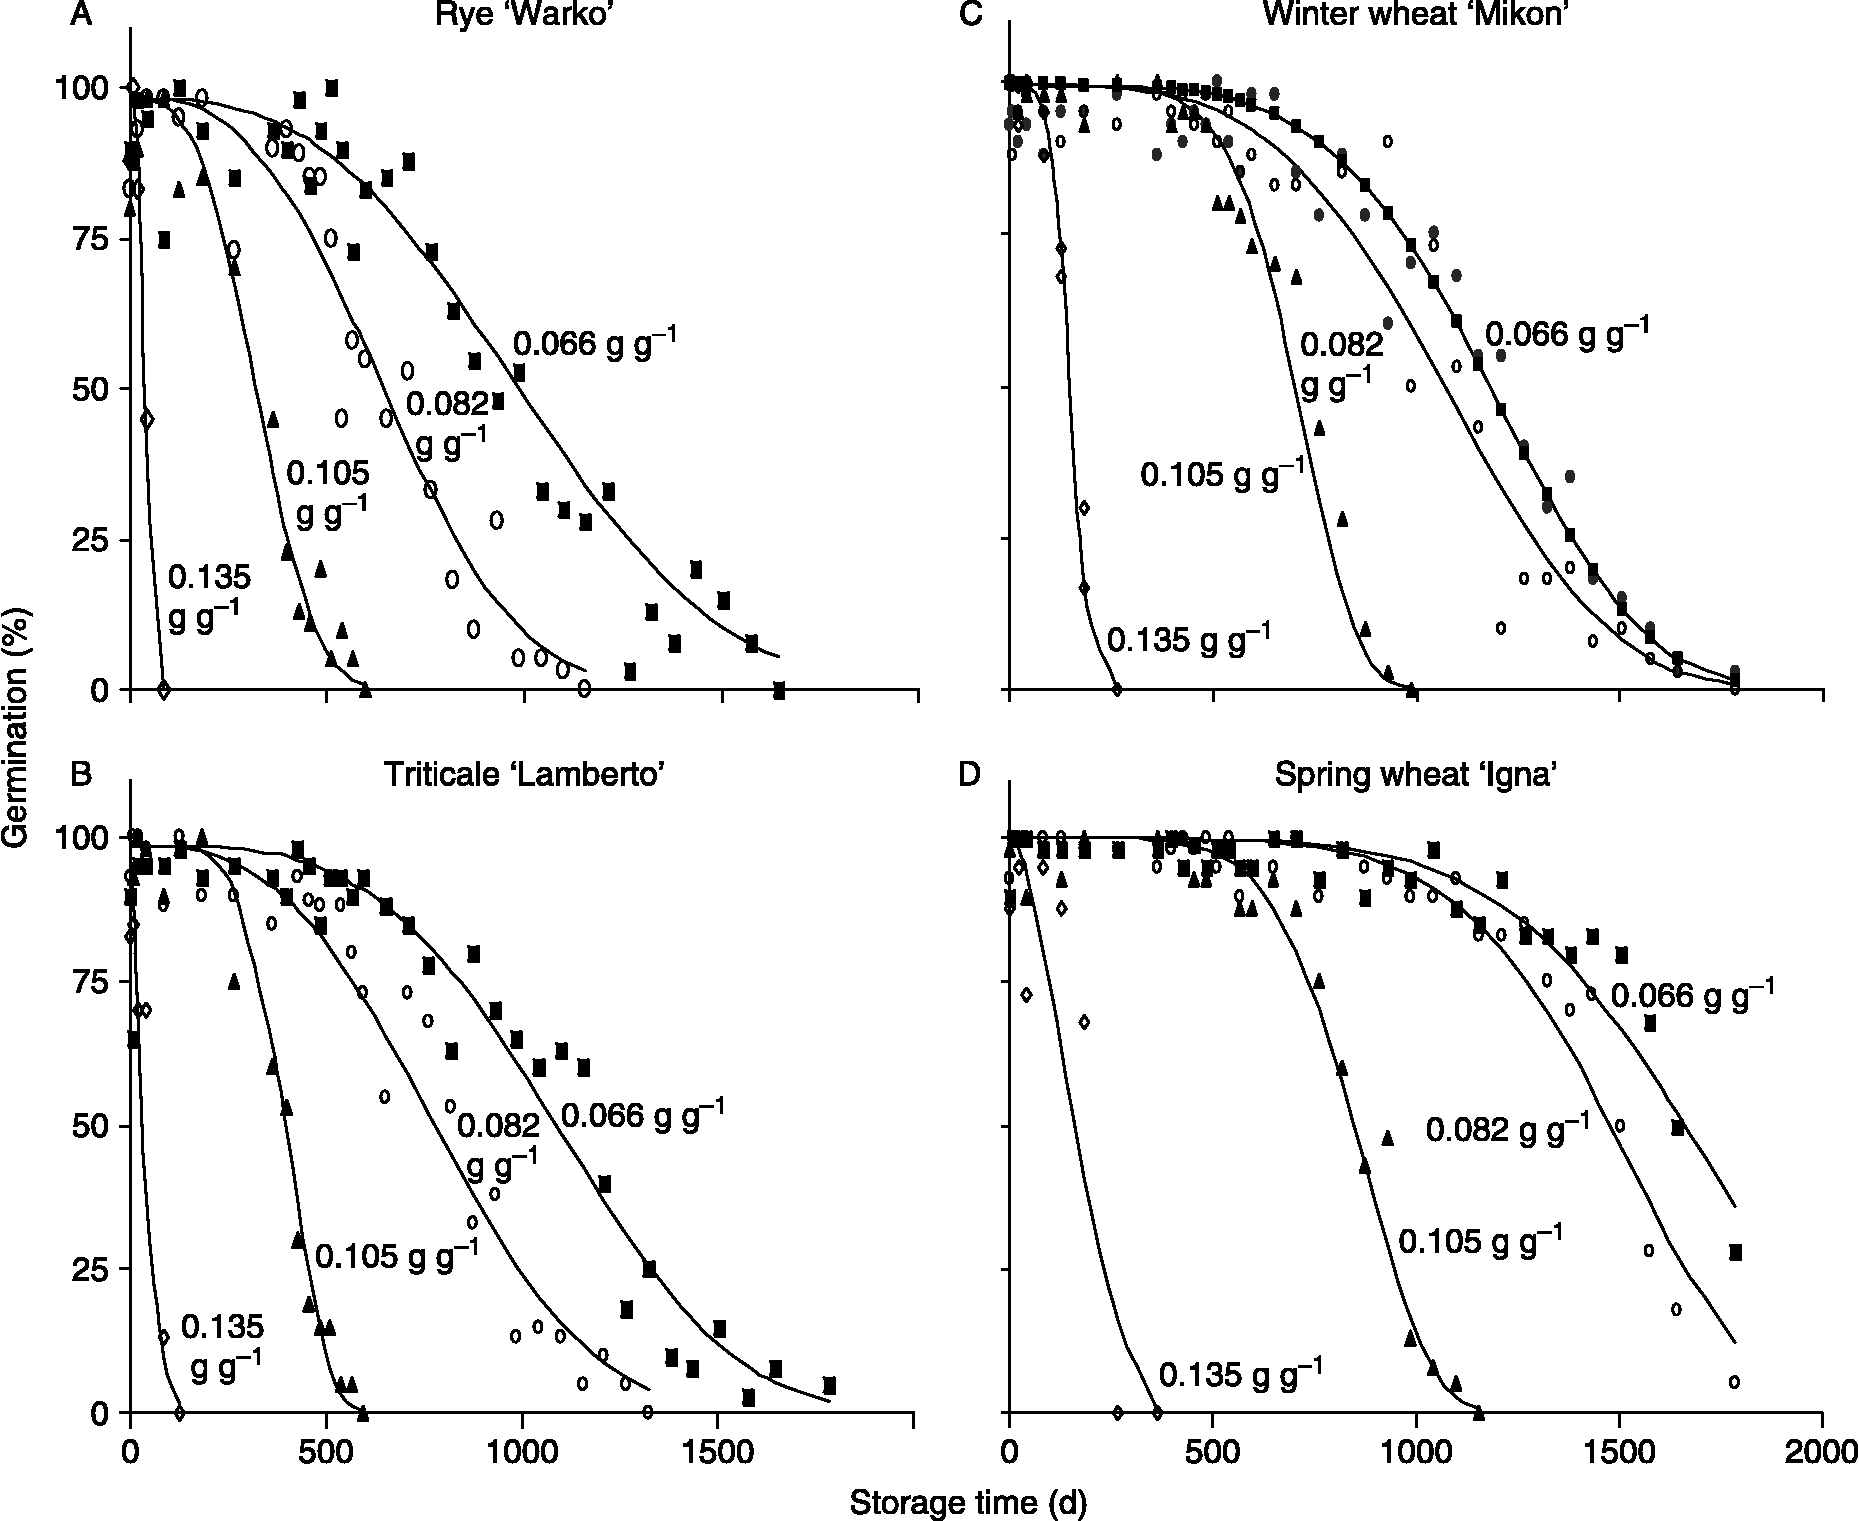
P50 values for Polish cultivars stored at 35°C were about tenfold less than those of NCGRP accessions stored at 5 then − 18°C (compare Fig. 1 and representative time courses given in Fig. 2). Within-species variability in longevity was relatively lower among Polish cultivars (Experiment 2) compared to the diverse germplasm stored at NCGRP (Experiment 1, Fig. 1); probably, cultivated rye grown in a selected region of Poland has a narrower genetic base and more uniform initial quality. Most of the Polish seed lots had high initial germination percentages: 95% CIs for rye, wheat and triticale were 96–98, 99–100 and 95–98%, respectively. Some seed lots had detectably lower initial seed viability: lowest initial germination percentages among rye, wheat and triticale cultivars were 92, 96 and 80%, respectively. When rye, wheat and triticale were considered collectively, grain type and initial % germination were important explanatory factors of the measured variation in longevity (P < 0.01); the importance of grain type is shown by the clustered P50s for wheat (squares) and rye (circles) seeds in Fig. 3. Values of P50 for hexaploid triticale (closed triangles) were distributed along the relationship, while tetraploid triticale (open triangles), which had the lowest initial % germination, tended to have low P50s especially when stored under drier conditions.
Changes in germination of Polish cultivars of rye (A), triticale (B), winter wheat (C) and spring wheat (D) stored at 35°C and water contents [in g H2O (g dw)− 1] as indicated by numerals by the curves (experiment 2). Data are taken from replicate treatments conducted at the Polish Botanical Gardens and are representative of other cultivars within the grain type and replicate treatments conducted at NCGRP. Curves are the least squares fit of data to the Avrami equation and were used to calculate the time to 50% of maximum germination (P50).
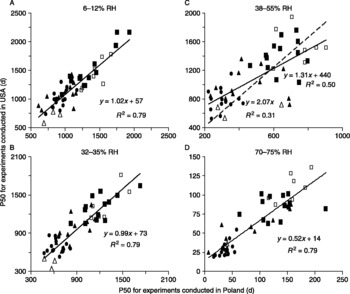
Correlation between seed longevity of 50 cultivars of rye, wheat and triticale measured from replicate storage treatments conducted in Poland (horizontal axis) and USA (vertical axis). Seeds were placed over saturated ZnCl2 (A), MgCl2 (B), Mg(NO3)2 (C) and NaCl (D) solutions for 2 weeks before sealing them in airtight containers and placing them at 35°C. These treatments achieved comparable RH between the two labs (indicated in each figure), except for seeds placed over Mg(NO3)2 (C) which achieved a lower than expected RH of 38% in the USA replicate (vertical axis), presumably because the solution dried out; the replicate treatment from Poland (horizontal) achieved the expected 55% RH. Average water contents for replicate treatments are given in the Methods section. Symbols represent P50 of individual seed lots: rye (closed circles), winter and spring wheat (closed and open squares, respectively) and hexaploid and tetraploid triticale (closed and open triangles, respectively). Solid lines represent the least squares fit to the data and the resulting correlation coefficients are provided in the graph. The dashed line in C represents the best fit correlation through the origin, which was calculated because of the high intercept of the solid line.

Longevity assessments from replicate treatments conducted in Poland and the USA were highly correlated (P < 0.01) (Fig. 3A–D). Despite the significance of the correlations, regression coefficients (R 2) did not exceed 0.8 for any replicated treatment, suggesting that about 20% of the total variation should be attributed to experimental uncertainty, perhaps arising from variation among germination assessments or error in curve-fitting the Avrami kinetic model. In the driest treatments (Fig. 3A, B), regression slopes were close to one, suggesting that water adjustments were precise enough within each treatment to avoid a water content effect. In the wettest treatment (Fig. 3D), the regression slope was about 0.5, likely reflecting a near doubling of ageing rate for the almost 0.01 g g− 1 difference in water content achieved by the two laboratories when seeds were placed over saturated NaCl solutions. The twofold effect is consistent with Harrington's Thumb Rules describing the effect of seed water content on longevity (Justice and Bass, Reference Justice and Bass1978). Ageing rate was also about twofold different among replicates in the intermediate moisture treatment, despite a 0.02 g g− 1 difference in water content (Fig. 3C). Moreover, the R 2 comparing replicates within this treatment was much lower than comparisons made for the other treatments, and suggests a discontinuity in the effect of water between 0.085 and 0.105 g g− 1 (38 and 55% RH).
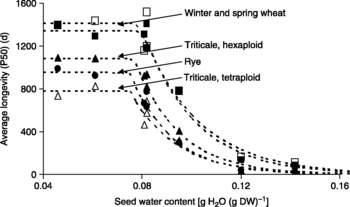
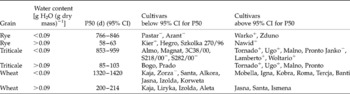
The pattern by which water content affected seed longevity was revealed by expressing longevity averaged for each treatment as a function of water content (Fig. 4). P50 increased exponentially as water content decreased to below 0.08–0.09 g g− 1 or 35–45% RH (Table 2), consistent with well-established models (Justice and Bass, Reference Justice and Bass1978; Ellis, Reference Ellis1991). However, P50 did not change substantially as water contents decreased to less than 0.08 g g− 1 (horizontal line in Fig. 4), consistent with reports of limited benefit of drying below a critical water content (Walters, Reference Walters1998; Walters et al., Reference Walters, Hill and Wheeler2005b; Ellis and Hong, Reference Ellis and Hong2007). At both high and low moisture conditions, rye seeds generally aged faster than triticale seeds, which generally aged faster than wheat seeds. The 95% CIs for P50s calculated for cultivars of rye, triticale and wheat stored at water contents >0.09 g g− 1 were 58–63, 85–103 and 200–214 d, respectively (Table 3). Drying increased survival times seven- to tenfold, and 95% CIs for P50s were 766–846, 853–959 and 1320–1420 d for rye, triticale and wheat cultivars, respectively, stored at water contents < 0.09 g g− 1 (Table 3). Despite similar ranking of longevity among species (i.e. rye < triticale < wheat), significant interacting effects of water content and grain type were detected in analysis of covariance, using a general linear model with P50 or P50− 1 as the response variable (P < 0.01). Similar analyses conducted separately for rye, wheat and triticale revealed no other explanatory factors except water content when analyses used the entire water content range.
Longevity of rye, wheat and triticale grains from Polish cultivars in relation to the water content during storage at 35°C. Longevity is expressed as P50, which was calculated from time-course data similar to those given in Fig. 2. Symbols represent P50 averaged among cultivars from each grain type within each replicate treatment: rye (closed circles), winter and spring wheats (closed and open squares, respectively) and hexaploid and tetraploid triticale (closed and open triangles, respectively). Curves are the fitted relationship between P50 = Aexpb·wc, where A and b were determined by regression of the semilog plot for water contents >0.08 g g− 1. Regression coefficients for this relationship exceeded 0.92 for all grain types. Positions of horizontal lines were determined from the average P50 obtained for the lowest two or three water contents. The horizontal lines indicate a limit to the beneficial effect of drying on seed longevity. The point of intersection of the horizontal and exponential curves illustrates the existence of a ‘critical’ water content, but there were insufficient moisture treatments in these experiments to determine this water content accurately.

Cultivars identified to have significant effects (P<0.05) by ANOVA calculated for dry and humid conditions

+ and − , Seed lots with initial germination percentages higher or lower than the 95% CI for the grain type (as described in Table 1).
Significant effects of cultivar, initial germination and factor interactions (P < 0.05) were detected in within-grain comparisons when analyses considered dry (water content less than 0.09 g g− 1) and humid (water content greater than 0.09 g g− 1) conditions separately. Initial germination was a significant explanatory factor of P50 under dry, but not humid, conditions. Cultivar was a significant explanatory factor in all regressions, but water content × cultivar interactions were significant only under humid conditions (P < 0.05). Cultivars that performed poorly (P50 < 95% CI) under humid conditions were not the same as those that performed poorly under dry conditions (Table 3). Well-performing cultivars of wheat and rye were also different under dry and humid conditions (Table 3). However, several cultivars of triticale performed well under both humid and dry conditions, and these cultivars tended to have higher than average initial % germination. Spring wheat cultivars tended to have higher than average P50s under humid conditions and tetraploid triticale cultivars tended to have lower than average P50s under dry conditions (also observable in Figs 3D and 3A, respectively).
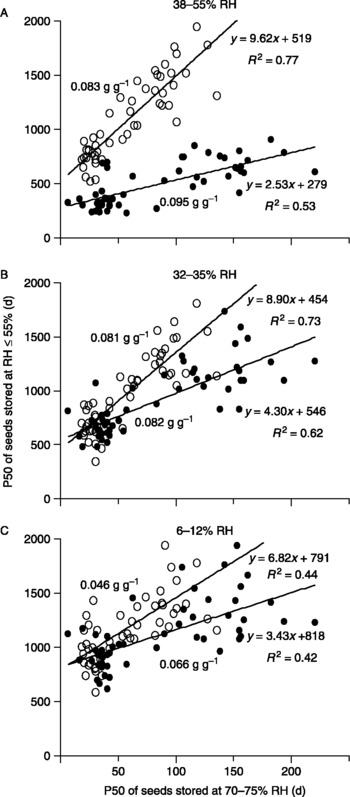
To further illustrate the interacting effects of water content and cultivar, P50s obtained from seeds stored at the highest water content (seeds placed over a saturated NaCl solution giving an approximate RH of 70–75%) were regressed with P50s obtained from seeds at increasingly lower water contents (Fig. 5). Unlike between-lab comparisons of seeds at comparable water contents, which gave predictable slopes and R 2 close to 0.8 (Figs 3A, B, D), slopes and R 2 decreased in within-lab comparisons between moist and progressively drier seeds (Fig. 5) and resembled the between-lab comparison of seeds at an intermediate water content (Fig. 3C). Correlations of within-lab comparisons of humid versus drier grains remained significant (P < 0.03) when all grain types were considered, attesting to the inherently longer survival times of wheat compared to rye, regardless of water content (Figs 3 and 4, Table 3). When analyses considered each grain type separately, seed longevity for cultivars stored under humid versus drier conditions were not correlated (P≫0.1, R 2 < 0.2), suggesting that high humidity tests cannot be used to infer within-species longevity for seeds stored at moderate and low RH.
Correlations between longevity of seeds stored at high RH (70 and 75% for labs in Poland and USA, respectively) (horizontal axis) and lower RH: 38–55% RH (A), 32–35% RH (B) and 6–12% RH (C). Each point represents a P50 value for one of 50 Polish cultivars (Table 1), P50 being calculated as described in Fig. 2. Separate regressions are calculated for experiments conducted in labs in Poland (closed circles) and the USA (open circles), and regression coefficients are given next to each line. Seed water contents for the 70 and 75% RH treatments achieved in Poland and US labs, respectively, averaged 0.135 and 0.143 g H2O (g dw)− 1, respectively. Average seed water contents associated with storage at lower RH are indicated in the graphs. Correlations calculated using all 50 cultivars of rye, wheat and triticale were significant at P < 0.05; however, correlations in which grain types were considered separately were not significant (data not shown).

Discussion
Differences in seed longevity among species are well established and have been documented quantitatively and semi-quantitatively under soil, uncontrolled warehouse (also called ‘open’) and genebank conditions [Toole and Brown, Reference Toole and Brown1946; Justice and Bass, Reference Justice and Bass1978; Priestley et al., Reference Priestley, Cullinan and Wolfe1985; Walters et al., Reference Walters, Wheeler and Grotenhuis2005a (and references therein)]. Results in this paper are consistent with earlier findings of a longer shelf-life in wheat compared to rye grains. The greater longevity of wheat seeds compared to rye provides a useful tool to examine closely related taxa that differ in seed storage behaviour.
Wild rye (S. strictum) grains aged somewhat more rapidly than rye (S. cereale) grains under genebanking conditions (Fig. 1) and this trend was repeated in regenerated accessions (data not shown). Initial germination percentage, indicative of initial grain quality, accounts for some of the differences in longevity and exemplifies some well-known problems of regenerating wild populations: grains may have lower quality compared to improved cultivars, or ex situ growth conditions and harvest practices may not optimize quality in highly heterogeneous samples. Greater grain longevity in cultivated accessions may arise during domestication by direct selection of grains that survived until the next growing season or indirect selection of pleiotropic traits such as fecundity, uniform maturity or maternal robustness (Black, Reference Black, Black, Bewley and Halmer2006). Differences between grain longevities in domesticated crops and wild congeners have been reported for diverse taxa (Rao and Jackson, Reference Rao and Jackson1997; Walters et al., Reference Walters, Wheeler and Grotenhuis2005a; Ellis and Hong, Reference Ellis and Hong2007; Pérez-García et al., Reference Pérez-García, González-Benito and Gómez-Campo2007), although there appears to be no consistent trend.
Here, we report the novel observation that shelf-life of triticale grains is intermediate between rye and wheat (Fig. 3). The three tetraploid triticale cultivars aged faster than the 12 hexaploid triticale cultivars (95% CIs for P50s under dry conditions were 543–715 and 920–1030 d, and under humid conditions 21–216 and 122–267 d, for tetraploid and hexaploid triticale, respectively). The lower initial quality of tetraploid compared to hexaploid triticale accounts for some of the differences in P50 (95% CIs for initial germination percentages were 84–96% and 97–99% for tetraploid and hexaploid triticale, respectively). The proportionally greater contribution of the rye genome in tetraploid compared to hexaploid triticale may also have contributed to the differences of P50 within triticale.
Seed longevity is inextricably linked to seed water content (Justice and Bass, Reference Justice and Bass1978; Ellis, Reference Ellis1991; Walters, Reference Walters1998). The familiar exponential increase in longevity with decreasing water content was found for all grain types until seeds were dried to between 0.085 and 0.095 g g− 1 and little effect of water on seed ageing rate was observed in seeds stored below 0.08 g g− 1 (Fig. 4) [water was not an explanatory factor (P < 0.1)]. Our data are consistent with concepts of critical water contents for seed ageing rates (Ellis et al., Reference Ellis, Hong, Roberts and Tao1990; Vertucci and Roos, Reference Vertucci and Roos1990, Reference Vertucci and Roos1993; Walters, Reference Walters1998). The critical water contents we report here for storage at 35°C were near 0.09 g g− 1 (~ 40% RH), which are comparable to values previously reported for wheat at uncontrolled temperatures (Chai et al., Reference Chai, Ma, Li and Du1998) and higher than 0.054 g g− 1 reported for wheat stored at 65°C (Ellis et al., Reference Ellis, Hong, Roberts and Tao1990). As critical water contents decrease with storage temperature (Walters, Reference Walters1998; Ellis and Hong, Reference Ellis and Hong2006) according to water content–RH–temperature relationships described in water sorption isotherms (Vertucci and Roos, Reference Vertucci and Roos1993), critical RH for the 35 and 65°C studies may be comparable, and isotherms constructed at 65°C are needed to verify this point.
A critical water content or RH is an expression of a discontinuity in the way water regulates ageing reactions. Water regulation of deteriorative reactions in solid–fluid structures such as seeds, foods and pharmaceuticals has been described in detail (Walters, Reference Walters1998; Buitink and Leprince, Reference Buitink and Leprince2004; Walters and Koster, Reference Walters, Koster, Jenks and Wood2007). Briefly, a discontinuous relationship is indicative of a shift in the contribution of various reactions involved in ageing, a change in structure of a catalyst or substrate, or a change in molecular mobility (Walters, Reference Walters1998; Walters et al., Reference Walters, Hill and Wheeler2005b; Walters and Koster, Reference Walters, Koster, Jenks and Wood2007). The mode by which water regulates ageing reactions is highly dependent on cell composition and structure. Moreover, diverse cellular constituents interact with water in different ways. Hence, we should expect different responses to water among grain types and seed lots, depending on the features of the grain that confer seed quality.
Seed quality, as it relates to seed longevity, is acquired during the latter stages of embryogenesis and is modified by growth and post-harvest conditions. Factors deemed important to desiccation tolerance are also suggested to play a role in seed longevity. Hence dry matter reserves (e.g. Bentsink et al., Reference Bentsink, Alonso-Blanco, Vreugdenhil, Tesnier, Groot and Koornneef2000; Hoekstra, Reference Hoekstra2005; Walters et al., Reference Walters, Wheeler and Grotenhuis2005a; Walters and Koster, Reference Walters, Koster, Jenks and Wood2007), antioxidant levels (Sattler et al., Reference Sattler, Gilliland, Magallanes-Lundback, Pollard and DellaPenna2004; Kranner et al., Reference Kranner, Birtić, Anderson and Pritchard2006), glass transition temperature (Buitink and Leprince, Reference Buitink and Leprince2004), tolerance to abiotic stress or geographic origin (Rao and Jackson, Reference Rao and Jackson1997; Bentsink et al., Reference Bentsink, Alonso-Blanco, Vreugdenhil, Tesnier, Groot and Koornneef2000; Dussert et al., Reference Dussert, Chabrillange, Engelmann, Anthony, Louarn and Hamon2000; Clerkx et al., Reference Clerkx, El-Lithy, Vierling, Ruys, Blankestijn-DeVries, Groot, Vreugdenhil and Koornneef2004; Walters et al., Reference Walters, Wheeler and Grotenhuis2005a; Daws et al., Reference Daws, Cleland, Chmielarz, Gorian, Leprince, Mullins, Thanos, Vandvik and Pritchard2006; Eira et al., Reference Eira, DaSilva, DeCastro, Dussert, Walters, Bewley and Hilhorst2006), and expression of enzymes or stress proteins (Gurusinghe and Bradford, Reference Gurusinghe and Bradford2002; Gurusinghe et al., Reference Gurusinghe, Powell and Bradford2002; Illing et al., Reference Illing, Denby, Collett, Shen and Farrant2005; Prieto-Dapena et al., Reference Prieto-Dapena, Castaňo, Almoguera and Jordano2006; Boudet et al., Reference Boudet, Buitink, Hoekstra, Rogniaux, Larré, Satour and Leprince2006; Rosnoblet et al., Reference Rosnoblet, Aubry, Leprince, Vu, Rogniaux and Buitink2007) are hypothesized to be important. Several molecular constituents, such as sugars and late embryogenesis abundant (LEA)-like proteins, have suggested roles for modifying water effects (e.g. Berjak et al., Reference Berjak2006; Walters and Koster, Reference Walters, Koster, Jenks and Wood2007), and it is likely that these molecules behave differently at different RHs.
The interacting effects of water, molecular constituents and structure and seed quality lead to the hypothesis that water content and seed lot interact in the expression of seed longevity. This hypothesis runs counter to the widely held assumption of a uniform response of water content within species (Ellis, Reference Ellis1991; Jianhua and McDonald, Reference Jianhua and McDonald1997; Tesnier et al., Reference Tesnier, Strookman-Donkers, vanPijlen, van der Geest, Bino and Groot2002; Hay et al., Reference Hay, Mead, Manger and Wilson2003). Testing the hypothesis (and the assumption) requires an experimental design as we have presented in this paper: numerous seed lots within a species that vary in longevity and replicate treatments at high and low RH for each seed lot. Highly replicated experimental designs are also needed when storing seeds at RH>80% because water content is difficult to control precisely and accurately (see water sorption isotherms as described in Walters, Reference Walters1998), and small differences in water content have large effects on deterioration rate (Fig. 4). Because experiments comparing ageing rates under dry and humid conditions are labour intensive, require years to complete for dry storage treatments and consume thousands of seeds, datasets as presented here are rare, and we do not know if comparable datasets exist. We demonstrate significant cultivar × water content interactions (P < 0.1) (Table 3) and no correlation between seed longevity measured during humid and dry storage in within-grain comparisons of rye, wheat or triticale (Fig. 3C, Fig. 5A–C). Hence, we conclude that high humidity tests do not predict seed longevity under dry storage for the small grain types studied in this paper.
These results provide important evidence confirming concerns about the validity of using AA/CD tests alone to indicate the longevity phenotype. Faster measurements are certainly an advantage of AA/CD tests, which reduce the time for seeds to die from years or decades (Figs 1 and 2) to days or months. However, this advantage should be balanced with the poor predictive power of these tests and their inherently high experimental uncertainty. Moreover, this study suggests that species-dependent constants for the commonly used viability equations (Ellis, Reference Ellis1991) are actually averages with associated variability within a species. Variation around an average moisture coefficient would account for the interacting effects of water content, seed lot and seed longevity reported here. These interacting effects also explain why initial germination and vigour are unreliable predictors of longevity during dry storage. Alternative methods of assaying seed longevity are needed to discover the nature and role of traits that confer seed longevity, and the genetic and environmental factors that influence the expression of these novel traits.
In conclusion, we have demonstrated variation of longevity among genetic lines of rye, wheat and triticale that cannot be attributed entirely to initial seed quality, but can be partially explained by differences in seed response to changing water contents. These observations lead us to conclude that seed longevity may be regulated by different factors at high and low RH. Thus, storage behaviour at high RH (e.g. ‘accelerated ageing’ conditions) does not reliably predict seed longevity under warehouse or seed-banking conditions. Identifying genetic lines that perform well or poorly under dry and humid conditions may help to discover gene products that regulate seed responses to humidity and will facilitate the understanding of genetic, growth and postharvest treatments that contribute to seed longevity.