Introduction
The visual system of birds includes a substantial projection from the brain to the retina. The major part of this efferent input, also known as a centrifugal or retinopetal input, originates from the contralateral isthmo-optic nucleus (ION), a visual nucleus found at the dorsal surface of the midbrain. The function of this centrifugal visual system (CVS) is unknown, but a number of anatomical and physiological results imply that it works rapidly to enhance local retinal responses (Holden & Powell, Reference Holden and Powell1972; Li et al., Reference Li, Xiao, Fu and Wang1998; Uchiyama et al., Reference Uchiyama, Nakamura and Imazono1998). Although there have been numerous anatomical studies of the efferent system within the retina since its original description in the late 19th century, several questions pertinent to its function presently have no clear answer. In this study, we reexamine, in detail, the anatomy of efferent input to a bird retina.
In ground-feeding birds, where the ION is most prominent, approximately 8500 myelinated efferent fibers, so-called restricted efferent fibers (rEFs) (Ramón y Cajal, Reference Ramón y Cajal1889; Fritzsch et al., Reference Fritzsch, Crapon de Caprona and Clarke1990; Nickla et al., Reference Nickla, Gottlieb, Marin, Rojas, Britto and Wallman1994), run to each retina (Cowan & Powell, Reference Cowan and Powell1962). In the chicken retina (Catsicas et al., Reference Catsicas, Thanos and Clarke1987b; Fritzsch et al., Reference Fritzsch, Crapon de Caprona and Clarke1990; Cellerino et al., Reference Cellerino, Novelli and Galli-Resta2000), and that of the quail (Uchiyama & Stell, Reference Uchiyama and Stell2005), efferent input is reported to be concentrated in the inferior retina, but only in the pigeon is a density map available (Hayes & Holden, Reference Hayes and Holden1983). Even in this species, however, it is unclear how strict is the exclusion from the dorsal retina since sampled densities of less than 50/mm2 were scored as 0. By mapping the position of every rEF terminal, we show here that this rule is very strict, unexpectedly so in view of the prevailing notion that the retinal position of efferent terminals is immaterial to their function (Uchiyama & Stell, Reference Uchiyama and Stell2005).
Within the retina, of Galliform birds at least, every rEF is thought to make synaptic contact with a single amacrine cell (Uchiyama & Ito, Reference Uchiyama and Ito1993; Uchiyama et al., Reference Uchiyama, Ito and Tauchi1995). Both the synapse and the amacrine cell are unusual. The amacrine cell, often called the efferent target cell or simply target cell (TC), has a large prolate soma located in the inner and middle regions of the inner nuclear layer (INL). The basal portion of the soma gives rise to a few rudimentary (<5 μm length) dendrites and one axon that runs for 0.5–6 mm along the border of the INL and inner plexiform layer (IPL) before terminating in stratum 1 of the IPL (Ramón y Cajal, Reference Ramón y Cajal1995; Uchiyama et al., Reference Uchiyama, Aoki, Yonezawa, Arimura and Ohno2004). The absence of proper dendrites and the presence of an axon have prompted the suggestion that these cells should not be classified as amacrine cells but rather should have their own class (Uchiyama & Stell, Reference Uchiyama and Stell2005).
The synapse between rEFs and TCs is typically a large and complex structure in which an efferent terminal apparently surrounds the basal portion of the TC, in what Ramón y Cajal (Reference Ramón y Cajal1889) termed a “pericellular nest” and what has elsewhere been called a calyx-like synapse (Uchiyama & Stell, Reference Uchiyama and Stell2005). The two ultrastructural studies of this synapse both show numerous synaptic vesicles and many mitochondria in efferent terminals (Dowling & Cowan, Reference Dowling and Cowan1966; Uchiyama & Ito, Reference Uchiyama and Ito1993) but differ in some important regards. In particular, the more extensive study in the pigeon suggests that the pericellular nest around a TC is comparatively rare, and the majority of efferent synapses are small basal contacts with “ordinary” amacrine cells (Dowling & Cowan, Reference Dowling and Cowan1966). Because it bears on the possible function of the efferent system, an important but unresolved question is whether TCs are driven exclusively by their efferent input or whether a retinal input might also be present. In this study, we use several anatomical methods to clarify the structure of both the pre- and the postsynaptic elements at this synapse in the chicken retina. We show that although TCs have only the shortest of dendrites, these receive input from other neurons in addition to rEFs in a “private” neuropil within the INL. In addition to the major synapse every rEF makes with a TC, there are two other types of synapses formed by rEFs, one of which appears to be quite novel.
Materials and methods
A total of 105 young white leghorn chickens (Gallus gallus) were used in this study. Of these, 57 were hatched from eggs obtained from the Avian Sciences Facility of the University of California, Davis, and used in surgeries to label the efferent fibers as described below. The experimental procedures were approved by the Institutional Animal Care and Use Committee at the University of California, Davis. The NADPH-diaphorase histochemistry portion of this study used forty-eight 3-week-old chickens from the University of Queensland Central Animal House. The handling of these chickens was in accord with the Australian code of practice for the care and use of animals for scientific purposes.
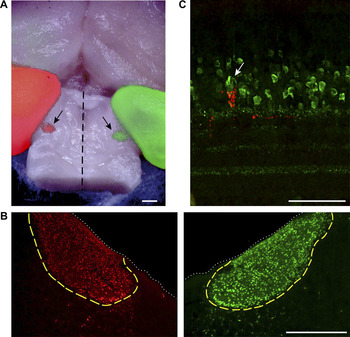
Prior to surgeries intended to label efferent fibers, a set of preliminary experiments was performed to determine the typical position of the left ION relative to the major cranial sutures. The location of the ION was revealed with retrograde labeling with Alexa 488- or 555–conjugated cholera toxin subunit B (C-22841 and C-22842; Invitrogen, Carlsbad, CA) injected into each eye, red in the right eye and green in the left (Fig. 1A and 1B). The position of the ION relative to the intersections of the major cranial sutures was then measured in three preserved chicken heads mounted in a custom stereotaxic frame.
Labeling of efferent fibers. (A) Dorsal surface of a chicken brain with fluorescent staining resulting from the injection of red and green Alexa-conjugated cholera toxin subunit B (CTB) into the right and left eyes, respectively. The cerebral hemispheres are visible in the upper half of the image, and the midbrain has been exposed by removing the cerebellum. The left (red) and right (green) optic tecta are visible on the left and right margins of the image. Between the two tecta, on the dorsal surface of the midbrain are two ovoid structures measuring approximately 1 mm across (arrows). These are the left (red) and right (green) IONs, located roughly 2 mm from the midline (dashed line). Anterior is up. Scale bar is 1 mm. (B) Transverse sections of the brain shown in (A), cut through the midbrain showing left and right IONs. The dotted white line delineates the dorsal surface of the midbrain, and the boundaries of the IONs are traced in yellow. The few CTB-labeled neurons seen outside this boundary are the “ectopic neurons” that give rise to the widespread efferent fibers (wEFs). Dorsal is up. Scale bar is 500 μm. (C) Transverse section of the retina showing Fluoro-Ruby labeling of a rEF terminal (red). Multiple cells in the amacrine cell layer are parvalbumin+ (green), but the TC around which the efferent terminal forms can be distinguished by its larger size and prolate soma (arrow). Scale bar is 50 μm.

Labeling of efferent fibers
Two-week-old chickens were anesthetized with 1–3% isoflurane and mounted in the stereotaxic frame such that the dorsal surface of the skull was roughly horizontal. A sharp Hamilton syringe was then advanced, through a small hole drilled in the skull, to the estimated coordinates of the ION. 0.5 μl of the anatomical tracer, 15% Fluoro-Ruby (D1817; Invitrogen), or 10% Fluoro-Ruby with 10% Alexa 568–conjugated dextran (D22912; Invitrogen), in sterile saline, was injected over a 1-min period. The syringe was left in place for a minimum of 2 min before being removed. After sealing the skull with bone wax and closing the incision with sutures, the chicken was removed from anesthesia.
Tissue preparation for fluorescence immunohistochemistry
Following a minimum survival period of 3 days, the chicken was euthanized with a lethal dose of pentobarbital (Beuthanasia-D, 047305; Webster Veterinary, Sterling, MA). Once the animal was deeply anesthetized, as assessed by a lack of the toe pinch reflex, it was transcardially perfused with phosphate-buffered saline (PBS; Sigma, St. Louis, MO), followed by 4% paraformaldehyde (PFA; Sigma) in PBS. The right eye was removed and hemisected just posterior to the ora serrata. The posterior eyecup was postfixed in chilled 4% PFA for 1–2 h. The brain was removed and postfixed overnight in chilled 4% PFA.
The day after perfusion, the brain was rinsed with PBS, embedded in 5% agar (A9915; Sigma), and sectioned at 50 μm thickness on a Vibratome. Transverse sections cut through the region of the midbrain containing the ION were transferred to slides, counterstained with SYBR green (S7564; Invitrogen), and coverslipped with VectaShield hard-set mounting medium (H1400; Vector Labs, Burlingame, CA). All sections containing portions of the ION were imaged to determine the extent to which the isthmo-optic (IO) neurons had taken up the tracer.
To prepare flat mounts, the eyecup was rinsed with PBS and cut in half with a single dorsal–ventral cut just temporal to the pecten. The pecten was carefully excised to assure minimum loss of retina. The retina was removed from the sclera and pigment epithelium before being processed using standard immunohistochemistry techniques. The retinas used for the flat-mount studies, in which we mapped the distribution of rEF terminals, came only from animals in which all the IO neurons had taken up tracer as verified by inspecting sections drawn from the entire extent of the ION.
To prepare radial sections of the retina, the eyecup was rinsed with PBS and two 5 × 5–mm squares, corresponding to the regions of the retina where efferent fibers are found in highest density, were cut out from either side of the pecten. These retinal squares were separated from the sclera and placed in 30% sucrose solution at 4°C until equilibrated (typically overnight). The following day, they were embedded in OCT medium (27050; Ted Pella, Redding, CA), frozen on dry ice, and stored at −20°C until sectioning. Sections of 12–20 μm were cut on a cryostat (Leica Microsystems Inc, Bannockburn, IL), mounted on gelatin-coated slides, and stored at −20°C.
Fluorescence immunohistochemistry
To identify TCs, we used the same anti-parvalbumin antibody used by Fischer and Stell (Reference Fischer and Stell1999) for this purpose (Fig. 1C). For flat mounts labeled with both Fluoro-Ruby and anti-parvalbumin, a blocking solution containing 10% normal goat serum, 1% bovine serum albumin, and 0.1% Tween-20 in PBS was applied for 1 h at room temperature. Retinas were incubated in mouse anti-parvalbumin (P3088; Sigma) diluted 1:1000 in blocking solution for 7 days at 4°C, washed 3 times in PBS (40, 20, and 20 min), and then incubated for 1–5 days at 4°C in secondary antibodies (Alexa 568–conjugated goat anti-mouse; Invitrogen) diluted 1:500 in PBS. Finally, the flat mounts were washed with PBS and coverslipped using VectaShield hard-set mounting medium (H1400; Vector Labs). The following day, the slides were sealed using DPX (NC 9753710; Fischer, Pittsburghs, PA).
Retinal sections were processed for immunohistochemistry using techniques similar to those described for flat mounts, except that sections were quenched with 1% glycine in 0.3% Triton–PBS for 15 min prior to blocking solution, and the incubation times for primary and secondary antibodies were reduced to overnight and 1–2 h, respectively.
Stained sections and flat mounts were examined using an inverted confocal microscope (Olympus America Inc, Center Valley, PA) employing krypton (488 nm) and argon (568 nm) lasers. Images were converted to 24-bit TIF images in Fluoview software and then transferred to Adobe Photoshop for adjustment of brightness, contrast, and sharpness. Images of antibody-labeled tissue were always processed identically to those of the corresponding secondary-only control. These are not shown because they were uniformly black.
Construction of rEF density maps
Confocal images were acquired for the entire extent of two retinal flat mounts (roughly 200 images per retina). Compressed z-stacks of the INL–IPL border were montaged in Adobe Photoshop and loaded into Neurolucida to allow mapping of the locations of every Fluoro-Ruby-labeled rEF. Neurolucida maps representing every rEF terminal as a point were then converted to density maps by convolution with a two-dimensional Gaussian function implemented in MathCad.
Filling TCs with Lucifer yellow
Some TCs, identified as such by the presynaptic labeling of a rEF with Fluoro-Ruby, were injected with Lucifer yellow in flat-mount retinas lightly fixed in 4% PFA in PBS for 20 min on ice. For these experiments, both nasal and temporal pieces of retina were attached to black Millipore paper (Millipore AABG02500; Millipore, Bedford, MA) prior to fixation. The tips of injection micropipettes were filled with 2% Lucifer yellow (Sigma) in 0.1 M Tris buffer, pH 8.2. Lucifer yellow was iontophoresed with −1 nA current for 60 s, and cells were then left to equilibrate for 30 min in Ames medium (Sigma) containing 1.9 g/l of NaHCO3 (pH 7.4 at room temperature) and adjusted to 320 mOsmol with NaCl before a second fixation in 4% PFA in 0.1 M PBS for 30 min. Following an overnight wash in PBS with 0.2% Triton, retinas were blocked with 3% donkey serum in PBS for 1 day and incubated in anti–Lucifer yellow antibody (polyclonal rabbit anti–Lucifer yellow, A-5750; Invitrogen) diluted 1:10,000 in 1% donkey serum in PBS for approximately 5 days. Retinas were washed in PBS with 0.2% Triton overnight and then incubated in secondary antibody [Cy2-conjugated AffiniPure donkey anti-rabbit IgG (H+L), 711-225-152; Jackson Immunoresearch, West Grove, PA] diluted 1:200 in 1% donkey serum in PBS for approximately 24 h. Retinas were washed overnight in 0.1 M PBS and then subsequently mounted in Prolong Gold antifade solution (P36934; Invitrogen).
Tissue preparation for NADPH-diaphorase histochemistry
Retina from the nasal and temporal halves of the eyecup was gently removed from the pigment epithelium and mounted photoreceptor side down on black Millipore paper. Retinal halves were maintained in carbogenated Ames medium until processing. A two-step procedure was used in which NADPH was synthesized in situ by reduction of NADP using malic acid as the substrate for endogenous malic enzyme (Sagar, Reference Sagar1986; Vaney & Young, Reference Vaney and Young1988; Vaney, Reference Vaney2004). Retinas were fixed with 4% PFA in 0.1 M PBS for 20 min at room temperature, followed by several washes, and overnight in 0.2% Triton in 0.1 M Tris buffer (pH 8.2). Solutions used for the diaphorase reaction were as described in Vaney and Young (Reference Vaney and Young1988). The reaction was allowed to proceed for 90 min at 37°C and was then stopped by extensive washing in Tris-buffered saline (pH 7.6). After retinas were removed from the Millipore filters, they were coverslipped as flat-mount preparations with 50% glycerol in PBS.
Tissue preparation for electron microscopy
For tissue not treated with antibodies, eyecups were immediately placed in 4% glutaraldehyde and 2% PFA in PBS for 2+ h at 4°C. Fixed eyecups were thoroughly washed with PBS and cut into squares with high rEF density prior to osmication. For those experiments using pre-embedding staining for parvalbumin, we started with 300- to 500-μm-thick slices cut from retinas lightly fixed in chilled 4% PFA for 1 h. After blocking in 10% normal goat serum and PBS for 1 h, sections were incubated in the primary antibody, mouse anti-parvalbumin (P3088; Sigma), diluted 1:1000 in PBS with 1% sodium azide and 1% saponin (16109; Sigma) for 5 days. Three 20-min washes in PBS both preceded and followed application of the secondary antibody, biotinylated goat anti-mouse (Vectastain ABC kit, NC9275715; Vector Labs), diluted 1:200 in PBS with 1% saponin and 1% sodium azide. Sections remained in the secondary antibody for 2 days and were then incubated in a 1:50 dilution of an avidin-biotinylated horseradish peroxidase complex (Vectastain ABC kit, NC9275715; Vector Labs) for 1 h, rinsed in PBS, and reacted in a solution of 0.05% 3,3′-diaminobenzidine (D5637; Sigma) and 0.1% hydrogen peroxide, with the addition of 0.025% cobalt chloride and 0.02% nickel ammonium sulfate for signal intensification (Adams, Reference Adams1981; Vugler et al., Reference Vugler, Semo, Joseph and Jeffery2008). The reaction was allowed to proceed for approximately 45 min with frequent solution replacement. Thorough washing in PBS terminated the reaction, and the sections were postfixed with 0.1% glutaraldehyde for 1 h and rinsed in PBS prior to osmication. For all EM material, small pieces of retina from the high–rEF density region were postfixed in 1% osmium tetroxide in 0.1 M phosphate buffer (pH 7.3) for 1 h. After buffer rinses, the retinal pieces were dehydrated in a graded series of ethanol, incubated in propylene oxide, and then infiltrated and embedded with epoxy resin (Poly/Bed 812; 08791; Polysciences Inc, Warrington, PA). Thick sections of the retinas were obtained for initial examination, and then, thin sections were cut from selected areas. Thin sections were stained with uranyl acetate and lead citrate prior to examination with a Philips CM120 transmission electron microscope (FEI Company, Hillsboro, OR).
Results
Anterograde labeling of rEFs and identification of TCs
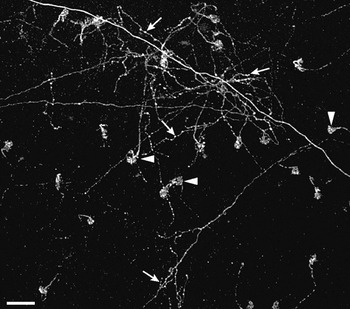
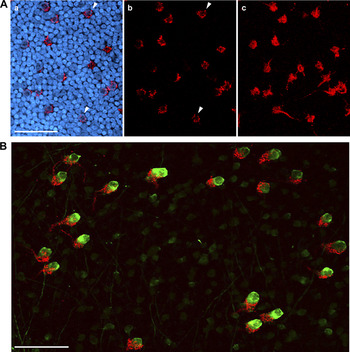
Injection of Fluoro-Ruby into the ION produced fluorescent labeling that was visible 3 days later in the contralateral retina. In whole-mount preparations, fibers in which the label had been anterogradely transported were seen to exit the optic nerve head and fan out in the fiber layer before diving into the IPL. Two distinct kinds of fibers were recognizable. The more numerous rEFs could be recognized as thick fibers, without collaterals, that swelled into dense synaptic terminals at the INL–IPL border (arrowheads in Fig. 2 and Fig. 3A). In confocal cross section, each rEF was seen to form a doughnut of Fluoro-Ruby-filled terminals around the soma of a single TC (arrowheads in Fig. 3A, panels a and b). In addition to the rEFs, thin fibers with a beaded appearance and multiple collaterals (arrows in Fig. 2) could also be seen. These are the “widespread efferent fibers” (wEFs) originating from a halo of “ectopic neurons” lying just outside the ION (Dogiel, Reference Dogiel1895; Hayes & Webster, Reference Hayes and Webster1981; Chmielewski et al., Reference Chmielewski, Dorado, Quesada, Geniz-Galvez and Prada1988; Fritzsch et al., Reference Fritzsch, Crapon de Caprona and Clarke1990) and whose anatomy we have not investigated further.
Comparison of wEFs and rEFs. Fluoro-Ruby-labeled terminals shown at the border of the INL and IPL in the retina. The distinctive pericellular nests (arrowheads) can be seen as the terminals of 23 rEFs. In addition, the diffuse arborization of one or more wEFs (arrows) is shown. Unlike the rEFs, wEFs give rise to collaterals and have multiple swellings (likely synaptic boutons) throughout their axonal arborization. Scale bar is 50 μm.

Gross structure of the rEF–TC synapse. (A) A single confocal plane just below the equator of TC somata is shown in a and b. In a, INL somata are shown stained with SYBR-green (blue) but in b these are omitted. In this plane of the retina, the pericellular nest (red) wraps around the soma of the TC, giving the rEF terminal a doughnut-shaped appearance (arrowheads). Panel c shows a collapsed z-stack of the entire pericellular nest. Scale bar is 50 μm. (B) A collapsed z-stack image from a retinal flat mount showing Fluoro-Ruby-labeled rEFs (red) and parvalbumin immunofluorescence (green). TCs are clearly distinguishable from the other parvalbumin-positive amacrine cells based on their larger size and more intense staining. Every TC is postsynaptic to a pericellular nest formed by a single rEF. Scale bar is 50 μm.

Density map of the rEF terminals
To enable ultrastructural examination of rEF terminals, it was necessary first to find the retinal locations in which terminal density was highest. In addition to this practical matter, the distribution of terminals is clearly a major constraint on theories of CVS function and justifies close examination. While older studies are ambiguous (Maturana & Frenk, Reference Maturana and Frenk1965; McGill et al., Reference McGill, Powell and Cowan1966; Crossland & Hughes, Reference Crossland and Hughes1978), several more recent studies conclude that efferent input is concentrated in the ventral retina (Hayes & Holden, Reference Hayes and Holden1983; Catsicas et al., Reference Catsicas, Thanos and Clarke1987b; Uchiyama & Ito, Reference Uchiyama and Ito1993; Uchiyama et al., Reference Uchiyama, Ito and Tauchi1995; Woodson et al., Reference Woodson, Shimizu, Wild, Schimke, Cox and Karten1995; Cellerino et al., Reference Cellerino, Novelli and Galli-Resta2000; Uchiyama et al., Reference Uchiyama, Aoki, Yonezawa, Arimura and Ohno2004; Uchiyama & Stell, Reference Uchiyama and Stell2005).
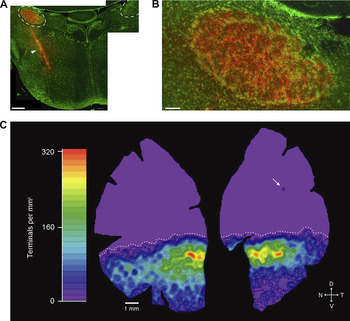
We examined the distribution of rEF terminals in two flat-mount retinas from chickens in which the unilateral injection of Fluoro-Ruby labeled all IO neurons, verified by inspecting sections, like the one in Fig. 4, drawn from the entire extent of the ION. Confocal microscopy was used to acquire images of the INL–IPL border over the entire extent of the retina. Roughly 200 images from each retina were montaged in Adobe Photoshop and loaded into Neurolucida to allow mapping of the locations of every Fluoro-Ruby-labeled rEF terminal. While wEFs were observed in these retinas, they were not included in these maps. The total number of rEFs in each retina was 7193 and 8166; however, the actual number is probably higher in each by a few hundred because some rEFs were unavoidably removed when the pecten was excised. The Neurolucida maps were converted to density maps, like the one shown in Fig. 4, by convolution with a two-dimensional Gaussian function. These maps show that rEFs are found in highest density in a band just below the horizontal midline (maximum density of ~320/mm2). Lower densities of rEFs were found throughout the rest of the ventral retina, and in the extreme ventral retina, densities of less than 10/mm2 could be seen. In both retinas, the extreme ventral region of the temporal quadrant was noticeably emptier than that of the nasal quadrant. In the dorsal retina, however, rEFs were completely absent. The transition between the high–rEF density band and the empty dorsal region was abrupt (declining from 320 to 0/mm2 in 1.5 mm), creating a clear boundary between the ventral and the dorsal retinas (dotted line in Fig. 4).
Distribution and density of rEF terminals. (A) Montaged image of a transverse section from the midbrain of a chicken following stereotaxic injection of Fluoro-Ruby into the left midbrain. IONs are outlined with dashed lines. While the injection site (arrowhead) was medial and ventral to the ION, the injection path ran through the left ION, resulting in labeling of the IO neurons (compare with the unlabeled right ION). SYBR green shows somata (green). Scale bar is 500 μm. (B) The left ION has been completely labeled by this injection, with every IO neuron appearing yellow; thus, all rEF terminals in the retina should be labeled. Scale bar is 100 μm. (C) Density map derived from the positions of all 7193 rEF terminals in this retina. rEF terminals are found in highest density in a band below the horizontal midline, reaching a maximum of 320/mm2 (red). Lower densities of rEFs were found throughout the ventral retina (green to blue). The dorsal retina is a uniform lavender, indicating that, with the exception of a single terminal in the upper temporal retina (arrow), rEFs are absent from this region. The transition from the high–rEF density band to the dorsal region is abrupt (maximum to 0 in 1.5 mm), creating a clear boundary between the ventral and the dorsal retinas (dotted line).

One-to-one contacts between rEFs and TCs
A separate set of flat-mounted retinas, from chickens in which the Fluoro-Ruby injection had resulted in complete labeling of the ION, was double labeled with an anti-parvalbumin antibody previously shown to identify three or four amacrine cell types (Sanna et al., Reference Sanna, Keyser, Deerink, Ellisman, Karten and Bloom1992). One of these types, the TC, is strongly positive and possesses a distinctly larger, flask-shaped soma extending higher in the INL than in the others (Fischer & Stell, Reference Fischer and Stell1999). Confocal z-stacks were acquired from the upper IPL through to the top of TC somata in the INL. As shown in Fig. 3B, each rEF contacts one and only one TC with a dense cluster of synaptic terminals that resembles the pericellular nest described by Ramón y Cajal (Reference Ramón y Cajal1889, Reference Ramón y Cajal1995), consistent with previous observations of the one-to-one connectivity in another Galliform bird (Uchiyama & Ito, Reference Uchiyama and Ito1993; Uchiyama et al., Reference Uchiyama, Ito and Tauchi1995). Because we examined flat mounts in which TCs were labeled, we can add that we never observed a large, prolate intensely parvalbumin-positive amacrine cell that was not surrounded by a Fluoro-Ruby-labeled pericellular nest. Consistent with this, we found this type of cell to be absent from the dorsal retina. We conclude that every TC receives input from one rEF and every rEF contacts one TC.
NADPH-diaphorase histochemistry of the rEF terminal
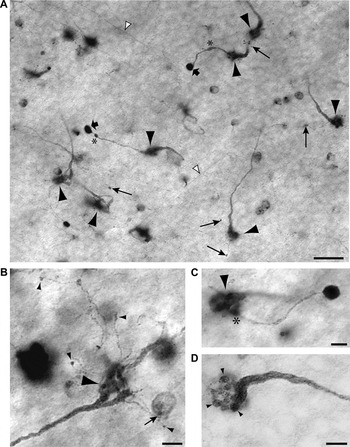
Several studies have established that both rEFs and TCs are strongly NADPH-diaphorase positive (Morgan et al., Reference Morgan, Miethke and Li1994; Goureau et al., Reference Goureau, Regnier-Ricard, Jonet, Jeanny, Courtois and Chany-Fournier1997; Fischer & Stell, Reference Fischer and Stell1999; Posada & Clarke, Reference Posada and Clarke1999; Rios et al., Reference Rios, Lopez-Costa, Fosser, Brusco and Saavedra2000), reflecting the high levels of nitric oxide synthase (NOS) expressed in these structures. We took advantage of this to examine the morphology of the rEF terminal in greater detail. A typical field of rEFs stained using the NADPH-diaphorase method is shown in Fig. 5A. Also visible in this plane are TC axons, almost all of which run to the dorsal retina in the uppermost lamina of the IPL as previously reported (Catsicas et al., Reference Catsicas, Catsicas and Clarke1987a; Uchiyama et al., Reference Uchiyama, Aoki, Yonezawa, Arimura and Ohno2004). As described for Fluoro-Ruby-labeled retinas, the rEFs appear as thick fibers without collaterals that swell into a dense synaptic terminal or pericellular nest (Fig. 5A, large arrowheads). With this staining method, it was possible to follow individual fibers from close to the optic nerve head to their eventual termination. Fibers run without branching, and more or less straight, in the fiber layer, until close to their termination where they dive through the ganglion cell layer and into the IPL. In the IPL, a significant fraction of them split into two or more branches, but invariably, these branches converge upon the same TC. The pericellular nest itself comprises 5–25 roughly spherical presynaptic structures, giving it the appearance of a bunch of grapes (Fig. 5D). These grapes are ~2 μm in diameter and are typically distributed from the base of the TC soma to its equator.
NADPH-diaphorase staining of rEF terminals. (A) NADPH-diaphorase-stained flat mount viewed at the INL–IPL boundary. Several rEFs give rise to large pericellular nests slightly out of the plane of focus (large arrowheads). Long arrows designate tiny boutons terminating fine “tendrils” arising from the pericellular nest. Another type of secondary synaptic structure, the “ball and chain” comprises a relative thick process, often with swellings (*) terminating in a dense ball (broad arrows). The somata of other diaphorase-positive amacrine cells and TC axons (white arrowheads) can also be seen in this image. Scale bar is 20 μm. (B) A high-magnification image of a single rEF terminal to show the structure of tendrils in greater detail. Tendrils can be seen to branch off the pericellular nest (large arrowhead). These very slender branches terminate in small synaptic boutons on unknown targets in the amacrine cell layer (small arrowheads). One bouton contacts a weakly diaphorase-positive amacrine cell (small arrow). Scale bar is 5 μm. (C) A high-magnification image of a single rEF terminal to show the structure of a ball and chain in greater detail. A single chain (diameter 1–2 μm) branches off (*) the pericellular nest (arrowhead) and terminates in a large (approximately 5 μm) intensely NADPH-diaphorase-positive ball. Scale bar is 5 μm. (D) A pericellular nest at high magnification is seen to comprise about fifteen 2-μm-diameter presynaptic structures (arrowheads), giving it the appearance of a bunch of grapes at the end of the swollen efferent fiber. Scale bar is 5 μm.

In addition to the pericellular nest, the NADPH-diaphorase method reveals two other types of synaptic structures arising from the rEF. We have called these structures “tendrils” (long arrows in Fig. 5A) and the “ball and chain” (short arrows in Fig. 5A). A number of other diaphorase-positive cells can also be seen in this image; these are more fully described elsewhere (Wilson et al., in preparation). Tendrils and the ball and chain were not visible in Fluoro-Ruby-labeled retinas, most likely because the tendrils and chain are too small to contain enough Fluoro-Ruby to be detected. This limitation is likely aggravated by the fact that Fluoro-Ruby is sequestered within intracellular organelles (Dacey et al., Reference Dacey, Peterson, Robinson and Gamlin2003) rather than freely diffusible within the cytoplasm.
Tendrils are minute side branches (<1 μm diameter) of the rEF terminal that end in a single small (~0.7–1.5 μm) synaptic bouton usually no more than 10 μm from the pericellular nest. Most of the rEF terminals we examined with diaphorase staining gave rise to one or more tendrils. In Fig. 5B, the large pericellular nest of a rEF (large arrowhead) is visible in the lower right, and a number of tendrils can be seen to branch off from portions of the pericellular nest. Most of these terminate in a synaptic bouton on an unknown target in the amacrine cell layer (small arrowheads) but, as was sometimes observed, one appears to contact a weakly diaphorase-positive amacrine cell soma (small arrow). This cell is found ubiquitously throughout the retina and is characterized by a monostratified dendritic field at an IPL depth of 80%. The density of these cells is highest around the horizontal meridian (1040/mm2), high in the dorsal retina (800/mm2), and about half that in the ventral retina. These neurons are undoubtedly those classified as type 1 by Fischer and Stell (Reference Fischer and Stell1999) and are described in detail elsewhere (Wilson et al., in preparation).
Other authors have observed smaller processes that branch off the rEF pericellular nest and synapse with neighboring cells at the INL–IPL border (Ramón y Cajal, Reference Ramón y Cajal1889, Reference Ramón y Cajal1895; Maturana & Frenk, Reference Maturana and Frenk1965; Chmielewski et al., Reference Chmielewski, Dorado, Quesada, Geniz-Galvez and Prada1988; Fritzsch et al., Reference Fritzsch, Crapon de Caprona and Clarke1990). While detailed descriptions of the processes were not provided, we believe they are probably the tendrils we describe here. Maturana and Frenk (Reference Maturana and Frenk1965) and Hayes and Holden (Reference Hayes and Holden1983) claimed that one of the targets of the tendril-like processes that they observed in pigeon was a displaced ganglion cell (DGC). In our experiments, we did not see any evidence for tendril synapses with DGCs, which typically are weakly stained by NADPH-diaphorase. However, given that some DGCs were negative for NADPH-diaphorase, we cannot eliminate the possibility that synapses between tendrils and these unstained DGCs were present but unobserved.
Like the tendrils, the ball and chain structure branches directly off the pericellular nest (see asterisk in Fig. 5C); however, the ball and chain is significantly larger and typically terminates further from the pericellular nest. The diameter of the chain is usually 1–2 μm and is often seen to have swollen regions. Unlike tendrils that rarely extend more than 10 μm from the pericellular nest, the ball and chain generally extends 20–30 μm. The ball itself is large, approximately 5 μm in diameter and nearly spherical, with very intense staining for NADPH-diaphorase, suggesting that it expresses a high level of NOS. The postsynaptic partner(s) of this structure is (are) unknown, but they do not include TCs or any other diaphorase-positive neurons. Only a minority of rEF terminals gave rise to a ball and chain, and only very rarely was a single rEF seen with two. This synaptic structure has not been previously described.
Morphology of the TC dendrites and initial segment
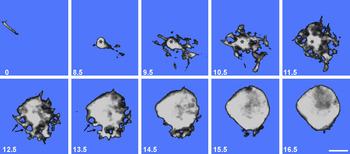
To visualize the structure of the TC, we injected these cells with Lucifer yellow in lightly fixed retinas. Fig. 6 shows a series of images from a confocal z-stack of one such cell. Images are referenced to the plane of the TC axon just below the INL–IPL border (0 μm). The dendritic region spans the sections 8.5 through 14.5 μm, and the soma extends upward from about 12.5 μm, though in reality, there is no clear separation of these regions. The dendritic region tapers down into the initial segment of the TC axon, which turns sharply to parallel the IPL–INL border in the uppermost layer of the IPL. The dendrites themselves are very short and anastomose to form an intricate basketwork confined to the INL and only rarely extending a little into the IPL. In the dendritic region, there are several round holes approximately 2 μm in diameter, suggesting that the grapes of the rEF terminal fit into the dendritic basketwork surrounding the axon initial segment, but as seen in higher optical planes, grapes are also pressed into the soma (arrows in Fig. 6).
Lucifer yellow–filled TC. A series of confocal z-sections showing a single Lucifer yellow–filled TC. The number in the lower left corner of each image represents distance from the INL–IPL border in micrometers. The upper left image (0 μm) shows the TC axon running parallel to the INL–IPL border. The axon initial segment (*) can be seen in images 8.5–11.5 μm where it gives rise to an intricate but tightly confined basketwork of dendrites. The basal region of the TC soma, 12.5–15.5 μm, shows 2-μm-diameter holes (arrows) representing spaces filled by presynaptic grapes of the rEF. The TC soma equator lies at approximately 16.5 μm. Scale bar is 5 μm.

Ultrastructure of the TC and neuropil
Using pieces of retina taken from the regions of highest rEF density, we examined the ultrastructure of TCs in radial sections. In practice, we found that it was easily possible to identify TCs in electron micrographs based solely on the pre- and postsynaptic features described in the previous sections. Specifically, we looked for large prolate cells located in the inner third of the INL that were contacted by large round synaptic terminals (the grapes of the rEF terminal). By these criteria, TCs were unambiguously identified and seen at a density consistent with Fig. 4C, but as confirmation, we visualized anti-parvalbumin binding using a heavy metal–intensified horseradish peroxidase reaction method (Adams, Reference Adams1981; Vugler et al., Reference Vugler, Semo, Joseph and Jeffery2008). Since primary antibody binding was eliminated by glutaraldehyde fixation, we were obliged to use light fixation of the retina. Even though reduced fixation degraded the quality of EM images, it was nevertheless possible to see that cells we would otherwise classify as TCs contained heavy reaction product (data not shown).
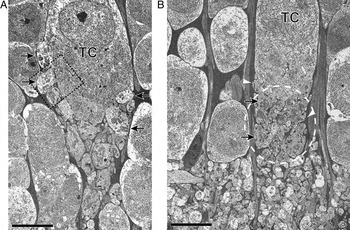
As we inferred from the Lucifer yellow fills and diaphorase staining, there was marked variation between TCs in the placement of presynaptic grapes. In some (Fig. 7A), grapes covered much of the soma, whereas in others (Fig. 7B), they were confined to the basal aspect of the cell. In all TCs, a striking feature of the rEF to TC synapse was that the zone of synaptic interaction between the TC dendrites and the presynaptic rEF grapes was located above the IPL, within the INL (based on EM examination of 11 TCs). In addition, this zone of synaptic interaction was curtained off from the surrounding amacrine cells by a sheath of Muller cell processes (the electron-dense areas indicated by white arrowheads in Fig. 7B). Thus, it appears that each TC receives synaptic input in its own “private neuropil” (dashed region in Fig. 7B), removed from the general region of interaction in the IPL. We estimate the volume of the private neuropil for the TC shown in Fig. 7B to be roughly 500 μm3.
Ultrastructure of TC. Two TCs are shown here to illustrate the variability in synaptic organization. (A) As with all TCs, this example shows a neuropil region below the soma but within the INL. Presynaptic grapes are visible in the neuropil region but are also pressed into the soma (arrows) approximately up to the equator of the soma. (B) Presynaptic grapes (arrows) in this example are basal to the soma. The neuropil region (indicated by a dashed oval) lies above the IPL–INL boundary and is curtained off from the surrounding amacrine cells by a sheath of Muller cell processes (the electron-dense areas indicated by white arrowheads). Scale bar is 5 μm.

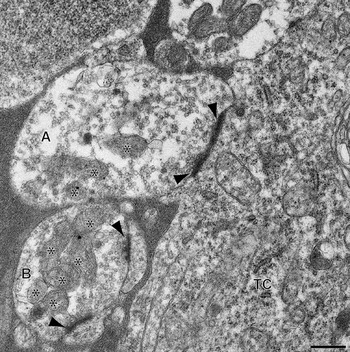
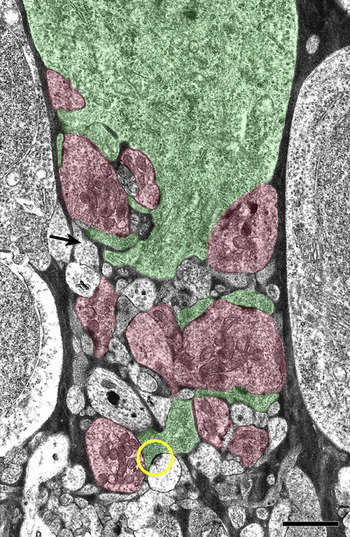
At high magnification, EM images showed that rEF grapes, the presynaptic structures that form the pericellular nest, contain numerous mitochondria and an abundance of clear round synaptic vesicles. Each presynaptic grape has multiple active zones characterized by pre- and postsynaptic densities of approximately 300 nm diameter, around which a dense cloud of vesicles may be seen (Fig. 8). The TC soma and its dendritic processes were characterized by a relatively dense cytoplasm containing clusters of ribosomes and rough endoplasmic reticulum. For the TC shown in Fig. 9, processes that could be unambiguously identified as belonging to either the TC or the rEF on the basis of cytoplasmic appearance were colored green or red, respectively, while those processes that could not be unambiguously identified were left uncolored. Some of these ambiguous processes must belong to the TC or rEF, but others are apparently different, having very light cytoplasm and a low density of small pleomorphic synaptic vesicles. One such process can be seen to make a synapse with one of the TC dendrites (circle in Fig. 9).
Ultrastructure of rEF presynaptic boutons. Two rEF presynaptic boutons (grapes) and a portion of the efferent TC soma taken from the boxed region of Fig. 7A and shown at higher magnification. Cytoplasm of the TC is characterized by an abundance of ribosomes and rough endoplasmic reticulum. The larger rEF grape (A) is presynaptic to the TC soma and, in this plane, shows two active zones (arrowheads) around which are aggregations of clear round synaptic vesicles. The smaller rEF grape (B) shows two synaptic densities (arrowheads) at which two small processes are the postsynaptic elements. Both grapes contain an abundance of mitochondria (*). Scale bar is 0.5 μm.

Organization of the TC's private neuropil. Using the cytoplasmic characteristics of the TC and rEF grapes, processes were identified and colored green or red, respectively. Processes that could not be unambiguously identified have been left uncolored. Some of these processes likely belong to the TC or rEF, but others are different, having very light cytoplasm and a low density of small pleomorphic synaptic vesicles (arrow shows one example). A second process of this type is seen presynaptic to one of the TC dendrites (yellow circle). Scale bar is 2 μm.

To confirm that these light-cytoplasm processes are genuinely different from the rEF terminals, we compared the size of their synaptic vesicles by measuring the area of vesicles within these structures using ImageJ software. Measured area was then converted to equivalent diameter. The mean diameter of rEF vesicles was found to be 46 ± 15.1 nm, whereas for light-cytoplasm processes, the value was 37 ± 16.7 nm. A comparison of the distribution of vesicle sizes showed that these two populations of synaptic vesicles were significantly different (P < 0.001; Kolmogorov–Smirnov Test). Pleomorphic synaptic vesicles are commonly a signature of GABAergic terminals elsewhere in the nervous system (Montero & Singer, Reference Montero and Singer1984; Oberdorfer et al., Reference Oberdorfer, Parakkal, Altschuler and Wenthold1988; Mize et al., Reference Mize, Whitworth, Nunes-Cardozo and van der Want1994; Iliakis et al., Reference Iliakis, Anderson, Irish, Henry and Westrum1996; Hoshino et al., Reference Hoshino, Hicks, Hirano and Norita2000; Sherman & Guillery, Reference Sherman and Guillery2002), and GABA is the neurotransmitter of a majority of amacrine cells (Wilson & Vaney, Reference Wilson, Vaney, Basbaum, Kaneko, Shephard, Westheimer, Masland and Albright2008); we suggest, therefore, that light-cytoplasm processes are likely from an amacrine cell and may be GABAergic.
Discussion
Distribution of rEF terminals
In this study, we show the distribution of rEF terminals in the chicken retina by mapping the position of every one. Our maps extend the qualitative observation from other studies of chicken retina (Catsicas et al., Reference Catsicas, Thanos and Clarke1987b; Fritzsch et al., Reference Fritzsch, Crapon de Caprona and Clarke1990; Morgan et al., Reference Morgan, Miethke and Li1994; Fischer & Stell, Reference Fischer and Stell1999; Cellerino et al., Reference Cellerino, Novelli and Galli-Resta2000) that rEF terminals are concentrated in the inferior retina. Exclusion from the superior retina is strict: Of the 15,359 rEF terminals we counted in two retinas, only 2 errant terminals were present in the dorsal retina. Terminals of rEFs are also reportedly absent from the dorsal region of the quail retina (Uchiyama & Stell, Reference Uchiyama and Stell2005), but only in pigeon retina is a quantitative map available for comparison with our data (Hayes & Holden, Reference Hayes and Holden1983). Based on sampling of HRP-filled efferent fibers in the retina, the pigeon retina map is similar to chicken in showing an absence of rEF terminals from the dorsal retina but different in several other regards. Maximum density of terminals is somewhat higher in pigeon, 500 as opposed to 350/mm2, but, like chicken, the maximum density is found close to the horizontal meridian. Unlike the chicken though, the distribution in pigeon is biased toward the temporal retina, and the rEF terminal distribution extends higher in the retina than it does in chicken. Very likely, these differences are correlated with differences in the visual fields of the two species and their typical eye position relative to the visual world. Although this has received some attention in pigeon (Nalbach et al., Reference Nalbach, Wolf-Oberhollenzer, Remy, Zeigler and Bischof1993), a comparison is not possible as similar studies have not been done in chicken.
rEFs give rise to three distinct types of synaptic terminals
The main synaptic connection of rEFs in the chicken retina is with TCs, also known as association amacrine cells (Fritzsch et al., Reference Fritzsch, Crapon de Caprona and Clarke1990; Uchiyama & Stell, Reference Uchiyama and Stell2005). These cells are readily recognized, unusually large, and strongly parvalbumin-positive neurons. Every one of these neurons has a single rEF contacting it with multiple large boutons resembling a bunch of grapes. This main synaptic structure is somewhat different from both the pigeon and the quail. In the pigeon, not all rEFs make contact with TCs, but those that do converge upon a TC soma with a few large boutons (Dowling & Cowan, Reference Dowling and Cowan1966; Hayes & Holden, Reference Hayes and Holden1983). The description of the synapse in Dowling and Cowan (Reference Dowling and Cowan1966) and the one micrograph illustrating it suggest that the complex dendritic basketwork we see in chicken might be absent from pigeon. In the quail, rEFs apparently end in single very large boutons that invaginate the basal part of the TC soma (Uchiyama & Ito, Reference Uchiyama and Ito1993).
The fact that in double-labeled preparations we saw no TCs without rEF contacts confirms the supposition that TCs have no other function than as an element in the CVS. The one-to-one nature of the contact between rEFs and TCs is striking. Even though many rEFs split into branches while crossing the IPL, these branches nevertheless converge upon a single TC. In this regard, chicken differs from pigeon, where a significant fraction of rEF branches diverge to separate targets (Dogiel, Reference Dogiel1895; Maturana & Frenk, Reference Maturana and Frenk1965; Hayes & Holden, Reference Hayes and Holden1983). We cannot rule out the possibility that, in the chicken, some small degree of branching of rEFs occurs in the optic nerve, but this seems unlikely since in pigeon, the number of rEFs in the retina closely matches the number of neurons in the ION (Hayes & Holden, Reference Hayes and Holden1983), and the same is probably true in chicken.
As in pigeon and quail (Dowling & Cowan, Reference Dowling and Cowan1966; Uchiyama & Ito, Reference Uchiyama and Ito1993), the large presynaptic boutons of rEFs are loaded with vesicles, and as we show here, each bouton has multiple active zones apposed to either the TC soma or its diminutive dendrites. Together with other indications, such as myelination of rEFs (Cowan, Reference Cowan1970), this suggests that efferent input to TCs is both fast and very powerful. Almost certainly, this is the largest synaptic structure between one neuron and another in the avian retina.
In addition to this major synaptic output, there are two other kinds of synaptic structures made by rEFs. A majority of rEF terminals give rise to a few fine processes (tendrils) that terminate in single small boutons at the bottom of the INL. In most cases, we were unable to identify the postsynaptic partners of tendrils; however, we do know that in some cases, tendril synaptic boutons apparently contacted the soma of a lightly diaphorase-positive amacrine cell, clearly the type 1 cell described by Fischer and Stell (Reference Fischer and Stell1999). Other authors have mentioned observing small side branches from rEF terminals (Ramón y Cajal, Reference Ramón y Cajal1889; Maturana & Frenk, Reference Maturana and Frenk1965; Chmielewski et al., Reference Chmielewski, Dorado, Quesada, Geniz-Galvez and Prada1988; Fritzsch et al., Reference Fritzsch, Crapon de Caprona and Clarke1990); however, these side branches were not described in sufficient detail to allow comparison with the tendrils described here. Maturana and Frenk (Reference Maturana and Frenk1965) claimed that DGCs were one of the synaptic partners of tendrils, but this claim has been contested in multiple studies (Dowling & Cowan, Reference Dowling and Cowan1966; Fritzsch et al., Reference Fritzsch, Crapon de Caprona and Clarke1990; Uchiyama & Ito, Reference Uchiyama and Ito1993; Nickla et al., Reference Nickla, Gottlieb, Marin, Rojas, Britto and Wallman1994), and synapses between tendrils and DGCs were not observed here.
In addition to tendrils, we found that a minority of rEFs gave rise to a novel and unique, putatively synaptic structure that we have called the ball and chain. The most striking feature of this structure is the large (~5 μm diameter) terminal ball that is intensely diaphorase positive, suggesting that the ball and chain is a significant source of nitric oxide (NO) in the retina. We were unable to identify the postsynaptic partner of this structure, but it was neither a TC nor any other kind of diaphorase-positive neuron. Considering the high diffusibility of NO (Dawson & Snyder, Reference Dawson and Snyder1994), the cells influenced by this structure could be numerous. Alternatively, given evidence that mechanisms exist in the retina to limit the diffusion of NO to specific synaptic regions (Blute et al., Reference Blute, Lee and Eldred2000), the postsynaptic targets could be limited to just those cells in physical contact with the ball.
Synaptic interaction between rEFs and TCs occurs in a private neuropil
Lucifer yellow fills of TCs, EM studies, and diaphorase staining provide complementary and consistent pictures of the main synaptic output of rEFs. The number of presynaptic grapes varies by a factor of 5, and their placement is also variable. In some TCs, grapes were pressed into the soma, forming what Ramón y Cajal called a pericellular nest. In all TCs, grapes were seen in a distinct neuropil region lying below the main part of the soma. The neuropil itself is a complex basketwork of stubby and anastomosing TC dendrites interwoven with the rEF terminals and processes contributed from other neurons. Significantly, this zone of synaptic contact does not lie within the IPL, where virtually all the synapses of other inner retina neurons are confined, but is restricted to a region of the INL between the base of the TC and the INL–IPL border, effectively forming a private neuropil.
While a superficially analogous situation occurs in the outer retina, where the pedicles of cones enclose a specialized region of synaptic contacts, a more illuminating parallel might be drawn with the glomeruli of the cat lateral geniculate nucleus. Here, as in the private neuropil of the TC, NO is thought to be a modulator (Sherman & Guillery, Reference Sherman and Guillery2002), though of unknown function. Both the TC private neuropil and the LGN glomerulus consist of a synaptic region segregated from surrounding neurons by a glial sheath, and we might speculate that this plays a role in limiting the diffusion of NO.
TCs receive synaptic input from putative retinal neuron terminals
The prevailing view of TCs is that they are “slave neurons” driven by efferent input (Uchiyama et al., Reference Uchiyama, Aoki, Yonezawa, Arimura and Ohno2004). This is plausible in view of the massive input they receive from rEFs and the one-to-one nature of this contact. Within the private neuropil of the TC, however, we show there are synaptic inputs to TCs from other neurons that we tentatively suggest may be GABAergic amacrine cells. The importance of these retinal inputs needs to be established through physiological recordings, but, at a minimum, this suggests that local activity in the ventral retina can modify the responses of TCs.
Implications for the function of the CVS
An unusual and surprising feature of the CVS is that the axons of TCs project mostly to the dorsal retina but do so in a disorderly way (Catsicas et al., Reference Catsicas, Catsicas and Clarke1987a; Uchiyama et al., Reference Uchiyama, Aoki, Yonezawa, Arimura and Ohno2004) quite unlike the precise mapping found elsewhere in the CVS, as exemplified by the orderly retinotopic map found in the ION (Holden & Powell, Reference Holden and Powell1972). The current interpretation of this anomaly is that, because TCs act merely as slave neurons, the placement of their somata is not tightly regulated and actually has no bearing on the functional topology of their wiring (Uchiyama et al., Reference Uchiyama, Aoki, Yonezawa, Arimura and Ohno2004; Uchiyama & Stell, Reference Uchiyama and Stell2005). From this perspective, it is only the position of the TC axon terminal in the dorsal retina that is important and this, physiological data argue (Li et al., Reference Li, Xiao, Fu and Wang1998), is arranged to overlap the receptive field of the rEF from which that TC receives input. Three findings we report here bear on this interpretation. First, we find that rEF terminals and TCs are not just more concentrated within the ventral retina but are, in fact, strictly confined there. This might suggest that TC placement is tightly regulated rather than haphazard. Second, we find that TCs receive synaptic input from neurons in the ventral retina. The nature of this input can only be known through physiological recording, but, like all neuronal signals in the retina, it must carry spatially specific information. Our third finding is that rEFs, which we know from studies in pigeon (Holden & Powell, Reference Holden and Powell1972; Miles, Reference Miles1972) do themselves carry spatially specific information, make minor synapses with neurons other than TCs. In particular, a small-field amacrine cell is one likely postsynaptic partner. Taken together, these three observations argue that efferent terminal and TC position within the retina may be significant and in some way contribute to the function of the CVS.
Acknowledgments
We thank Leah Krubitzer and her lab for teaching us survival surgery and Nathan Hart for help with some of the NADPH-diaphorase experiments. This work was supported by NIH awards EY04112 and EY12576. Work was conducted in a facility constructed with support from Research Facilities Improvement Program grant number C06 RR-12088-01 from the National Center for Research Resources, NIH.