

Introduction
Observation of market interactions between public authorities and private firms reveals substantial variation in their structures. In some contexts, authorities acquire goods and services from a variety of firms, and firms similarly interact with a variety of government institutions. In others, narrower ties, characterized by repeated, undiversified interactions, dominate. The purpose of the following analysis is understanding how these differences emerge, and what they mean for theoretical accounts of the relationship between government and economic actors. In particular, the analysis asks whether the differences can mostly be explained by the technical nature of the market and the institutional framework immediately surrounding it, or whether they also point to more fundamental strategic considerations from the two counterparties. An important theoretical tradition in new institutional economics certainly points towards the second approach. According to this view, the fundamental nature of procurement interactions is a relational one, in which a particularly complex principal-agent relation exists. In such a setting, matches may form in ways determined by mutual incentives to economize on transaction costs. In particular, environments characterized by weak outside enforcement of agreements should, on average, favor the development of undiversified ties, in which familiarity allows the parties to bring predictability to their interaction. Of particular concern for the public procurement setting is the situation in which the weak outside enforcement is due to the corrupt, or otherwise socially undesirable, nature of the transaction. In such settings, repeated or otherwise close interactions between public and private agents could perpetuate these undesirable outcomes. The analysis in the following therefore seeks to identify the conditions under which close ties between public authorities and private firms develop, and to evaluate whether there is indeed a connection between such close ties and undesirable outcomes, whether measured at the aggregate country level, or at the level of the individual transaction.
Open-government data on public procurement in the European context will allow an empirical analysis of patterns relevant to this question, the extent of which, to our knowledge, is novel to the literature. The statistical analysis will make use of a dataset on 3.3 million public contract awards from thirty-three European Economic Area members and associate countries, between 2009 and 2015. The connection between the diversity outcomes and their predictors will be estimated through random forest models,Footnote 1 which have been developed in the statistical learning or “machine learning” literature, and which have significant advantages when the objective is an accurate modelling of the outcome in problems with lots of variables and little guidance about the true functional form of the model. Their interpretation, however, is similar to that of other statistical models, and much of the technical detail has been relegated to the appendices. As a secondary technical consideration, significant effort has gone into forming unique identifiers for the firms and government authorities in the data, given that a fully reliable method for identifying them does not exist. Again, much of the detail is found in the appendices.
The results of the analysis point towards a strong connection between the governance environment and the structure of matches, whether in terms of repeated interactions or geographical distance. The structural determinants of the outcome, such as the nature of the product or the type of buying authority, while behaving as expected, still allow for significant variation to be explained by more theoretically relevant variables. The most striking finding is that, even after accounting for a wide variety of other predictors, the structure of matches still differs greatly between countries, and those differences map onto an indicator of the quality of governance: countries with cleaner and more effective government feature higher average levels of diversification of the matches between public and private actors. Moreover, the connection is not explained by different levels of economic development, which are unconnected to the outcome once governance quality is accounted for. Beyond this, less diversified ties are also predicted by contract-level indicators of undesirable outcomes, such as less competition, and to some extent less-open bidding procedures. These patterns offer support for the idea that undiversified ties are integral to the functioning and survival of inefficient and corrupt systems of governance; and complement previous theoretical, qualitative, and experimental works on this topic. More generally, the findings offer empirical support for a key claim of the new institutionalist literature, namely that repeated interaction should be expected to emerge as an enforcement mechanism in settings characterized by weak outside enforcement.
This article contributes to an emerging literature on the political economy of public contracts, and broadly complements existing findings in these works. Boas et al. (Reference Boas, Hidalgo and Richardson2014) show that public contracts are a key driver of corrupt exchanges between businesses and politicians in Brazil. By contrast, Aggarwal et al. (Reference Aggarwal, Meschke and Wang2012) show that electoral donations have no effect on the awarding of public contracts in the United States. These contrasting findings justify a focus on examining the connection between governance quality and the nature of procurement interactions. Charron et al. (Reference Charron, Dahlström, Fazekas and Lapuente2017) show that corruption markers in contracting data (single-bid contracts, restricted procedures, and others) are connected to the career incentives of the bureaucrats awarding them, with more political control predicting more problematic outcomes. Klasnja (Reference Charron, Dahlström, Fazekas and Lapuente2015) uses markers of corruption in Romania (including discrepancies in asset disclosures, indicators of suspicious contracting procedures, and public spending data) to test for their effects on incumbency disadvantage, and finds a substantial impact. Lonsdale et al. (Reference Lonsdale, Sanderson, Watson and Peng2016) provide a careful empirical analysis of opportunistic behavior on the part of suppliers, founded in the same transaction-cost arguments as here. Hansson (Reference Hansson2012) similarly analyzes the opportunistic behavior of public authorities in the context of EU procurement, and the private sector response to this. Baldi et al. (Reference Baldi, Bottasso, Conti and Piccardo2016) analyze the connection between project complexity, institutional framework, and corruption, in an Italian setting. Fazekas and Koksis (Reference Fazekas and Kocsis2017) develop a methodology for identifying corruption in contracting from institutional markers (including awarding without a call for tenders, restrictive procedures, short time frames, and subjective evaluation criteria), which will be useful for interpreting the results in this paper. This article complements these works by focusing on a factor that has received comparatively less attention, namely the diversity of ties between buyers and sellers, and discussing the connections between this and other key variables from the literature. Section two of the article will present the theoretical background of the analysis and its connections to the existing literature; section three will present the data, together with the random forest methodology; section four will present the results, and section five will offer some conclusions.
Theory and connections to the literature
The political economy literature on government–firm interactions in the procurement context draws upon contract theory and new institutional economics. There is wide agreement in the literature that the procurement transaction is characterized by a complex principal-agent problem involving the buyer, the seller, and the public as a whole.Footnote 2 The first aspect of the problem is the relationship between the government actor and the business. Transaction costs in this relationship arise from the possibility of opportunistic behavior on the part of the firm, the government authority, or even third parties. Possible solutions to the problem include repeated interactionFootnote 3 and reputation-building.Footnote 4 This provides the first reason we expect environments with weaker outside enforcement of agreements to lead to less diverse ties, if such ties emerge as solutions to commitment problems. At this level there would be nothing necessarily corrupt about such ties, as they could be merely an adaptation to an adverse institutional environment.
It is unlikely however that the story ends here. The second aspect of the problem refers to agency from the public towards the authority-firm pair.Footnote 5 As the authority and the firm are spending and receiving somebody else's money, in settings with weak outside enforcement there are strong incentives towards collusion and mutual extraction of rents from the transaction, by, for example, agreeing on an excessive price or tolerating poor quality. These rents could then be distributed between the public and private actors. An extreme form of this arises when the government actor is effectively dealing with herself, in situations in which the firm is under her control. At the other end of the continuum, the collusion can take the subtle form of a cozy relationship, in which substantial inefficiency exists, but officials are spared the effort of searching for and developing new connections, and the firm derives supercompetitive profits. The key characteristic of such interactions is that they breach the public's trust, and therefore their illicit aspects are not subject to outside enforcement.Footnote 6 A series of works have argued that interactions lacking third-party enforcement should lead to undiversified ties being formed, in which repeated play is the chief enforcement mechanism. The argument has been made on a theoretical level,Footnote 7 as well as tested in an experimental setting.Footnote 8 In a more applied setting, Tonoyan et al. (Reference Tonoyan, Strohmeyer, Habib and Perlitz2010), as well Jancsics and Javor (Reference Jancsics and Jávor2012), argue in two studies of corruption in Eastern Europe that close social ties are a chief enforcement mechanism for illegal interactions in the region. The literature on the negative effects of social capitalFootnote 9 similarly cautions that while close social ties between pairs of actors can facilitate cooperation between them, this does not imply the social desirability of such cooperation. Similar conclusions could be derived from the sociological literature on weak ties,Footnote 10 which argues that diffuse, numerous ties, between agents can lead to better economic outcomes; as well as from the distinction between particularism and universalism in characterizing the fundamental nature of corrupt interactions present in the political science literature on the topic.Footnote 11 This provides the second reason why we expect markers of poor governance to be connected to undiversified interactions, as the undiversified ties should emerge as a socially undesirable adaptation mechanism.
The two channels suggested above could, in principle, manifest themselves separately: We could imagine a situation in which the close ties emerge only through the first mechanism, when fully uncorrupt and efficiency-minded officials, along with law-abiding firms, engage in repeated or otherwise close interactions due to poor enforcement of agreements by the judiciary. This, however, is unlikely in practice. An environment in which opportunistic behavior towards the counterparty to a transaction is not well policed is very likely also an environment in which opportunistic behavior towards the public is not well policed, making the distinction moot. Going even beyond that, Lambsdorff and Teksoz (Reference Lambsdorff, Teksoz, Lambsdorff, Taube and Schramm2004) make the argument that connections between public and private actors that emerge for legitimate reasons then generate the environment of trust, which facilitates the development of corruption. Once the trust between parties has emerged in a setting of weak outside enforcement, the assumption that it will not be used for mutual income maximization would be hard to sustain. For all these reasons, it would be difficult to argue that the connection between poor governance and close ties is indicative of a socially “second-best” adaptation.
An aspect of the diversification of ties that has not received as much attention in the literature is their geographical distribution. When transaction costs increase with distance (as would be the case in a setting where joint, illegitimate, rent extraction is the objective of both parties and therefore impersonal, long-distance agreements are hard to maintain), local ties will be favored by officials. Such interactions may be easier to maintain in the absence of outside enforcement, and may arise naturally when the buyer and the seller are just two instances of the same entity. Local ties would also emerge when the motivations of political actors in favoring local companies are political but not directly extractive in nature, for example, when they wish to support local employment and/or the success of local donors.Footnote 12 If indeed geographical diversity plays a similar role to our previous conceptualization of diversity, we would expect the predictive model for this outcome to behave similarly to the first case. Indications of this logic are present in the literature on parochial corruption,Footnote 13 as well as on the governance of illicit transactions,Footnote 14 even if not explicitly spelled out.
The economic logic outlined above provides one motivation for studying the emergence of diversified versus undiversified ties. If the logic is valid, then undiversified ties should disproportionately emerge in countries with poorer governance, and should also be associated with contract-level markers of socially undesirable outcomes, as identified by previous literature. Undiversified ties would then be both a cause and an effect of such outcomes. They would arise when agents are intent on acting in such socially undesirable ways and the wider institutional environment does not provide a check on their intentions, and once formed they would sustain collusive behavior on the part of the buyer and the seller. While this logic is relatively simple, due to data limitations, it has received limited empirical support so far. Brown et al. (Reference Brown, Falk and Fehr2004) tackle a part of this claim in an experimental setting, and show that indeed undiversified, repeated ties emerge naturally in transactions without third-party enforcement. Extending this result to representative observational data would therefore strengthen these conclusions and confirm that a basic proposition of the theoretical literature does indeed hold in real-world data. (As also noted by Brown et al., this is especially important as conclusions regarding cooperation under repeated interaction are derived from models that almost always generate multiple equilibria, and there should be no a priori assumption that the cooperative one is generally chosen.) Moreover, extending the results to a geographical understanding of diversification would point towards the same logic being at work here, and towards the relevance of geographical proximity to our understanding of inefficient or corrupt interactions.
A different strand of literature relevant to our argument looks at the effects of known ties between firms and officials on firm performance. The conclusions of this literature are generally that such ties do lead to supercompetitive returns, in settings as varied as the United States,Footnote 15 Brazil,Footnote 16 Pakistan,Footnote 17 Hungary,Footnote 18 and cross-nationally.Footnote 19 A notable exception to this conclusion is Fisman (Reference Fisman2001), who argues that in a setting with strong rule of law, the United States, such ties did not lead to excess returns. These findings further justify attention towards mechanisms that may strengthen ties between firms and public authorities, such as repeated interaction.
Testing the above propositions in observational data is not trivial because the equilibrium nature of the ties between buyers and sellers will very likely be influenced by a host of other structural and economic factors. The nature of the product being transacted is an obvious one: some markets, especially those for complex products, are simply more concentrated on either the seller side, or the buyer side, or on both.Footnote 20 It may also be that various types of government authorities (such as central government ministries, local government authorities, or public utilities) behave systematically differently in these transactions, for reasons which have little to do with the logic above. Including such factors in any explanatory model is therefore warranted for meaningful conclusions to be drawn. It may indeed emerge from the analysis that most, or all, of the variation in the nature of firm–authority ties are due to such structural and economic reasons, which, while interesting to analyze in itself, would cast doubt on the relevance of the outcome for wider questions regarding governance and efficiency. The same arguments apply to the geographical distribution of ties.
An alternative, which is even farther removed from the governance and transaction costs argument, is one in which undiversified ties are simply signs of efficiency: If buyers manage to identify the best suppliers and sellers similarly manage to specialize in serving the buyer for which they can do the best job, then repeated interactions between buyers and sellers would not be a sign of an environment with high transaction costs, but simply of first-best efficiency. (This would certainly be the view adopted by public officials and firms quizzed on suspiciously close ties). If this view is valid, then we would expect the opposite patterns to hold in the data, that is close ties should be associated with positive outcomes, which would cast doubt on the applicability of the transactions-cost view, at least in this European setting.
The empirical effort motivated by the arguments above is one in which contract-level measures of tie diversity (whether in terms of repeated interaction or close geographical proximity) are first studied as the outcome, and a host of competing contract-level explanatory factors are used as predictors, in addition to country fixed effects meant to model the average diversity level for each country. Separate country-level models can then be used to check whether these country-level averages of the diversity outcomes are indeed associated with indicators of governance quality and other country-level controls.
Data and methods
The full dataset comprises all public contracts that have been published in the Journal of the European Union between January 2009 and December 2015. There are 3,307,700 contract awards, from thirty-three countries, including all EU member states, the members of the EEA, and two candidate countries, one of which joined the European Union during the period. The reliability of the data is supported both by the legal requirement regarding publication of public contract calls and award notices worth beyond certain monetary thresholds in the journal (arising through Council Directive 2004/18/EC, updated by Council Directive 2014/24/EU), and by the fact that it is used by the European Commission for policy analysis.Footnote 21 The most relevant thresholds, are €133,000 in 2009, rising to €135,000 in 2015 for most contracts, and €5,150,000 in 2009, rising to €5,225,000 in 2015 for infrastructure projects.Footnote 22 These values refer to the total value of the contract, but contracts are often split into lots, also called “contract awards,” which will be of lower value.
The journal entries are legal documents, and therefore the quality of the winner and authority data recoded in them can be expected to be quite high. The forms require the “official name” of the winning company, as well as of the contracting authority to be recorded. However, the nature of the recording process, done by potentially thousands of different employees across a country, means that inconsistencies are inevitable. Moreover, some companies may have several operational divisions, and it is not clear whether the division or the larger company should be recorded in these fields, providing a further source of potential error. The “record linkage” task of merging different recordings of the same entity has received significant attention in computer science.Footnote 23 The procedure used here follows the basic steps from the literature, with the full algorithm being described in appendix 4. To test the success of the procedures, a random sample of one hundred contract awards was extracted from the full dataset and analyzed manually, with the results presented in table 1.
Estimated accuracy of record linkage procedure

Note: Results based on a sample of one hundred contract awards. Sampling seed 12345 in R. Joint bids (.02 of sample) are counted as misclassified in all cases. The first cell for “pos/neg accuracy” is the percentage correctly included in its cluster. The second cell is the percentage not included in the correct cluster. If an entry fails the first criterion, it also fails the second. Overall accuracy is percentage meeting both criteria.
The first step of the linkage algorithm is a cleaning of the data to remove capitalization, punctuation, and common designations such as “Inc.” or “SA.” This step reduces the number of unique names by 33 percent for companies and 24 percent for authorities, and generates classification accuracy levels of 84 percent and 89 percent on our test sample of one hundred cases, respectively. The second step is to make use of the address information provided in the forms. While sharing the same street address and a similar name at the same time is not a necessary condition for a match, it is arguably a sufficient one. The third step is clustering similar names together based on a measure of string distance. The procedure uses the Jaro-Winker distance,Footnote 24 which has been shown to be the most accurate for name-matching tasks by Cohen et al. (Reference Cohen, Ravikumar and Fienberg2003). The clustering algorithm is based on the logic that similar names should be grouped together, and that the more frequently encountered one is more likely to be the correct one. Therefore, for every unique name in the dataset the algorithm searches for the closest match among the more frequently encountered terms, and links the entry to the more common one if the distance is below a certain threshold.
Table 1 presents the estimated accuracy of four procedures on our sample of one hundred contract awards: In each case, an entity is recorded as correctly classified if it avoids both a false positive and a false negative error. Additionally, the two joint bids in the sample are always counted as misclassified. In this and all other linkage procedures, a tradeoff between avoiding false negatives and false positives will arise. While the mild cleaning of the data generates no false positives, it will obviously miss many matches. As more aggressive joining criteria are used, the balance shifts towards more false positives. The table shows that the algorithm achieves an estimated overall accuracy of 95 percent for company names, for a clustering with a threshold of .05, and of 97 percent for authority names, when they are linked on the address and similarity. The body of the paper presents results on this combination of parameters, and appendix 2.3 provides results on the other combinations, to show that movements along the tradeoff between false positives and negatives do not affect the basic results, beyond creating more noise in the data, which is reflected in slightly lower predictive accuracy. The errors that survive the linkage procedure are unlikely to affect the findings beyond introducing noise in the estimation process because they are based on considerations of language rather than on theoretically relevant factors, and are likely orthogonal to the patterns uncovered in the analysis. Appendix 4 provides more details on this record linkage procedure, including a description of less successful attempts.
Another methodological concern is that some of the variables contain missing data. This most often arises not as a result of willful misreporting, but because the quantity does not apply to that transaction. For example, contract awards for which the total price is not established beforehand will not have a price being recorded, and so on. In these cases it would be inappropriate to impute the values, so, in order to make sure they are included, missing data is always treated as a separate category for categorical variables. (This is also sometimes done by default in the EU data). The two continuous variables are transformed into a set of indicators for the quintiles and deciles of the distribution, respectively. This allows treating the missing data as a supplementary category. Given the excellent ability of the random forest models to deal with such categorical variables, this should not generate any meaningful loss of information.
To model the connection between explanatory factors and the dependent variables, a random forest (RF) model is especially appropriate given the nature of the data. RF is a machine learning technique based on decision trees and bootstrapped aggregation of the results of multiple trees.Footnote 25 A decision tree is series of bifurcations that subdivide the sample according to splits on the independent variables. The splits are performed according to the criterion of minimizing squared loss in the dependent variable, and they take place until a small number of data points are present in each terminal node of the tree. (Fifty data points in each terminal node works well for this very large sample, and there is no practical advantage in growing trees which are deeper than this). While a single decision tree can provide a good model of the data, the predictive accuracy of the model can be improved by aggregating the results of many trees (two hundred in our case), each estimated on a bootstrapped sample, which provides a predictive model with less variance than considering just one tree. As each bootstrap sample leaves some observations outside of the sample, a cross-validation exercise can be automatically performed, which means random forests also offer protection against over-fitting the data. Additionally, this bootstrapping process allows the estimation of standard errors for our measures.
The RF model has a number of advantages compared to traditional linear models given the nature of our data. First, random forests automatically take into consideration possible nonlinearities in the data, which in problems with many variables, each with a large number of categories, would be impossible to do in a systematic way using linear regression. Our data is especially complex, featuring a mix of continuous and categorical variables, some with hundreds of levels, which makes this problem especially salient. Second, RFs have the advantage of producing a simple measure of variable importance, which summarizes the total effect of one variable on the outcome, across all of its interactions and other nonlinearities, and allows to test for the overall significance of the variable independent of any functional form assumption. This again is useful for the problem at hand, as we are interested in the degree to which various predictors are meaningful explanatory factors of the diversity outcome independent of any linearity assumption. Third, in order to gain insight into the behavior of each variable in the model, random forests can generate a plot of its average partial effect, which is similar in nature to those obtained from traditional linear models. This allows for easy interpretation of the direction and magnitude of its marginal effect. As a robustness check, appendix 6 presents the main models estimated using linear regression, and assuming a simple additive functional form. These results are similar in substantive terms to the ones from random forest models, offering reassurance that the findings are not an artefact of the statistical tools.
The first set of estimates come from models in which the diversity dependent variable is defined in terms of repeated interactions. The full dataset contains separate entries for each transaction i, between firm f and authority a. The dependent variable for all transactions between f and a is therefore the total number of transactions between them recorded in the sampling period. As this relationship-level outcome does not vary among the component transactions, it creates dependence between the data points, which may affect the precision of our estimates.Footnote 26 Adler et al. (Reference Adler, Potapov and Lausen2011) propose as a simple solution to this problem, in the context of random forest models, sampling one data point among those with a common dependent variable, in this case a single transaction.Footnote 27 Models will therefore be estimated on a dataset resulting from such random sampling of one transaction per f-a relationship.Footnote 28 For the number of matches to capture our understanding of diversity, it needs to be conditioned on the total number of transactions that both f, and respectively a engage in in the sample, as larger authorities and larger firms may interact more frequently simply due to size. Therefore these two quantities, denoted firm award count and authority award count, are always included among the predictors. As all three variables are right-skewed, they are transformed through a natural logarithm.
A second set of results will use the geographical distance between buyer and seller as a dependent variable, instead of the number of matches, while using the same set of predictors. One transaction per f-a relationship is sampled here as well, with the same justification. The log distance between the cities recorded for the buyer and seller in each transaction is computed and used as a dependent variable in these models. The discussion and justification for the modelling choice here is the same as for the first set of models.
In the following, the predictors used in the models are listed, and table 2 summarizes them. The first group includes structural and economic factors that are not immediately connected to the argument outlined in the theory, and therefore, for the most part, serve as competing explanations.
1. The common procurement vocabulary (CPV) code of the transaction. EU contracting rules ensure that a fine-grained systematic description of the good or service being transacted is available. These codes are hierarchical in terms of detail: the first two digits indicate forty-six main areas, such as agricultural products or construction work, and additional digits provide increasing detail. The level of detail is limited to three digits for the RF models, as in many cases, digits beyond this are all zeroes, corresponding to no information being provided. This three-digit CPV code provides 317 unique categories in which the object of the contract award can fall. A strong predictive effect is expected from the variable, as differences between markets in terms of concentration and diversity are likely to be significant.
2. An indicator for whether the good is a service, physical good, or public works project. This complements the CPV variable by helping further classify the nature of the transaction.
3. The type of authority making the acquisition. The data allows eight categories for this variable, with the major distinction being between the central government, local government, and public bodies, such as utilities.
4. The size of the contract award, in euros. All else equal, smaller contracts should favor more repetitive pairings, because the same amount of expenditure is now divided among multiple matches. Because of this, models should always include this variable as a control, and moreover, as a robustness check, the main empirical model is also re-run on data that has been weighted by the contract award value.
5. Framework agreements. These are complex procedures in which an agreement for a possibility of future purchases is made. Future purchases are not counted separately in the data.
6. Subcontracting likely. This indicates whether parts of the contract may be subcontracted.
7. Procurement agency. This indicates whether the buyer is a procurement agency that is a government organization specialized in procurement that acquires goods and services on behalf of other government entities.
Descriptions of dependent and independent variables.

The following set of predictors includes variables that are useful, to various degrees, for testing the governance and transaction-costs argument presented in the theory.
8. The country the transaction takes place in. This fixed effect captures all country-level predictors of the outcome that are not included in the contract-level model. In order to estimate whether well-governed and developed jurisdictions feature higher average levels of diversity, we can check the distribution of predicted country effects, as well as formally estimating the connection between these country effects and an indicator of the quality of governance.
9. The procedure for publicizing and awarding the contract. There are ten possible procedures available under EU legislation. The sample is dominated by the “open” procedure type, which indicates a regular process in which a call for tenders is publicized and firms are then free to submit bids. A few other possibilities are especially problematic from a governance perspective, especially the awarding without publication and the two accelerated procedures.Footnote 29
10. The number of offers. A single bidder or a low number of bidders are seen as indicators of problematic transactions by the European Union.Footnote 30
12. EU funding. If part of the acquisition is funded through EU contributions, this is indicated in the data. These acquisitions are expected to feature more diverse ties, as they are less likely to be extractive in nature, due to the increased oversight.
13. The criterion for deciding the winner. The distinction here is between a lowest-price winning criterion and various “most economical offer” criteria, indicating the inclusion of quality and fit considerations. Both procedures can be abused, so it is hard to formulate a prior expectation. By ignoring product specifications, it is easy for suboptimal transactions to take place, under the cover of a low price, but at the same time, quality and fit judgements can be subjective and open to manipulation.
Results
Figure 1 shows the variable importance plot for a random forest model in which the dependent variable is the number of interactions. The plot indicates the increase in mean squared error when each of the given variables is removed from the model, in the sense of being transformed into random noise. Higher coefficients here indicate higher explanatory importance and horizontal bars indicate 95 percent confidence intervals. Due to the very large sample size, all included variables have a statistically significant contribution to the model. However, it is also the case that this criterion is quite weak from a substantive perspective, and effect sizes always have to be taken into account. Overall, the model explains 39.6 percent of the variation in the dependent variable, as measured on out-of-sample data.
Variable importance plot for transaction-count model

Unsurprisingly, the largest effects on the transaction counts are given by the total contract award counts of the buyer and the seller. The other two major explanatory factors are the country variable and the CPV code of the contract award, while other variables have progressively less explanatory power. In the following we discuss the marginal effects of each of the variables in the model. These are illustrated with an average predictive effects graph obtained by plotting the predicted values generated by the model for each value of the variable, while integrating over the sample distribution of the other variables.
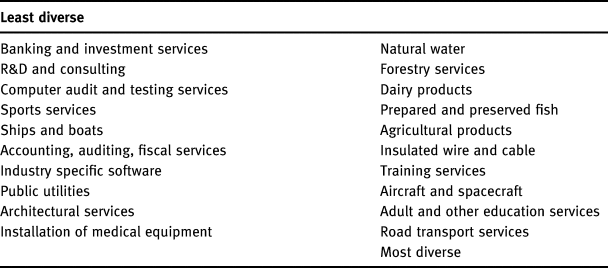
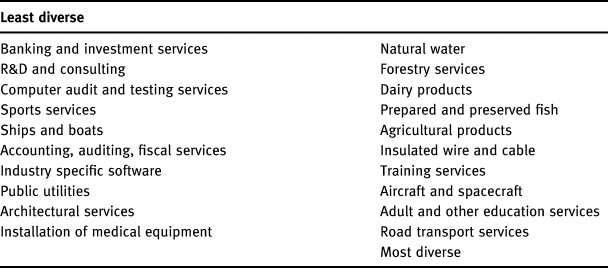
1. CPV code. The overall effect of the variable in the transaction count models, as reflected in figure 1, is very strong. Given the degree of fragmentation of this variable, a full discussion of the patterns emerging among the 317 categories is not practical. However, a sense of its behavior in the model can be had by looking at the most and least diverse CPV codes, as displayed in table 3. (Only CPV codes with more than one hundred contract awards in the dataset are included here, to avoid the least substantively relevant ones). The results suggest that, as expected, the least diverse markets tend to be those for high-tech, high fixed-cost products, such as finance, consulting, IT, medicine, and utilities, while the list of high diversity markets generally includes those with a lower technological barrier of entry. As a complement to these results, Hessami (Reference Hessami2014) points towards high-tech sectors being associated with corruption in a cross-country setting.
Table 3:Ranking of predicted diversity of ties by CPV-3 code, least to most diverse. Only CPV-3 codes with more than one hundred sample entries.

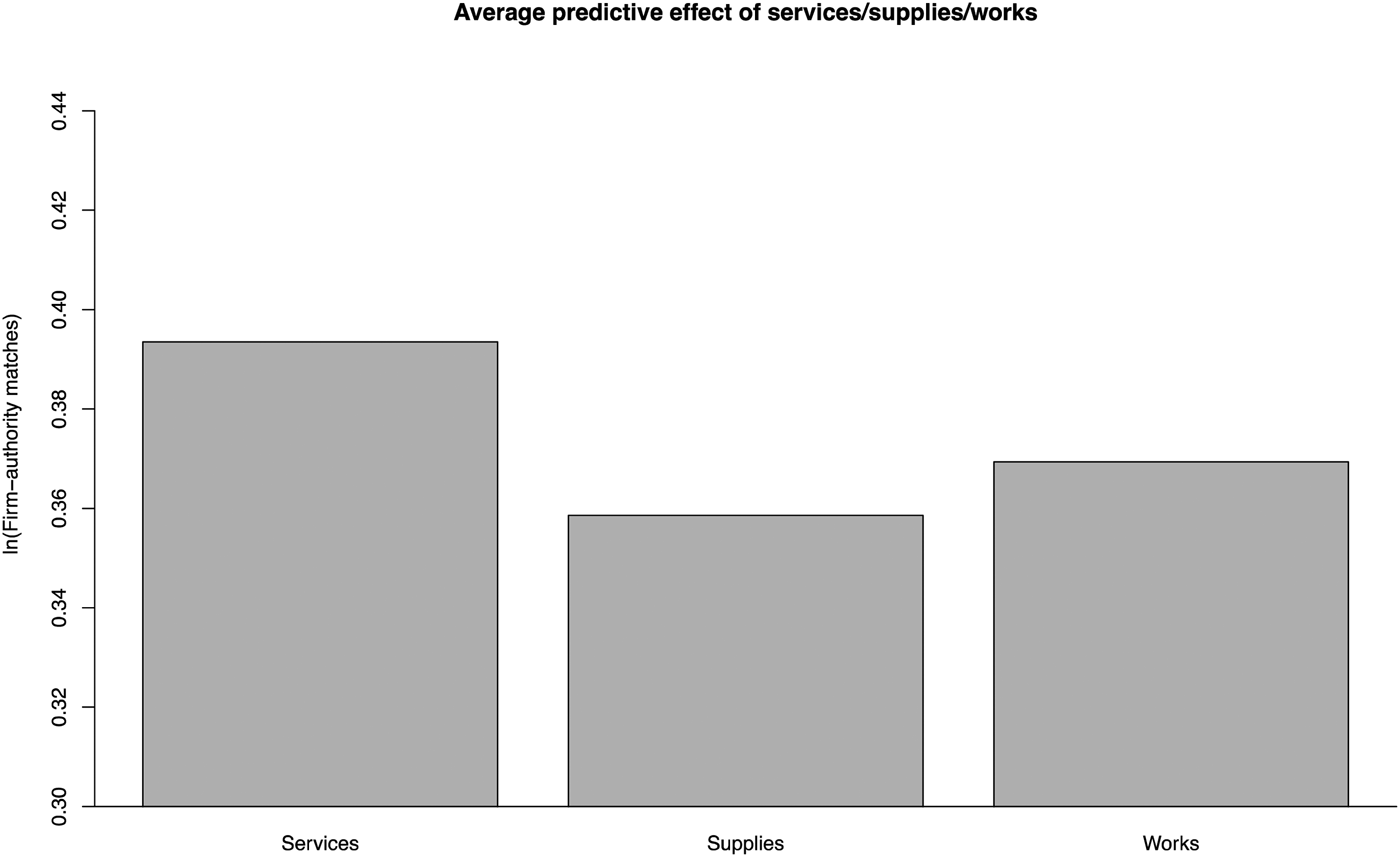
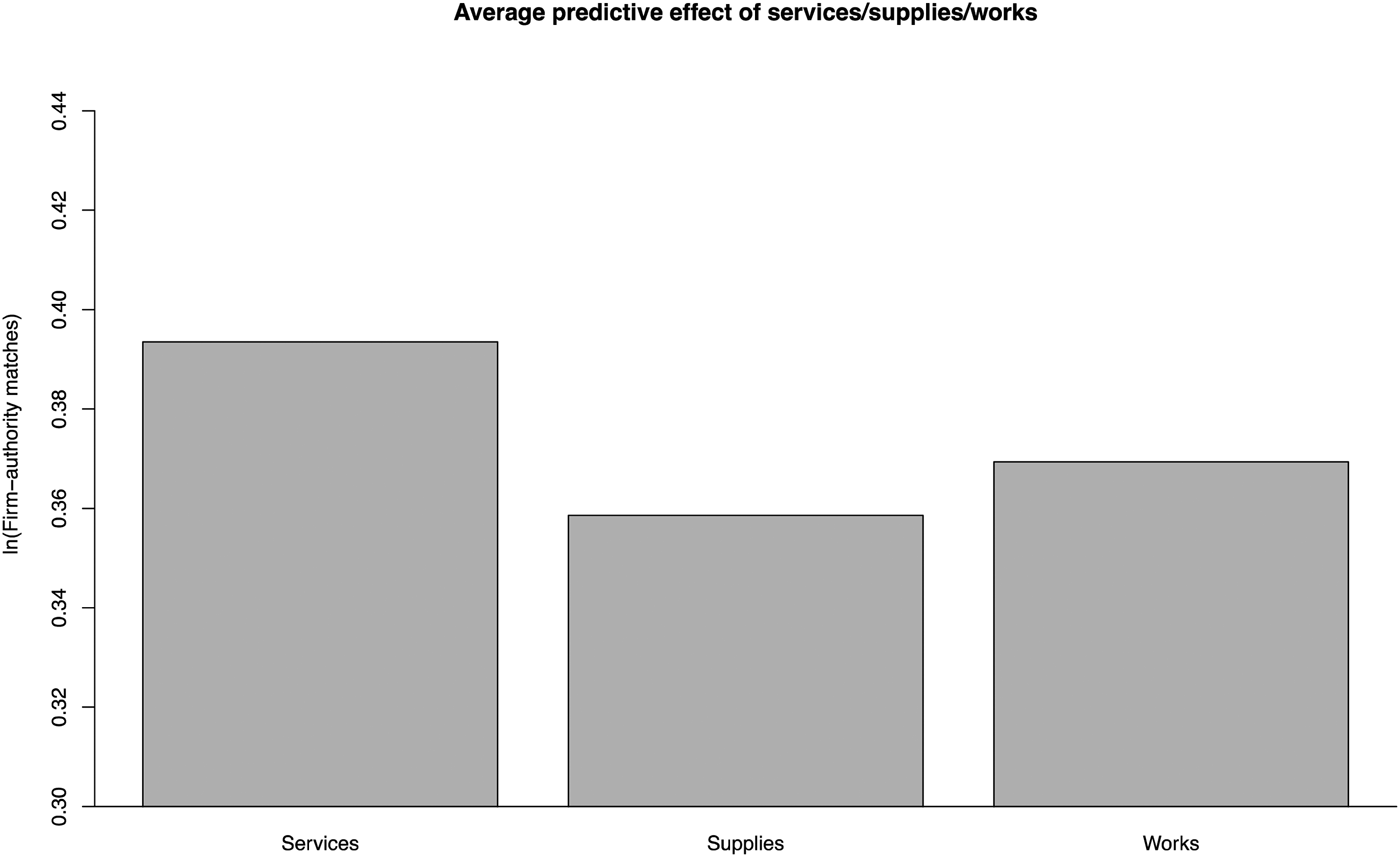
2. Nature of the product. A similar conclusion arises from the services/supplies/works variable. Figure 2 shows that service contract awards predict somewhat higher levels of concentration than for supplies (a difference of .04 log points). This could be due to the more specialized nature of these markets, as opposed to many physical supplies markets, in which resellers for the same product can generate higher diversity.
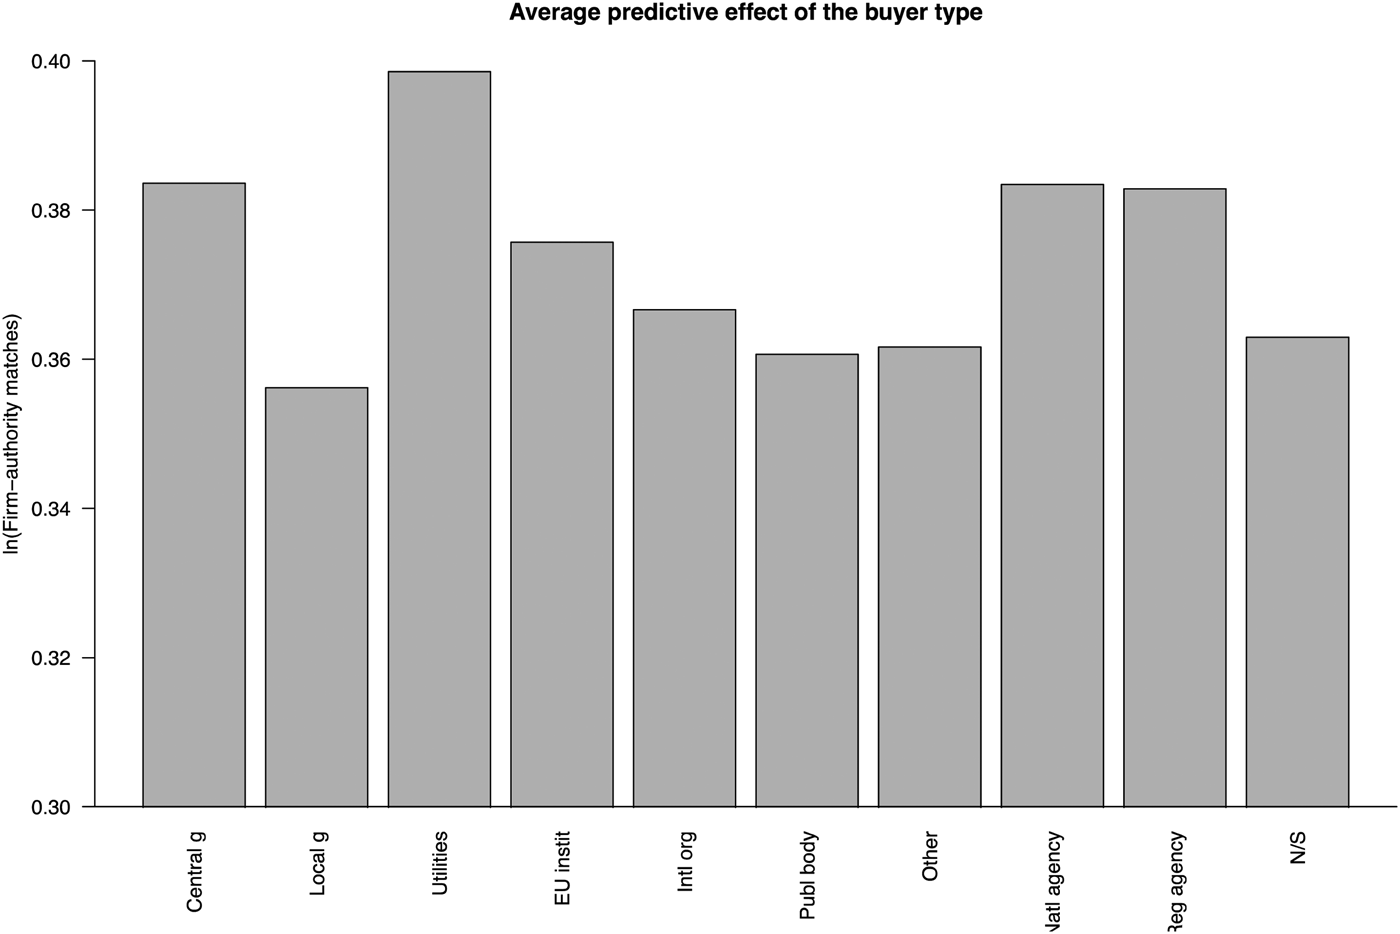
3. The type of authority. The data also indicates a reasonably strong effect of the type of authority figure 3: Local government authorities are somewhat more likely to engage in diverse matches, even after controlling for their likely smaller size, smaller contract awards, and different products. This casts doubt on the idea that local authorities are particularly likely to develop narrow, clientelistic, ties to local firms. Public utilities by contrast show a relatively higher level of concentration. This could receive a number of interpretations: either that they are more prone towards collusive or corrupt behavior, or that the specialized nature of their activities warrants less diverse contracting.
4. The size of the contract award. The effect of the value of the acquisition (figure 4) is as expected. Larger contract awards feature more diverse links, with a difference of .14 log points between the lowest and highest group. One mechanical explanation is that smaller contract awards mean more links being recorded for the same level of expenditure. This will become apparent in the weighted models (appendix 2.2), where the value variable will lose its substantive significance.
Figure 2:Predictive effect of the type of transaction
Figure 3:Predictive effect of the authority type
Figure 4:Predictive effect of the award value


The three remaining variables (framework agreements, subcontracting, and the use of a procurement agency), are of a more technical nature, appear to play only a minor role in the predictive model, and will not be analyzed further.
The following variables can be interpreted as evidence towards the validity of the theoretical view connecting socially undesirable outcomes with undiversified ties. The strength of evidence from each of the variables will naturally vary, and the interpretation needs to be commensurately careful.
8. The country indicator.
The effect of the country variable is striking: not only are the differences substantively large (more than .26 log-points between the smallest- and largest-value countries), but the effects map very closely to prior expectations regarding the connection between undiversified ties and environments with poor governance. The intuition can be confirmed with a regression analysis at the country level (Table 4). The country coefficients from figure 5 are natural indicators of the prevalent diversity outcomes at the level of each country—they identify the average level of diversity for each country, while keeping the influence of other variables constant. This outcome can be regressed on a widely-used country-level measure of governance quality—the Quality of Government EQI score from 2013,Footnote 31 to estimate the effect of the governance environment on average diversity outcomes.Footnote 32 For this approach to be valid, we have to assume that any measurement error arising in the country coefficients is random or at least orthogonal to the predictors used in the regression models. If this is the case, then the regression coefficients are unbiased, and any measurement error in the dependent variable translates into larger standard errors on those coefficients.Footnote 33 To protect against heteroskedasticity arising from distribution of the country coefficients, robust standard errors will be used in the regression models.
Linear regressions predicting the country coefficients. P-values in parentheses.

Predictive effect of the country

The predictive effect in the first model is substantively large—moving from the lowest to the highest score predicts an increase of .15 log points in the country average—and strongly significant. Adding a measure of economic development to this model allows us to distinguish between the effect of transaction costs arising from governance quality versus simply low income. When adding the logged GDP per capita as a control in model 2, the results are still significant at the .10 level, and the GDP/capita measure is completely non-significant. This suggests that the nature of the process generating the country effects has to do with the governance environment, independent of the level of development. Model 3 adds as a control the natural log of the population, to account for the possibility that larger countries may generate more diverse matches through purely mechanical effects, and this makes the governance variable strongly significant once again.
9. The procedure type. This variable has a surprisingly small contribution to the explanatory model, as can also be seen in the variable importance plot in figure 1. The suspicious accelerated and no-publication procedures do not predict less diversified ties (results in appendix 2.1). The variable, by contrast, will have a stronger effect in the distance models to be presented in the next subsection. A possible explanation is that due to the highly suspicious nature of non-open contract procedures, they are avoided by agents intent on misbehaving. Indeed, the crosstab of this variable and the country indicator shows that the poorer-governance new EU member states overwhelmingly use the open procedure for most contracts. If this happens, in equilibrium the variable will not show meaningful connections with other results of poor governance, such as undiversified ties.
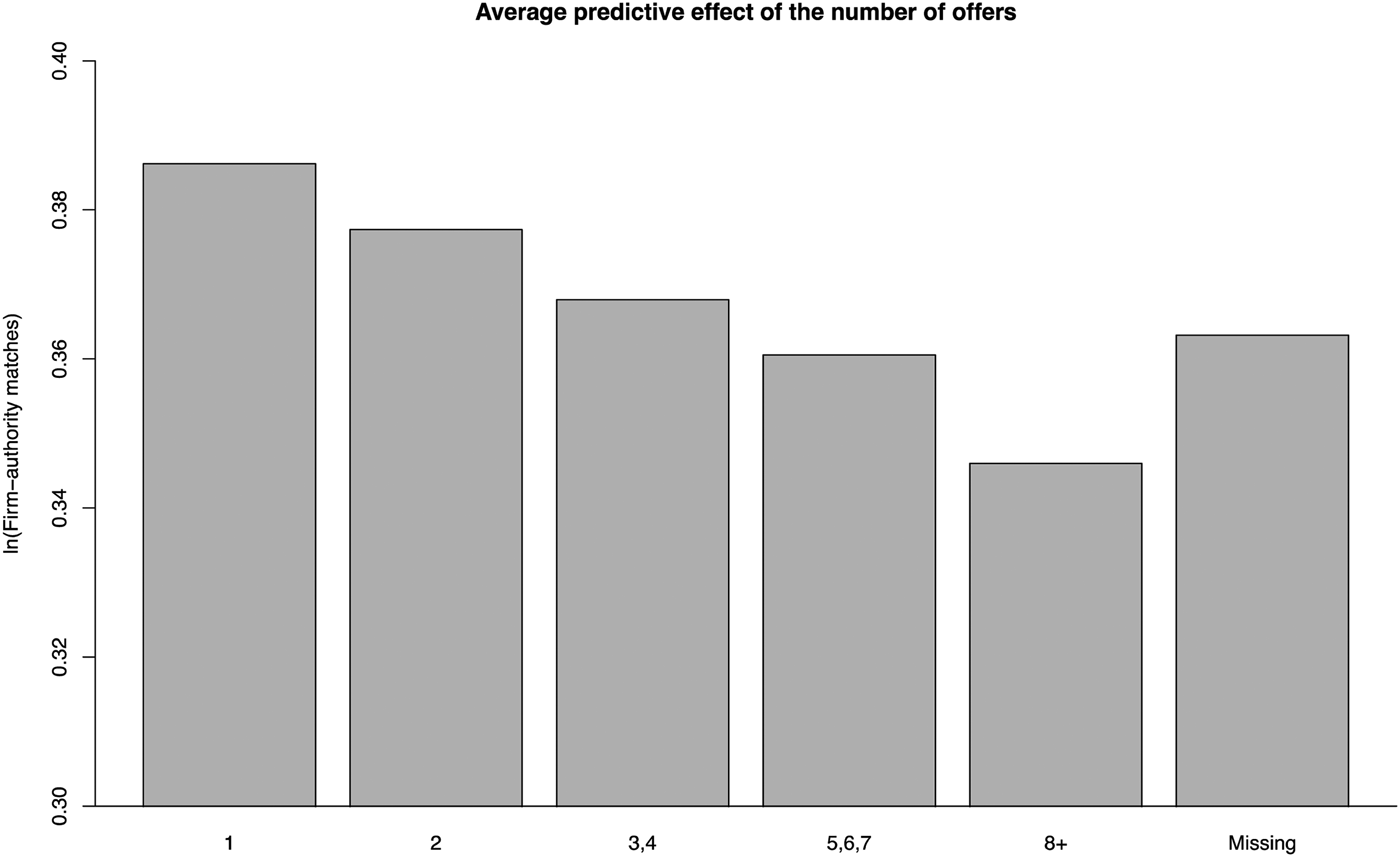
10. The number of offers. More competitive contract awards predict more diverse ties, with a difference of .03 log points between single-offer and 8-plus offer bids (figure 6). On the one hand, this pattern could simply indicate that lower competition in a market will naturally lead to less diverse pairings, as fewer choices are available for buyers. On the other hand, many structural factors that would determine the competitiveness level, such as the nature of the market, the contract award size, and the total number of transactions for buyer and seller have been controlled for, so what is identified by this variable is competitiveness that is not due to these immediate economic determinants. A low number of bidders is considered an indicator of an inefficient procurement process by both the European Commission (2016) and by the academic literature,Footnote 34 and is a natural result of a setting in which the existence of a favored supplier is presupposed by market participants. Under this interpretation, these potentially extractive transactions should predict less diversified ties, which is indeed the case in the data.
Figure 6:Predictive effect of the number of offers
11. EU funding. The indicator for EU funds has a minor contribution to the explanatory power of the model, but does behave as expected (illustration in appendix 2.1). Projects, which are funded by the European Union and are therefore likely subject to more outside scrutiny, do indeed predict slightly more diverse ties.
12. The criterion for deciding the winner. The predictive effect of the criterion for deciding the winner is also illustrated in appendix 2.1, in which lowest-price contracts predict more diversified ties. Given that both options have a theoretical potential to be used for extractive purposes, it is difficult to interpret this finding other than in a descriptive manner.

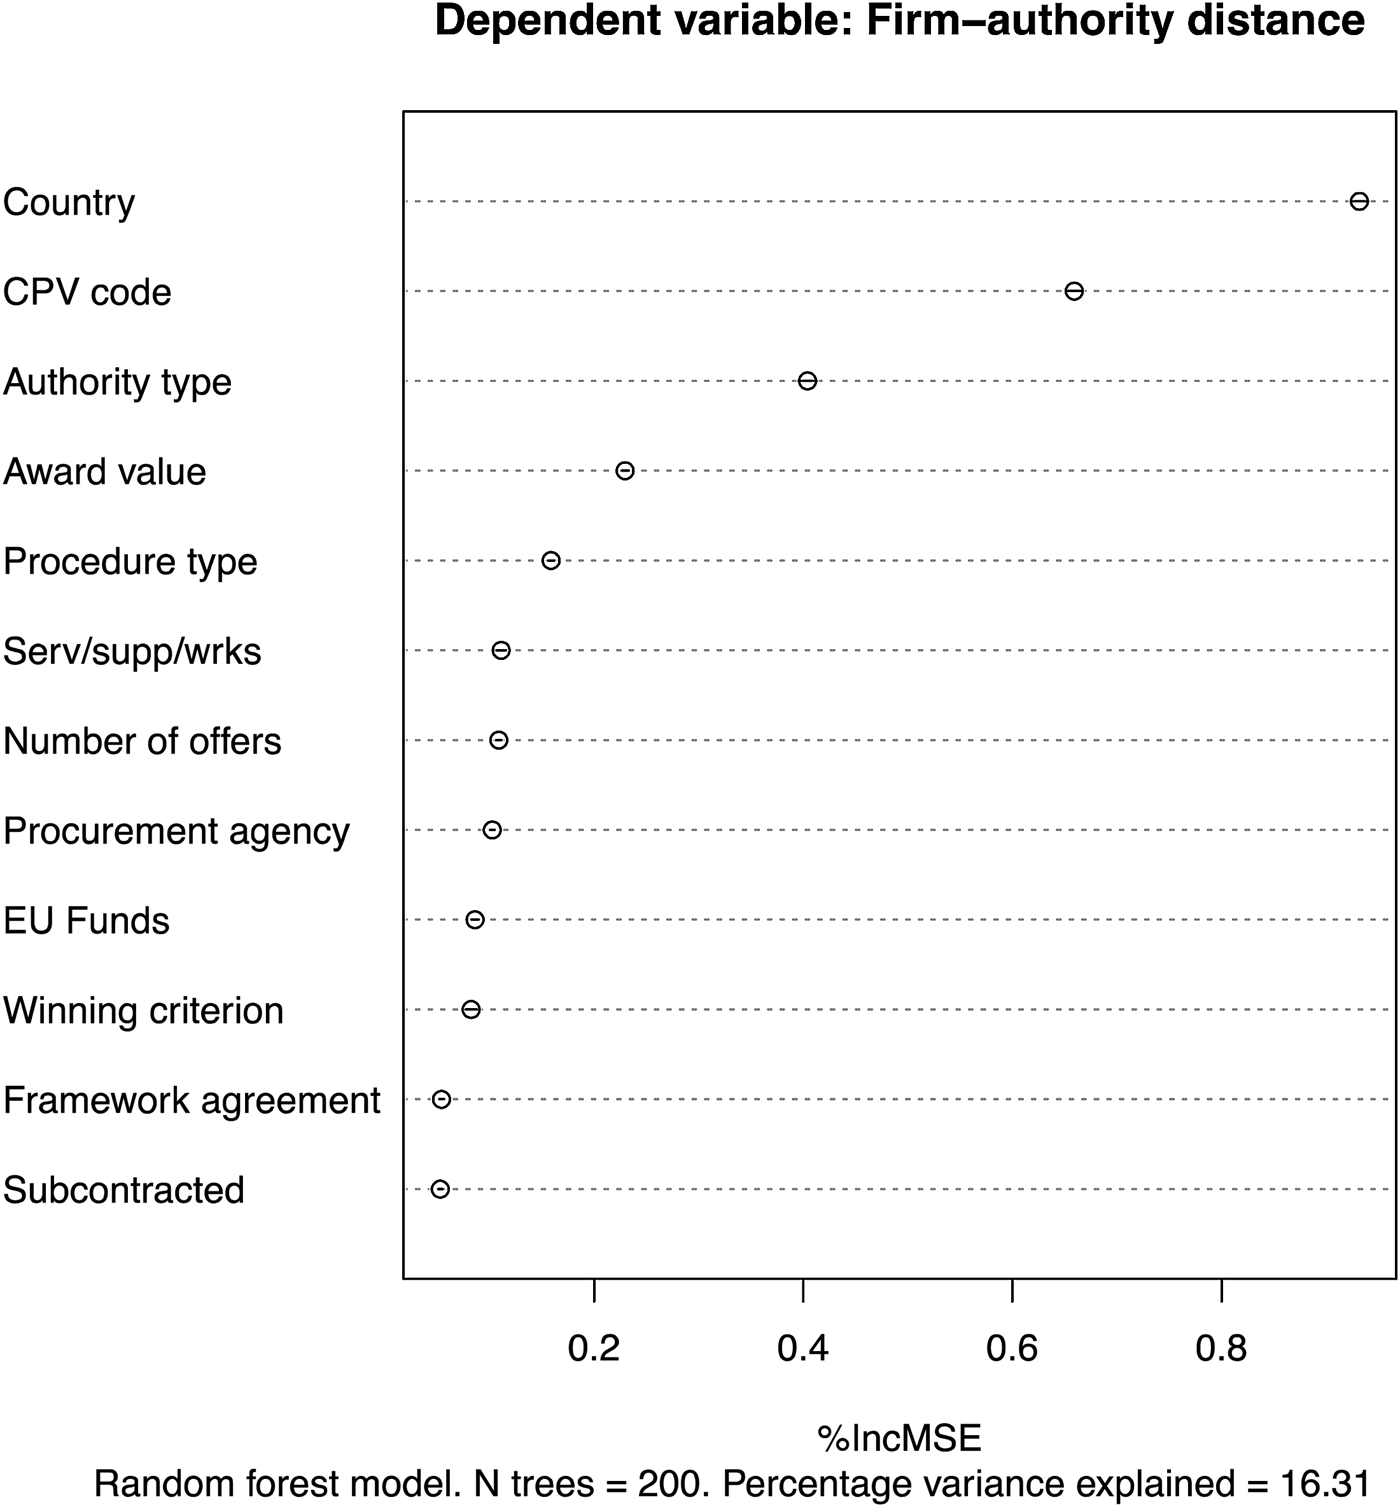
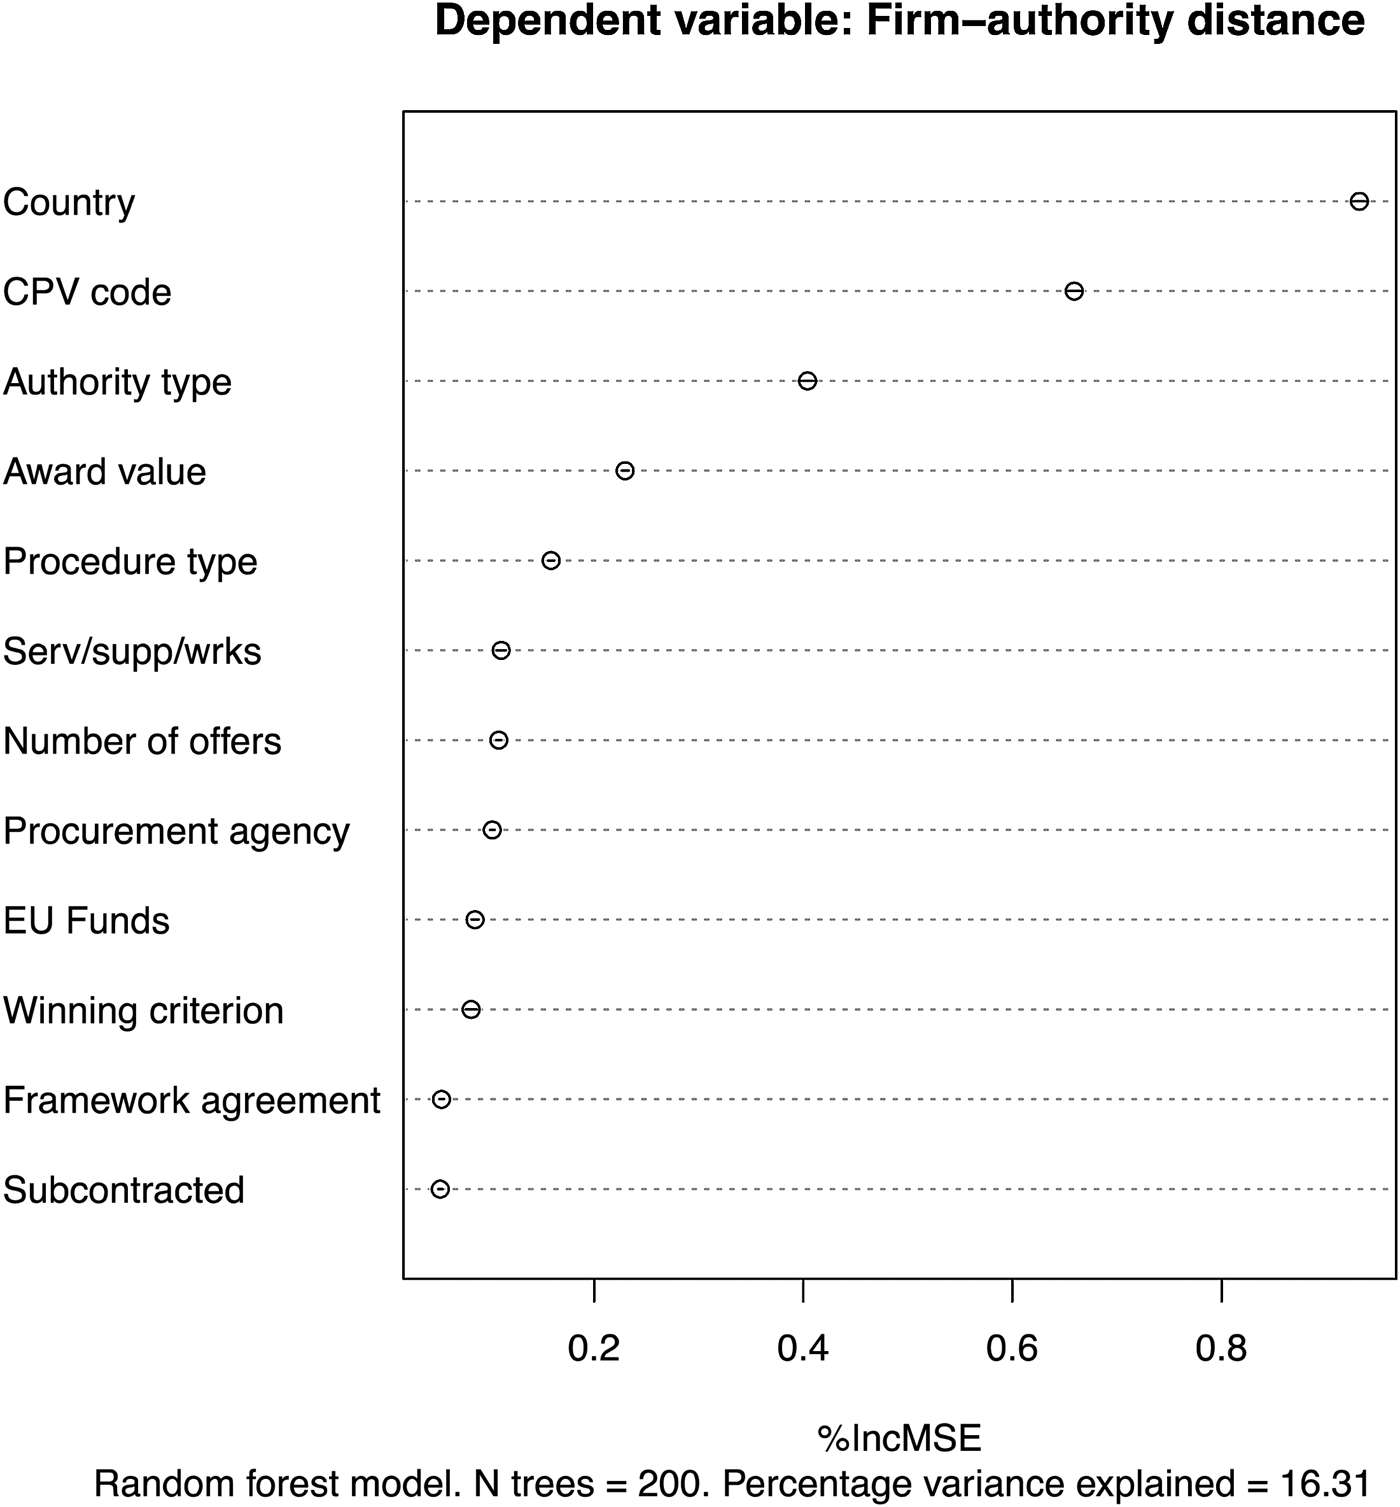
The following presents results on the geographical models. The presentation is more abbreviated, with only the most important variables being discussed here. The order of the variables and their indices are the same. Figure 7 presents the variable importance plot for these models. The relative importance of the variables is very similar to the first explanatory model, suggesting that the mechanisms at work should be similar, and this will be confirmed by analysis of the individual predictive effects.
1. The CPV code. Table 5 displays the largest and smallest predicted values for the CPV indicators. In the case of the distance outcome, the technical characteristics of the market again seem to be very important: while the lowest-distance markets include lower-tech and highly localized services, the long distance markets are generally those for specialized products, such as medical equipment.
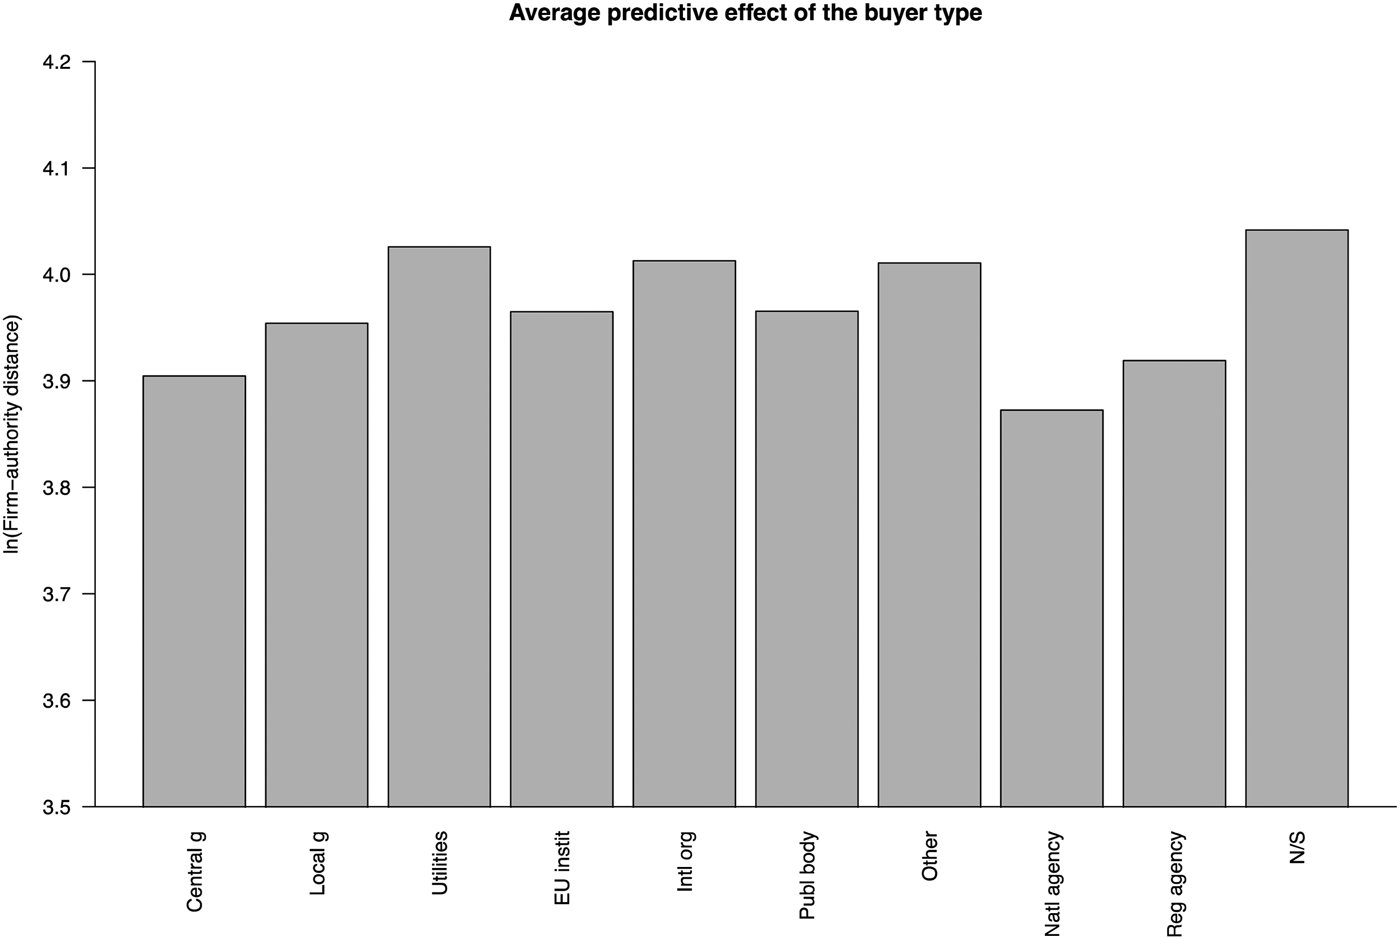
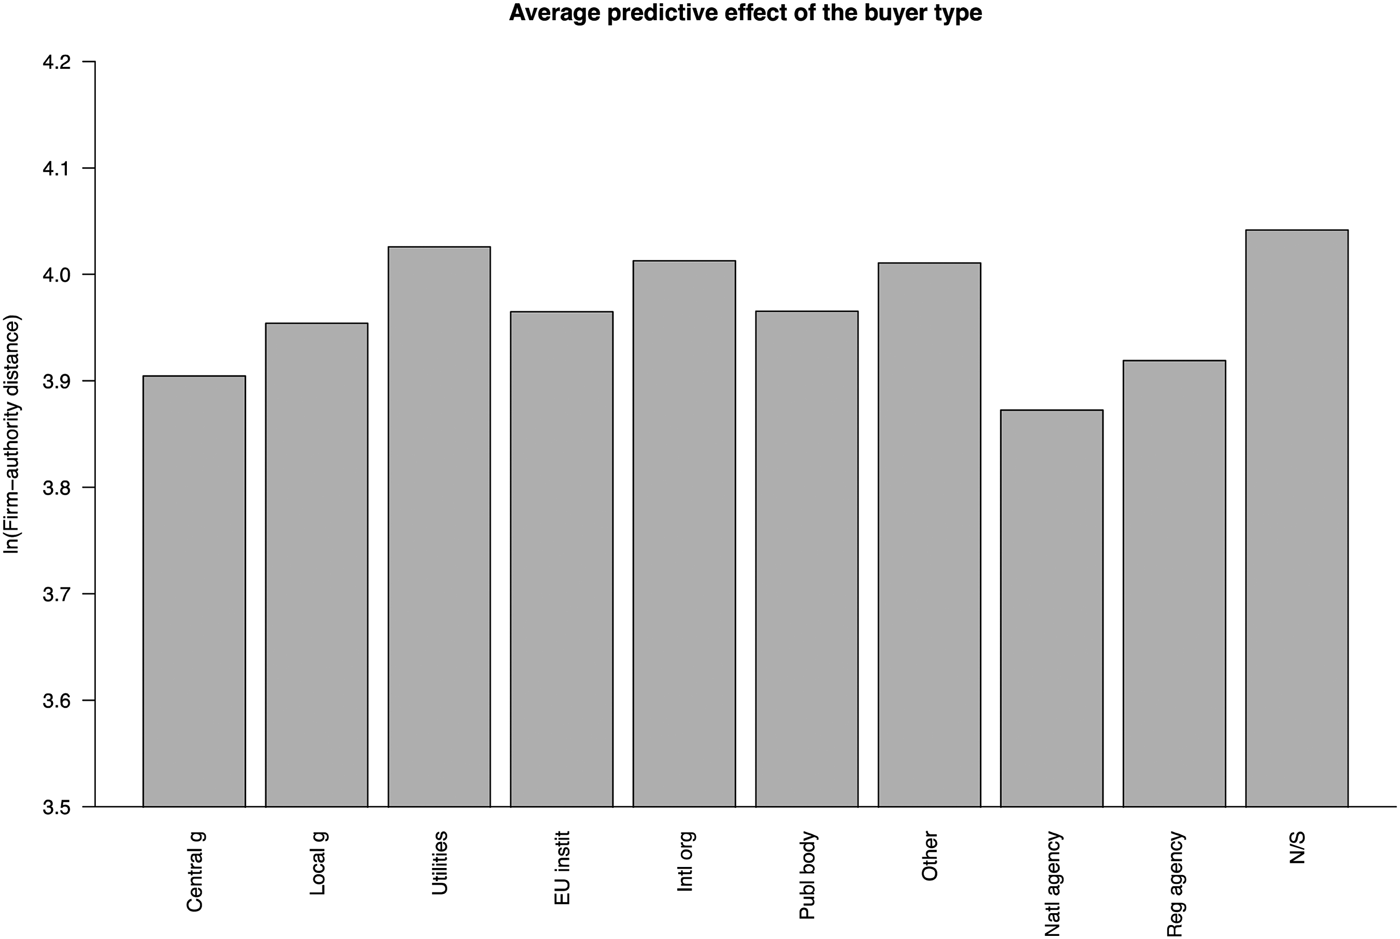
3. The type of authority. Figure 8 shows that central governments and agencies tend to make acquisitions from less distant sellers than either local government or the other types of sellers (a difference of .10 log points between central and local government). This may indicate that much of the buying by the central government will take place in the capital city, where many suppliers will be located, and shows that a hypothesis, according to which local governments develop clientelistic relations with nearby suppliers, is not immediately supported by this data.
Figure 7:Variable importance for distance model
Figure 8:Predictive effect of authority type in distance models
Ranking of predicted buyer-seller distance by CPV-3 code, closest to farthest. Only CPV-3 codes with more than one hundred transactions.

The next set of predictors can be used to test the logic of the theoretical argument, this time under a geographical interpretation.
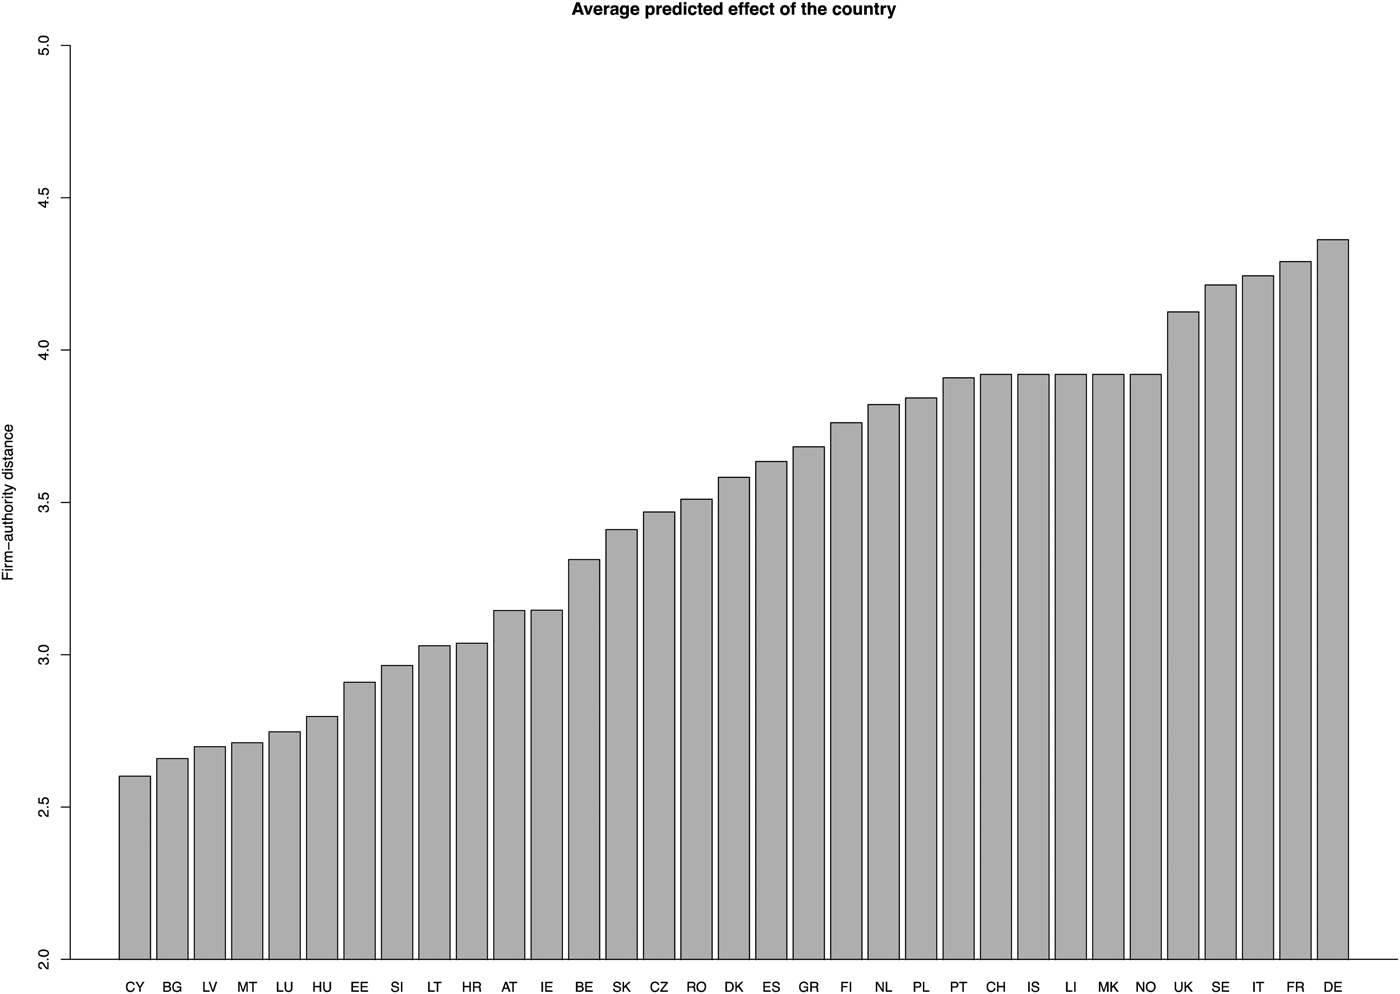
8. The country indicator. Interpreting the effect of the country indicators in these models is not as straightforward as in the previous model. A large component of the country effect will be given by the size of the country, which may not be of immediate theoretical interest. However, even so, the predictive effects in figure 9 are highly suggestive. Table 6 presents results from regression models in which these country coefficients are the dependent variable. To interpret the connection between the governance indicator and predicted geographical diversity, controlling for the area of the country is necessary—while the bivariate model is only marginally significant, once the size is accounted for, the positive connection once again becomes strongly significant. Adding the control for GDP per capita makes the EQI score non-significant, so it is not possible to clearly distinguish between the effects of the two. However, in this case as well, there is evidence of a positive connection between environments with better governance outcomes and geographically more diverse matches.
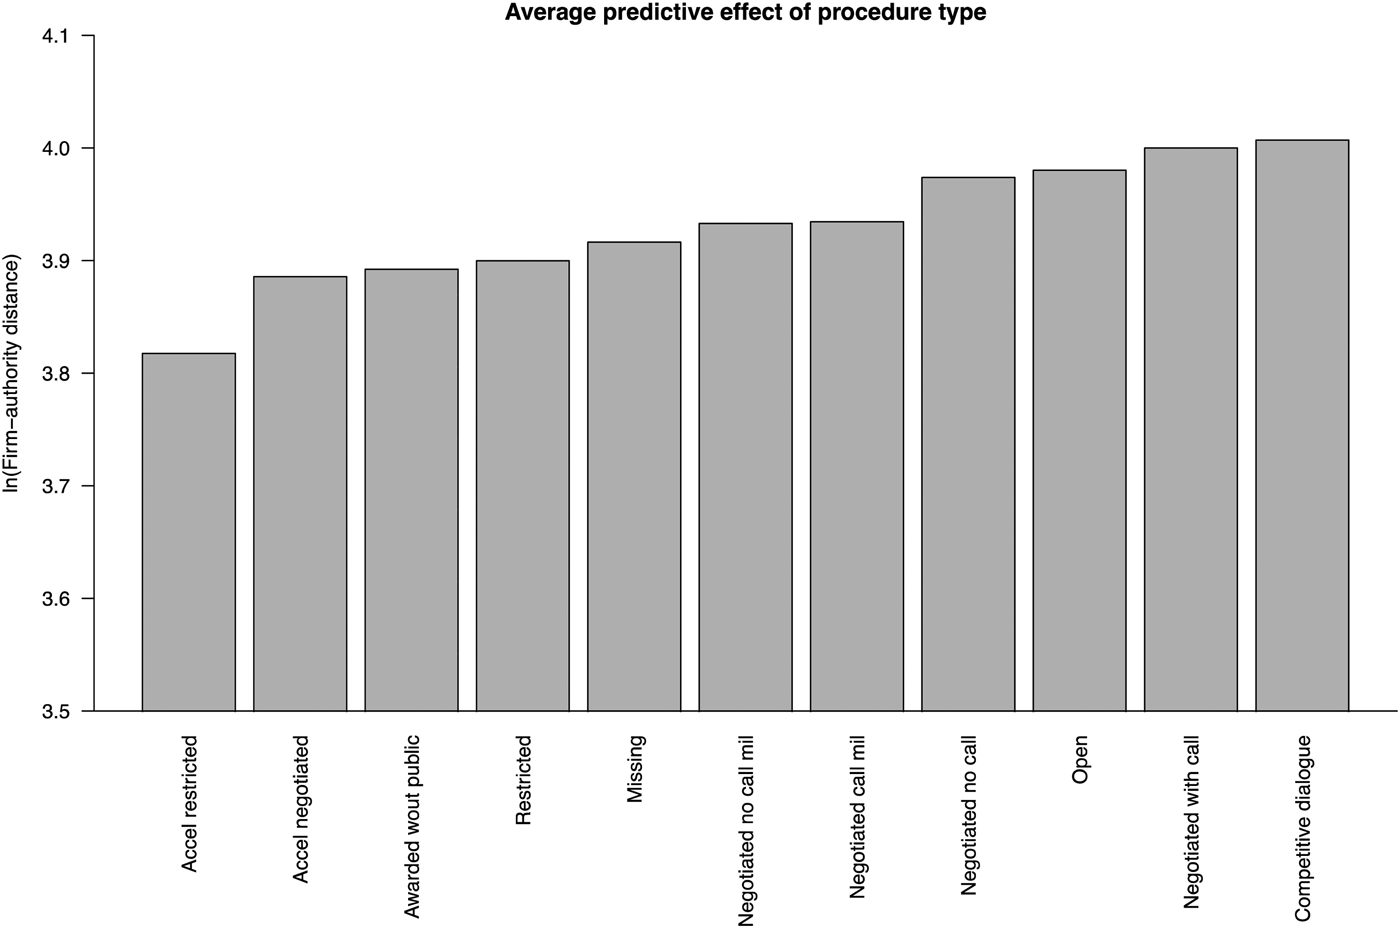
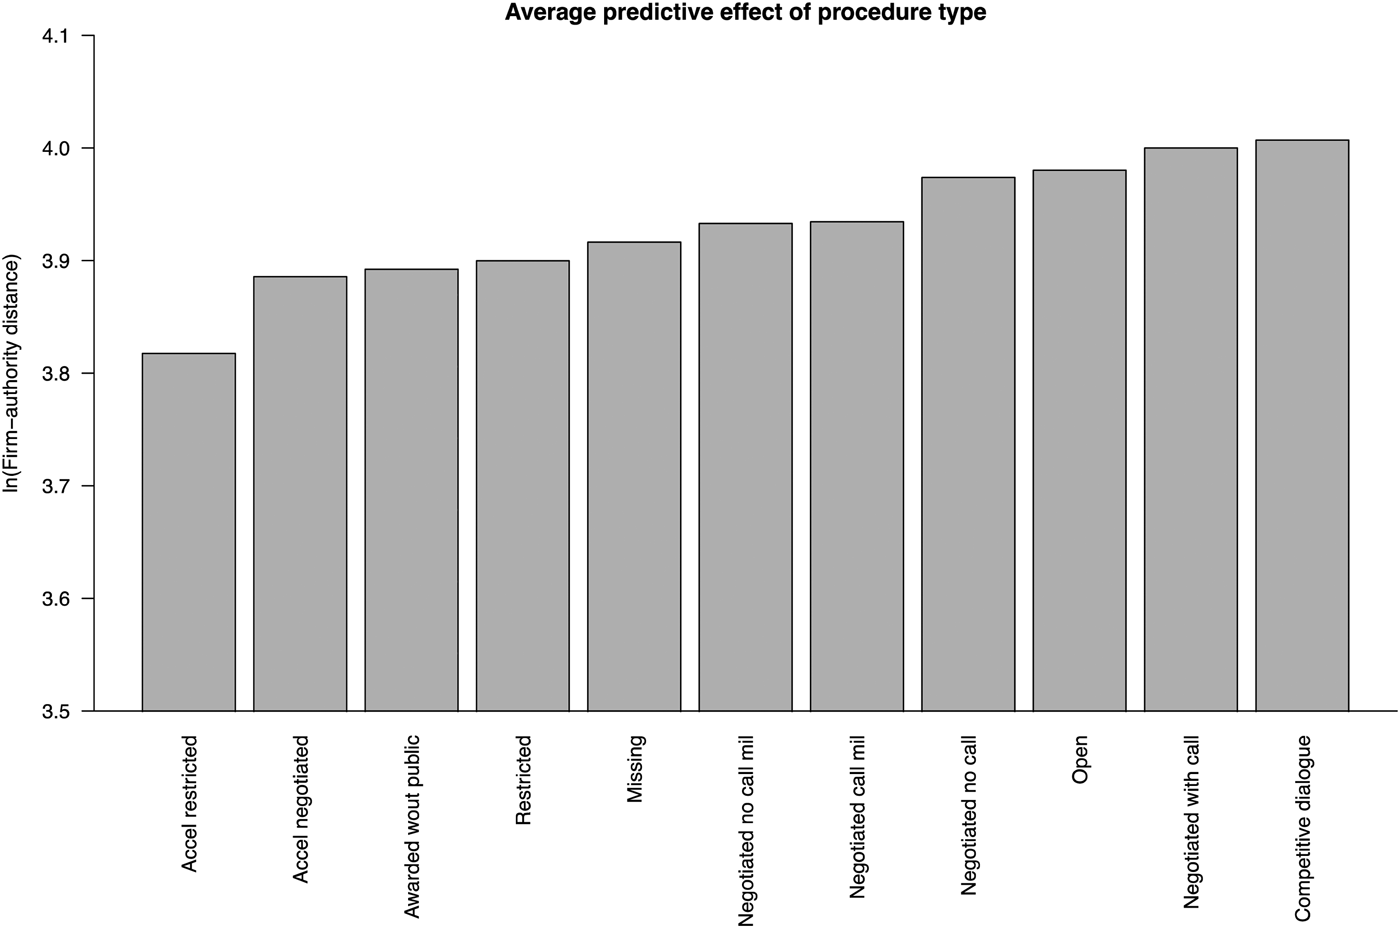
9. The procedure type. Figure 10 shows that the procedure used has a substantively large predictive effect on the distance measure, with a difference of .18 log points between the smallest and the largest predicted value. Unlike in the case of the contract award-count dependent variable, here there is a trend for the less transparent, less competitive procedures to predict more localized buying. The especially suspicious accelerated, awarded without a call, and restricted procedures are the most localized, while the open procedure is among the most geographically dispersed. The most dispersed procedure, competitive dialogue, tends to be used mostly in the United Kingdom. These results suggest that procedures suspected of promoting noncompetitive outcomes are indeed predictive of a lack of geographic diversity. The difference between these results and the ones for the procedure variable in the acquisition count models, where the procedure variable showed no meaningful patters, is a puzzle. One explanation could be that while the suspicious nature of non-open procedures leads to their avoidance in transactions with favored sellers, this does not affect transactions that are undiversified in the less obvious way of having low geographical diversity.
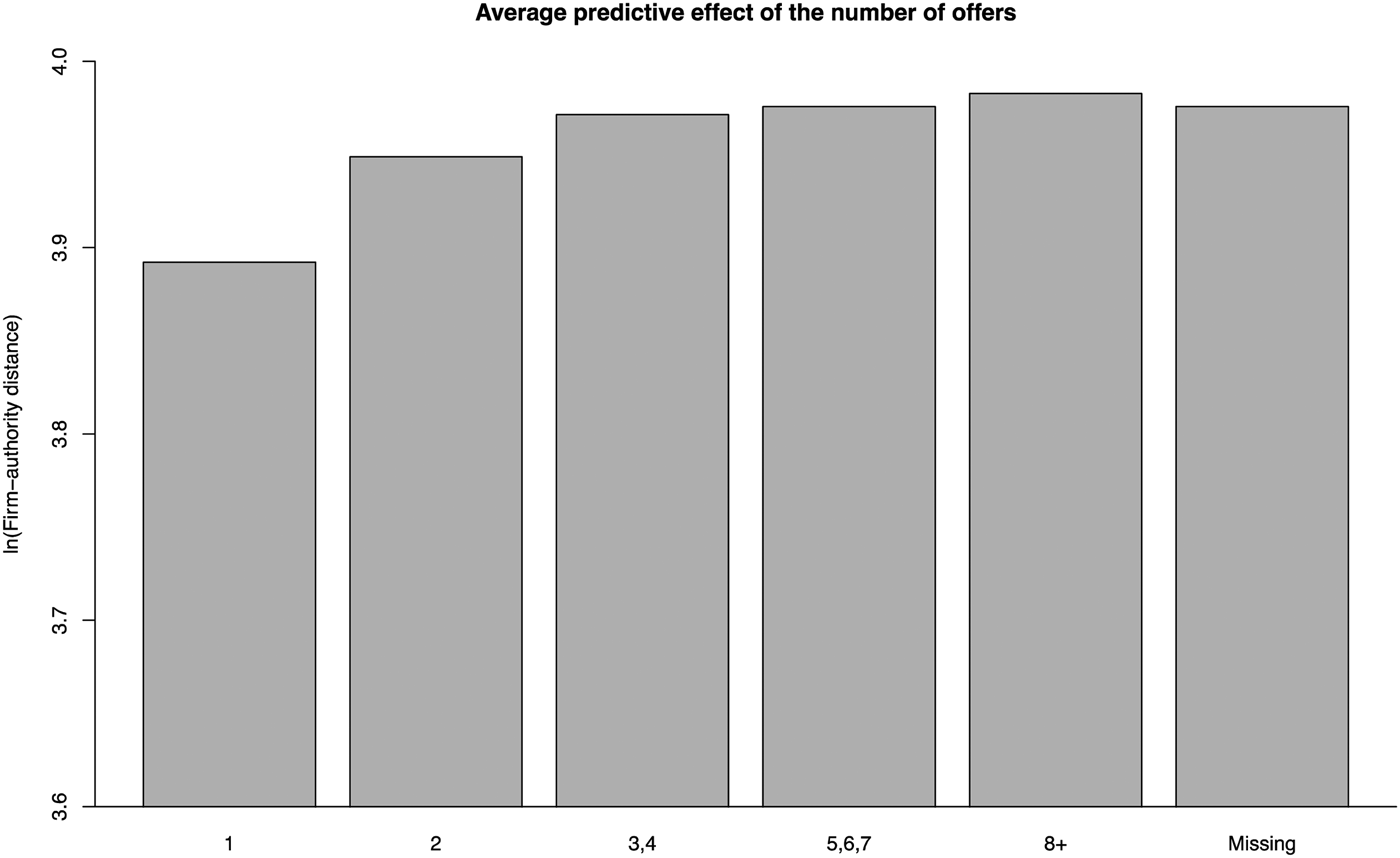
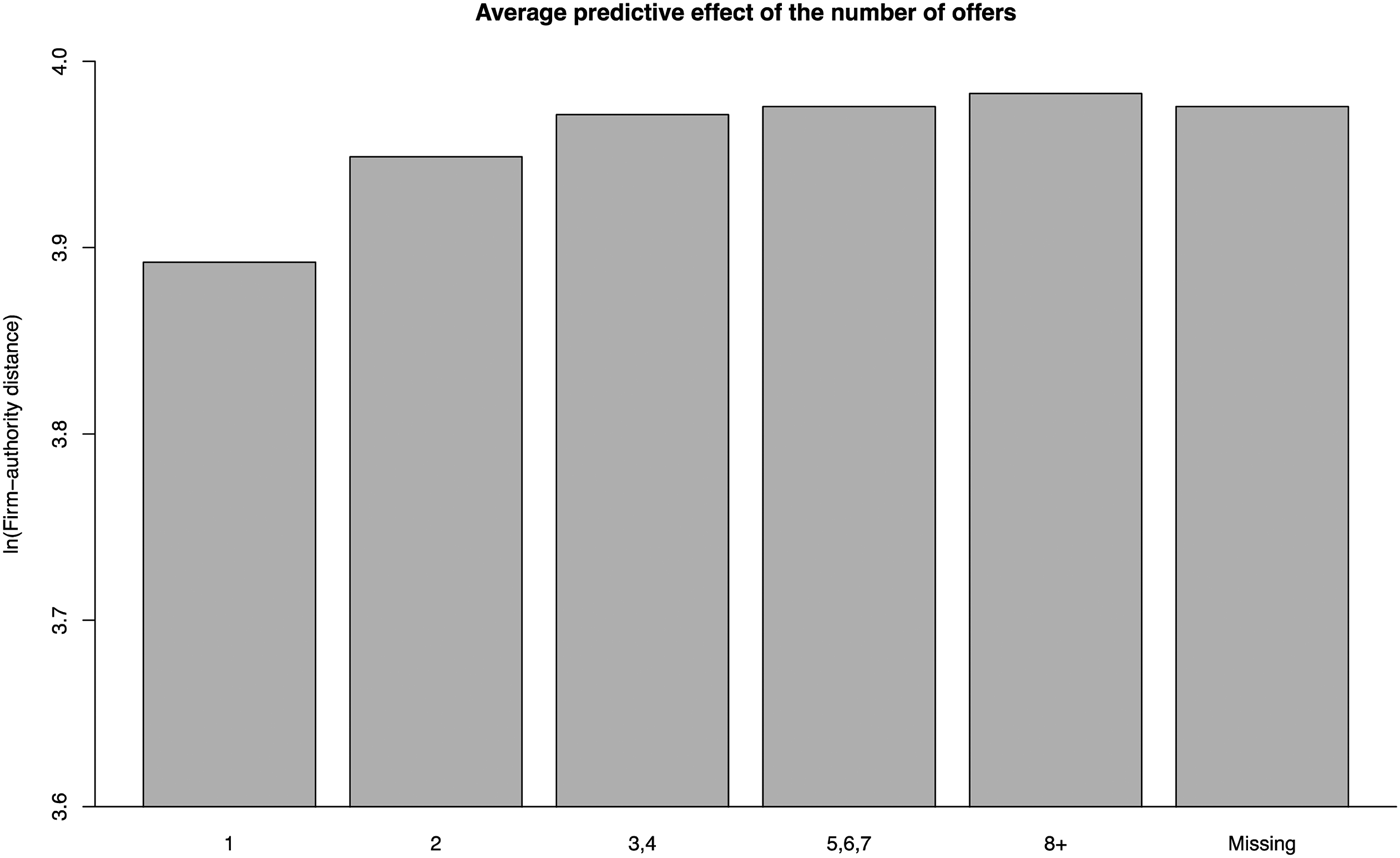
10. Competition. Figure 11 shows that a more competitive bidding process predicts longer distances. This, again, could be because more bidders mean a higher chance for a distant bidder to be selected, but given that many of the structural determinants of distance have been adjusted for, may also be indicative of a process in which inefficient and potentially extractive, transactions predict less geographically diverse ties.
Figure 9:Predictive effect of the country in distance models
Figure 10:Predictive effect of the procedure type in distance models
Figure 11:Predictive effect of number of offers in distance models
Linear regressions predicting the country coefficients. P-values in parentheses.

The other variables again have limited effects so they will not be discussed further.
The appendices present further robustness checks on these results. A first check is given by models in which contract awards are weighted by their value. This is useful in contract award count models as an alternative strategy to controlling for the transaction value in order to ensure like-for-like comparisons. The results from the value weighted models are presented in appendix 2.2, and are very similar to those from the unweighted models. Naturally, in these models, contract award value loses its predictive value for the dependent variable.
A second robustness check comes from considering only contracts with total values above the mandatory-inclusion thresholds, to avoid any potential bias arising from differential inclusion of contracts below the thresholds. (Note that the lower value, by itself, is not the issue here, as it is controlled for). The results in appendix 5 are very similar in nature to those on the full sample, indicating that any bias arising from this is not substantively important. A discussion for why identifying the contracts, which are truly voluntarily published, is difficult is also included in the appendix.
Appendix 2.3 also presents results from the main, unweighted transaction-count models, from samples in which the identities of the firms and authorities are clustered using different cutoff criteria. The variable importance plots of the two supplementary models are almost identical to the results in the body, and the predictive accuracy is slightly lower, as would be expected if more random noise is present. The predictive effect plots for the country indicators are substantively almost identical to the main results as well, as is the case for the other variables (output available in replication materials). From this it can be concluded that the sensitivity-specificity tradeoff of the clustering algorithm does not meaningfully affect the substantive results of the analysis.
Discussion
This article has argued that the structure of matches between public and private actors is indeed connected to governance outcomes. The most important finding is that, even after substantial covariate adjustment, significant differences exist between countries in terms of the predicted diversification of ties between public and private actors, in both contract-count and geographical models, and that these differences are connected to governance quality. This validates the basic theoretical expectation that less diversified ties should be connected to poorer governance. Beyond this, there is some support for the idea that other, transaction-level, indicators of socially undesirable outcomes, which have been previously identified by the literature, such as low competition, non-open contracting procedures, and lack of EU oversight, are also connected to less diversified ties. Taken together, these results suggest that repeated and geographically close ties between public authorities and firms may emerge when actors are engaging in corrupt or otherwise socially undesirable behavior, and in their turn may favor such undesirable outcomes.
The results also show that some structural and economic features of the contract are connected to undiversified ties. From a practical perspective, the results suggest that contracts for high-tech products, awarded by central governments or utility companies and of low value, are more prone to the development of undiversified ties. In as much as we believe such undiversified ties then foster inefficient outcomes, this indicates these kinds of contracts should receive increased oversight. Moreover, the findings suggest that geographical proximity behaves in much the same way as repeated interaction for all of these connections.
The conclusions of a line of work on the governance of illicit transactions exemplified by Lambsdorff (Reference Lambsdorff2002) and DellaPorta and Vanucci (Reference Della Porta and Vannucci2004) point in the same direction as this article, but the results here suggest that many questions are still unpursued. How, for example, should we understand the behavior of structural and economic determinants of undiversified ties (such as the nature of the product) with regards to governance outcomes? Are markets, which are structurally less diversified, more prone to rent generation and outright corruption? Are central governments and public utilities, similarly, more prone to such undesirable outcomes? What is the effect of encouraging procurement from small firmsFootnote 35 on the nature of these ties? Beyond this, important questions regarding the geographical aspect of diversity are arguably still open. We have a very solid theoretical understanding of how repeated interaction reduces transaction costs in settings with weak enforcement, but only an intuitive one of how geography may play the same role, and little empirical evidence to guide us.
A question that is hard to tackle with this data, is the extent to which undiversified ties could emerge as socially legitimate adaptations to environments with high transaction costs, in the absence of extractive, corrupt, behavior. The theoretical section has presented the argument for why this is unlikely, and the results point even more towards this. First, the behavior of the country indicators is hard to make compatible with the connection between undiversified ties and markers such as low competition and suspicious procedures (in the distance models). Far more likely is that the connection arises because settings in which rents are generated through low competition and uncompetitive procedures are also settings in which cooperative behavior between the rent-sharers is facilitated by close ties. Second, in as much as such the transaction costs arise due to reasons other than the desire to hide the nature of the interaction, we would expect them to be connected to income per capita: Less economically developed environments are likely those in which search costs, litigation costs, and other aspects of enforcement are hard to pay for. However, the fact that the country coefficients in our models are closely connected to the governance indicator but not at all to the income per capita measure point away from this mechanism. So, while the possibility of second best efficiency of close ties must be allowed, it is also the case that it is unlikely given these results.
These results encourage a renewed policy focus on the structure of ties between economic agents. Foundational works such as North (Reference North1991) and Greif (Reference Greif1993) place the diversification and depersonalization of market interactions at the very center of accounts of economic development. Works on social capital, and the sociological work on weak ties by Granovetter (Reference Granovetter1973), similarly point to the centrality of this factor. By contrast, applied policy analysis of, in our case, procurement, hardly focuses on this aspect at all: the European Commission's policy analysis papers, such as PwC, London Economics, and Ecorys (2011), look in great detail at factors such as the formal rules governing contract awards, but hardly mention the diversity of buyer-seller connections, which, these results suggest, should also be studied carefully. From a policy perspective, the results here suggest that an important component of institutional reform and anti-corruption drives should be an effort towards diversifying interactions between public and private actors. In the procurement context, this could be done by setting explicit quantitative targets for diversification, as well as by closer auditing of particularly close connections. More generally, ensuring that the same two agents do not have the opportunity to form particularly close connections may be a powerful tool for discouraging and disrupting corrupt interactions.
Supplementary material
To view supplementary material for this article, please visit https://doi.org/10.1017/bap.2019.1