
1. Introduction
The aerodynamic lift response of an airfoil to turbulent flow is one of the classical fluid dynamics issues. A key quantity is the so-called aerodynamic admittance function, which describes the aerodynamic transfer relationship between the incident turbulent fluctuation and lift force acting on the airfoil. Due to the space–time-varying feature of turbulent flow, this issue usually involves some complex flow phenomena like the unsteady effect, the spanwise effect and the flow distortion. The understanding of aerodynamic admittance has therefore gone through a long process.
As early as 1936, Küssner (Reference Küssner1936) derived the lift indicial function for a thin airfoil encountering a sharp-edged vertical gust field. About the same time, Sears (Reference Sears1938) investigated the harmonic gust problem to permit the Fourier superposition. He analysed the case of a thin airfoil in a one-dimensional sinusoidal vertical gust field, and derived the corresponding lift aerodynamic admittance function, namely the well-known Sears function. Mathematically, the Sears function can be connected to the lift indicial function of Küssner (Garrick Reference Garrick1938), which is essentially the modification of unsteadiness. Based on the analyses of power spectral density and correlation, Liepmann (Reference Liepmann1952, Reference Liepmann1955) used Sears's analysis to deal with the problem of a thin airfoil in a random gust field, e.g. the turbulent flow field. In Liepmann's approach, the three-dimensionality of turbulent flow structure is considered, and the strip assumption is also introduced. This enables the aerodynamic lift response of an overall wing in turbulent flow to be calculated with the Sears function and cross-spectrum of turbulent flow. Later, Liepmann's approach was extended to solve the aerodynamic responses of other flexible slender engineering structures to turbulent flow (Davenport Reference Davenport1961). From this, the Sears function and the concept of aerodynamic admittance were widely used not only in the field of aerodynamics, but also in other research areas, e.g. the wind engineering community (Kimura et al. Reference Kimura, Fujino, Nakato and Tamura1997; Hatanaka & Tanaka Reference Hatanaka and Tanaka2002; Costa Reference Costa2007; Kavrakov et al. Reference Kavrakov, Argentini, Omarini, Rocchi and Morgenthal2019). According to Liepmann's expression, the Sears function (here it refers to the square of modulus) can be expressed as the ratio of one-dimensional lift spectrum and one-dimensional turbulent velocity spectrum. Thus, the traditional aerodynamic admittance is generally defined as the ratio of these two spectra. However, many experiments showed that the aerodynamic admittances of airfoils and other streamlined structures directly determined using this ratio are not fixed; not only are they less than the Sears function, but also they change with different turbulent flow fields (Hakkinen & Richardson Reference Hakkinen and Richardson1957; Lamson Reference Lamson1957; Larose & Mann Reference Larose and Mann1998; Ma et al. Reference Ma, Wang, Li and Liao2019). This naturally raises the question of whether the aerodynamic admittance in turbulent flow is dependent on the flow field.
To explain the above problem, it is important to make clear how the spanwise effect influences the aerodynamic lift fluctuation. Ribner (Reference Ribner1956) and Etkin (Reference Etkin1959) were probably the first to investigate the spanwise effect for the estimation of the aerodynamic lift response of an airfoil to turbulent flow. They represented the incident turbulent velocity field as a superposition of plane sinusoidal wave motions of all orientations and wavelengths which mathematically takes the form of a three-dimensional Fourier integral. This requires information of both streamwise and spanwise wavenumbers related to the lift response to be known, which can be given by a two-wavenumber aerodynamic admittance. Since then, a series of theoretical and experimental studies on the spanwise effect have been conducted. Using the unsteady lifting-surface theory, Graham (Reference Graham1970, Reference Graham1971) calculated the numerical solution of two-wavenumber aerodynamic admittance of a thin airfoil in a yawed sinusoidal vertical gust with streamwise and spanwise variations. Some approximate analytic solutions of two-wavenumber aerodynamic admittance were also derived by other researchers independently (Filotas Reference Filotas1969; Mugridge Reference Mugridge1971; Blake Reference Blake1986). By comparison of experimental lift measurements and calculations in which the theoretical two-wavenumber aerodynamic admittance is used, the influence of the spanwise effect on the aerodynamic lift fluctuation was verified indirectly (Jackson, Graham & Maull Reference Jackson, Graham and Maull1973; Amiet Reference Amiet1975). Though the influence of the spanwise effect can be considered under the presupposition of knowing the theoretical two-wavenumber aerodynamic admittance (Massaro & Graham Reference Massaro and Graham2015; Li et al. Reference Li, Yang, Li and Liao2018), it should be noted that the above theoretical solutions are based on the flat-plate assumption. This may cause deviations between theoretical calculations and practical situations. For an actual airfoil and other engineering structures of which the accurate two-wavenumber aerodynamic admittance cannot be known in advance, the experimental determination of the spanwise effect is still necessary.
A recent work of Yang, Li & Liao (Reference Yang, Li and Liao2019) investigated the influence of the spanwise effect on the lift fluctuations of several structures with different cross-sections. The work indicated that the final lift response could be integrated in the form of the one-wavenumber aerodynamic admittance reflecting the unsteady effect and the spanwise effect factor reflecting the spanwise effect. This enables us to determine the spanwise effect and one-wavenumber aerodynamic admittances in turbulent flow by wind tunnel tests. Based on this, the flow-field dependence of generalized aerodynamic admittance (namely the traditional aerodynamic admittance) is analysed in this study. The consistency of one-wavenumber aerodynamic admittances in various turbulent flow fields is confirmed, and the discrepancies between the experimental one-wavenumber aerodynamic admittance and the Sears function are also discussed. Before that, there is usually certain variability in the reported aerodynamic admittance measurements from different wind tunnel tests, leading to different conclusions about the aerodynamic admittance even for the same cross-section. The present study may be helpful in the improvement of this problem. Besides, Cordes et al. (Reference Cordes, Kampers, Meißner, Tropea, Peinke and Hölling2017) and Wei et al. (Reference Wei, Kissing, Wester, Wegt, Schiffmann, Jakirlic, Hölling, Peinke and Tropea2019) explored the limitation of the Sears function, and found that the Sears function required a second-order correction for the gust distortion by the airfoil provided by Goldstein & Atassi (Reference Goldstein and Atassi1976) and Atassi (Reference Atassi1984). The work of Lysak, Capone & Jonson (Reference Lysak, Capone and Jonson2013, Reference Lysak, Capone and Jonson2016) showed that the Sears function would overestimate the aerodynamic lift response at high frequencies where the relevant turbulent length scale was comparable to the thickness. Hence, the Sears function still needs more experimental verifications in terms of frequency dependence. In fact, the present work could also provide better guidance for wind tunnel model testing. It is known that the parameters of an actual flow field have to be accurately simulated based on the flow similarity principle to ensure the accuracy of scale model tests. However, the similarity of turbulent integral scale may not be satisfied due to technical limitations in some cases, which would lead to inaccurate simulation of the spanwise effect. From this study, the one-wavenumber aerodynamic admittance rather than only the generalized aerodynamic admittance should be measured in a wind tunnel test. Then by correction of the spanwise effect corresponding to the actual flow field, the lift response of an actual situation can be properly estimated. It should be noted that the method used in this work could be applied not only for the airfoil considered herein, but also for other engineering structures.
2. Methodology
In this section, we briefly review current theoretical approaches and make clarifications regarding relationships between the generalized aerodynamic admittance and one-wavenumber aerodynamic admittance. On this basis, an experimental methodology is introduced to provide a guideline for the following measurements of one-wavenumber aerodynamic admittances in different turbulent flow fields.
The measured characteristics of incident turbulent fluctuations and the corresponding lift on an airfoil are the one-dimensional spectra  $\phi _{WW}$ and
 $\phi _{LL}$ in terms of the streamwise wavenumber
 $k_{1}=\omega /U$ or the reduced frequency
 $\tilde {k}_{1}=\omega c/2U$. Traditionally, the generalized aerodynamic admittance is obtained from these two spectra as follows:
 \begin{equation} |\varGamma(\tilde{k}_{1})|^2=\frac{1}{({\rm \pi} \rho Uc)^2}\frac{\phi_{LL}(k_{1})}{\phi_{WW}(k_{1})}, \end{equation}
where  $\rho$ is the fluid density, U is the main flow velocity,
 $c$ is the chord length,
 $\omega = 2{\rm \pi} f$ is the circular frequency and
 $f$ is the frequency.
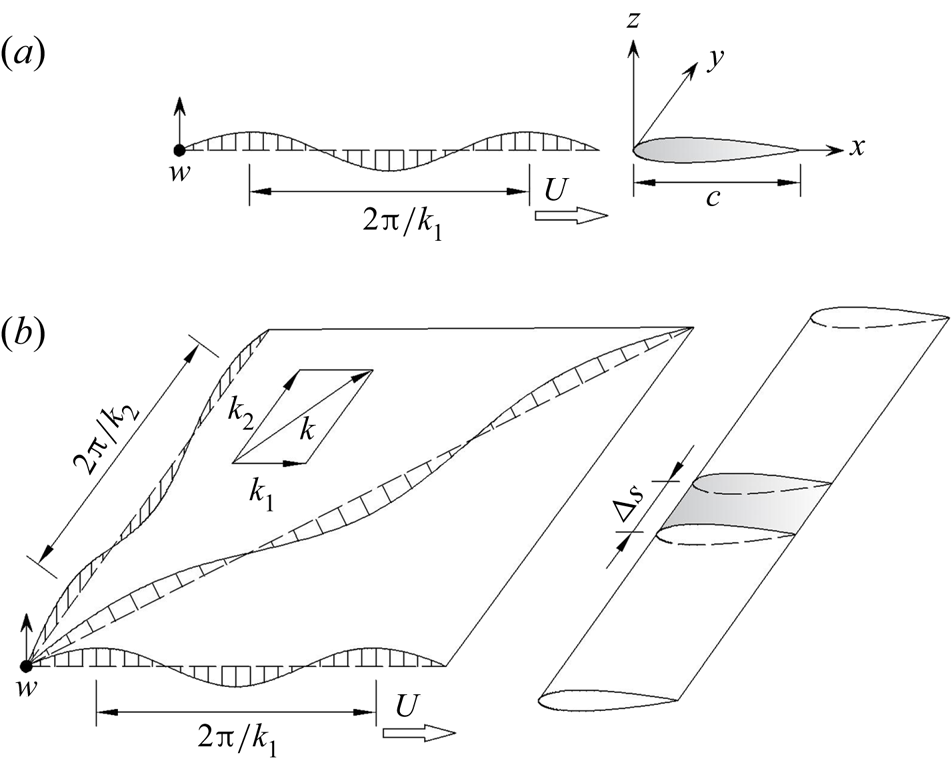
For a one-dimensional sinusoidal gust field with vertical velocity distribution  $w_{G}=\bar {w}_{G}\exp ({{\rm i}(\omega t-k_{1}x)})$, as shown in figure 1(a), the lift on an airfoil is
 \begin{equation} L={\rm \pi} \rho Uc\,{\rm e}^{{\rm i}\omega t}\chi(\tilde{k}_{1})\bar{w}_{G}, \end{equation}
where  $\chi (\tilde {k}_{1})$ is the one-wavenumber aerodynamic admittance which is theoretically only related to the cross-sectional shape. For a flat-plate airfoil, it is the Sears function. Then the lift force due to any form of prescribed random velocity field can be built up by the Fourier superposition. If the spanwise variation of incident turbulent velocity field is constant along the span, the one-dimensional lift spectrum of an airfoil in turbulent flow can be expressed as follows:
 \begin{equation} \phi_{LL}(k_{1})=({\rm \pi} \rho Uc)^2|\chi(\tilde{k}_{1})|^2\phi_{WW}(k_{1}). \end{equation}
In this case, the generalized aerodynamic admittance  $|\varGamma (\tilde {k}_{1})|^2$ is identical to the one-wavenumber aerodynamic admittance
 $|\chi (\tilde {k}_{1})|^2$.
(a) An airfoil encountering a sinusoidal vertical gust with streamwise variation. (b) An infinite wing encountering a yawed sinusoidal vertical gust with streamwise and spanwise variations.

For an actual three-dimensional turbulent flow, the spanwise wavenumber  $k_{2}$ needs to be introduced to describe the spanwise variation of incident turbulent velocity field. Its Fourier component can be expressed as a two-dimensional sinusoidal gust
 $w_{G}=\bar {w}_{G}\exp ({{\rm i}(\omega t-k_{1}x-k_{2}y)})$, as shown in figure 1(b). For such a yawed sinusoidal gust field, the lift per unit span is (this is for the integrated lift on a section of spanwise length
 ${\rm \Delta} s$)
 \begin{equation} L={\rm \pi} \rho Uc\,{\rm e}^{{\rm i}\omega t}\mathrm{sinc}(k_{2}{\rm \Delta} s/2)\chi(\tilde{k}_{1},\tilde{k}_{2})\bar{w}_{G}, \end{equation}
where  $\chi (\tilde {k}_{1},\tilde {k}_{2})$ is the two-wavenumber aerodynamic admittance. In this work, we only discuss the case of lift measured on the strip (that is, the spanwise measuring length
 ${\rm \Delta} s\to 0$), the sinc function
 $\mathrm {sinc}(k_{2}{\rm \Delta} s/2)\to 1$. Hence, using the two-dimensional Fourier superposition, the two-dimensional lift spectrum in turbulent flow can be expressed as follows:
 \begin{equation} \phi_{LL}(k_{1},k_{2})=({\rm \pi} \rho Uc)^2|\chi(\tilde{k}_{1},\tilde{k}_{2})|^2\phi_{WW}(k_{1},k_{2}), \end{equation}
where  $\phi _{WW}(k_{1},k_{2})$ is the two-dimensional turbulence spectrum, which can be obtained based on the turbulence spectral model once the turbulence parameters are determined. The two-wavenumber aerodynamic admittance can be decomposed to the product of the one-wavenumber aerodynamic admittance
 $|\chi (\tilde {k}_{1})|^2$ and the spanwise influence term
 $\eta (\tilde {k}_{1},\tilde {k}_{2})$. By comparison with the measured spanwise coherence of lift, the spanwise influence term can be experimentally determined. In this matching, the following expression of lift coherence can be compared with the measured values (Yang et al. Reference Yang, Li and Liao2019):
 \begin{equation} coh_{L}(k_{1},{\rm \Delta} y)=\frac{\int_{-\infty}^{+\infty} \phi_{WW}(k_{1},k_{2})\eta( \tilde{k}_{1},\tilde{k}_{2}) \cos({\rm i}{k}_{2}{\rm \Delta} y)\,{\rm d}{k}_{2}}{\int_{-\infty}^{+\infty} \phi_{WW}(k_{1},k_{2})\eta( \tilde{k}_{1},\tilde{k}_{2})\,{\rm d}{k}_{2}}. \end{equation}
By integrating out the spanwise wavenumber, the final one-dimensional lift spectrum is written as follows:
 \begin{equation} \phi_{LL}(k_{1})=\int_{-\infty}^{+\infty}\phi_{LL}(k_{1},k_{2})\,{\rm d} k_{2}= ({\rm \pi} \rho Uc)^2|\chi(\tilde{k}_{1})|^2g_{span}(\tilde{k}_{1})\phi_{WW}(k_{1}), \end{equation}
where  $g_{span}(\tilde {k}_{1})$ can be regarded as a factor reflecting the influence of the spanwise effect. For the sake of simplicity, we call it the spanwise effect factor, which is expressed as follows:
 \begin{equation} g_{span}(\tilde{k}_{1})=\frac{\int_{-\infty }^{+\infty} \phi_{WW}(k_{1},k_{2})\eta( \tilde{k}_{1},\tilde{k}_{2})\,{\rm d} k_{2}}{\int_{-\infty }^{+\infty} \phi_{WW}(k_{1},k_{2})\,{\rm d} k_{2}}. \end{equation}
Combining (2.1) and (2.7), one obtains the relationship between one-wavenumber aerodynamic admittance and generalized aerodynamic admittance as follows:
 \begin{equation} |\chi(\tilde{k}_{1})|^2=|\varGamma(\tilde{k}_{1})|^2\frac{1}{g_{span}(\tilde{k}_{1})}. \end{equation}
Apparently, just because of the influence of the spanwise effect, the generalized aerodynamic admittance is different from the one-wavenumber aerodynamic admittance, and is dependent on the flow field.
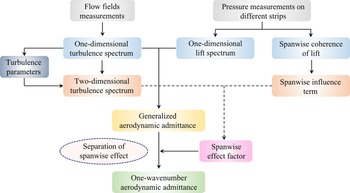
As mentioned before, the generalized aerodynamic admittance can be directly determined by the measured one-dimensional lift spectrum and the one-dimensional turbulent velocity spectrum. Now the one-wavenumber aerodynamic admittance can be further obtained by separating out the spanwise effect from the generalized aerodynamic admittance. The experimental methodology used for the measurement of one-wavenumber aerodynamic admittance in turbulent flow is summarized in figure 2.
Flow chart of experimental methodology for measurement of one-wavenumber aerodynamic admittance in turbulent flow.

3. Experiment description
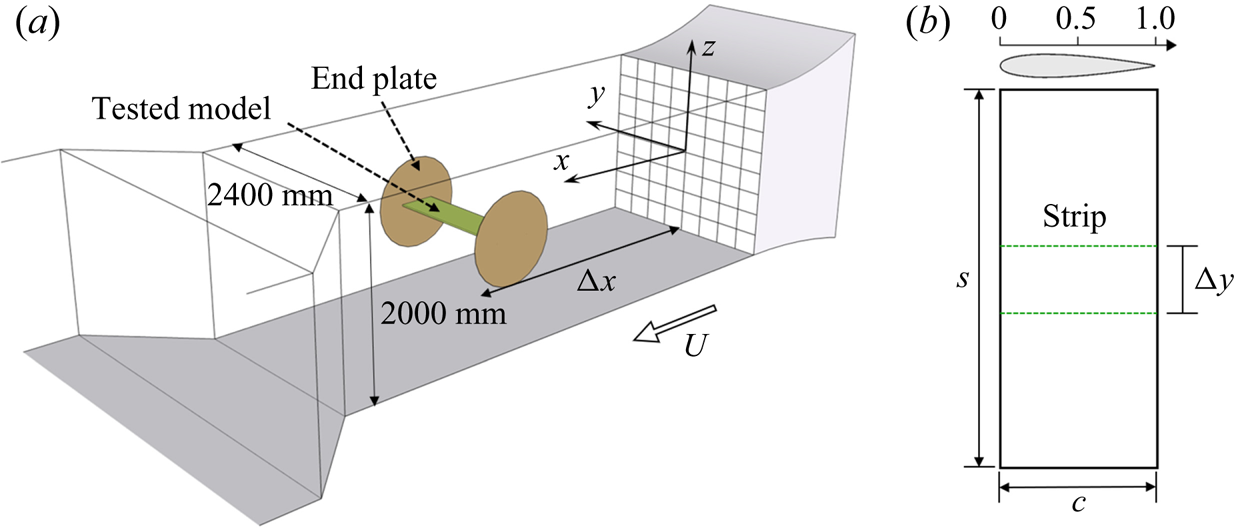
The experiments are conducted in a low-speed wind tunnel (XNJD-1) at Southwest Jiaotong University, which has a test section of 2.4 m (width)  $\times$ 2.0 m (height), as shown in figure 3(a). The turbulent flow field is generated by a square uniform grid installed at the entrance of the test section. Three grids (mesh sizes
 $M = 180$, 330 and 400 mm and corresponding bar widths
 $d = 40$, 70 and 80 mm) are used to generate three different turbulent flow fields. The instantaneous velocities of the turbulent flow fields are measured by a TFI Cobra Probeanemometer which has a frequency response of 0 Hz up to more than 2 kHz. The dynamic frequency response of the Cobra Probe is stable during the measurement, ensuring the dynamic validity of the flow velocity data. Before measuring the surface pressures on the model, the characteristics of turbulent flow fields at the position of the leading edge of tested model are measured in the empty wind tunnel in advance to avoid flow disturbance from the model. The distance from the measuring position to the grid is about
 ${\rm \Delta} x = 4.5$ m.
(a) Schematic of experimental set-up of surface pressure measurements on a stationary NACA 0015 airfoil model in grid turbulence. (b) Arrangement of measuring strips on the model.

An airfoil model with a NACA 0015 cross-section is used in the pressure measurements. The chord length of the model is  $c = 0.4$ m and the span length is
 $s = 1.5$ m. The model is mounted horizontally when testing to keep the mean angle of attack at zero. Two end plates are installed on the model, one on each side, to simulate the two-dimensional flow conditions and prevent air flow around the tips. To measure the surface pressure distribution on the airfoil, two measuring strips are set on the airfoil surface, each strip having 64 taps. The spanwise separation between two measuring strips is
 ${\rm \Delta} y = 0.07$ m, which is arranged on the middle portion of the model, as shown in figure 3(b). The taps are connected to a Scanivalve ZOC33 electronic pressure scanner, which can acquire the dynamic pressure signal. The pressure scanner is capable of reaching high dynamic response exceeding 1 kHz, with an uncertainty of
 ${\pm }0.08\,\%$ full scale. All pressure scanners are connected to the same Scanivalve DSM4000 digital service module, achieving the synchronous acquisition of the surface pressures. The length of the tube connecting the tap and the scanner is limited within 0.2 m to minimize the influence of resonance and damping effect of the tube on the measured signal to a point where they do not need to be considered. Integration of the surface pressures along the chord length of the airfoil gives the total lift force
 $L = \sum (p_{\infty }-p_{i}){\rm \Delta} s_{i}\sin \theta _{i}$. Here
 $p_{\infty }$ is the reference pressure in the free stream,
 $p_{i}$ is the measured pressure of point
 $i$,
 ${\rm \Delta} s_{i}$ is the integral length of point
 $i$ and
 $\theta _{i}$ is the angle between the inner normal and the horizontal plane. In the experiments, the data of pressure and velocity are recorded at the same sampling frequency of 256 Hz, the durations of pressure and velocity measurements are 90 s and the main flow velocity is set to
 $U = 11.5$ m s
 $^{-1}$.
4. Results and discussion
4.1. Flow fields and generalized aerodynamic admittances
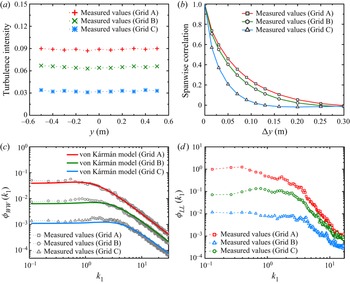
The homogeneities of experimental turbulent flow fields are firstly checked at the measuring position. The statistical characteristics of homogeneous turbulence are independent of the spatial position; thus the root mean square of fluctuating velocity in the same cross-section should be identical. Figure 4(a) shows the spanwise distribution of vertical turbulence intensities, which are the root mean square of vertical fluctuating velocity  $\sigma _{w}$ normalized by the main flow velocity
 $U$. It is seen that the vertical turbulence intensities
 $\sigma _{w}/U$ at different spanwise positions are very close, and good homogeneities of flow fields across a wide range in the spanwise direction can be confirmed. In general, the spectral characteristics of turbulent flow can be described by a spectral model. The results of previous studies (Comte-Bellot & Corrsin Reference Comte-Bellot and Corrsin1966; Lavoie, Djenidi & Antonia Reference Lavoie, Djenidi and Antonia2007; Kitamura et al. Reference Kitamura, Nagata, Sakai and Harasaki2014; Li, Li & Liao Reference Li, Li and Liao2015) have indicated that the grid turbulence can be reasonably described by the von Kármán spectral model. According to this model, the one-dimensional spectrum of vertical fluctuating velocity is
 \begin{equation} \phi_{WW}(k_{1})=\frac{2\sigma_{w}^2L_{w}^{x}[1+19.125(L_{w}^{x}k_{1})^2]}{{\rm \pi} [1+7.172(L_{w}^{x}k_{1})^2]^{11/6}}, \end{equation}
where  $L_{w}^{x}$ is the vertical integral length scale in the streamwise direction. Though the integral length scale is formally the integral of correlation coefficients, it is a free parameter of the spectral model and can usually be determined by a comparison between the measured one-dimensional spectrum and spectral model. From figure 4(c), it can be seen that the measured one-dimensional velocity spectra agree well with the von Kármán model, and the vertical integral length scales in the streamwise direction
 $L_{w}^{x}$ can be determined correspondingly. The turbulence parameters of the three turbulent flow fields are: Grid A,
 $\sigma _{w}/U = 0.089$,
 $L_w^x = 0.063$ m; Grid B,
 $\sigma _{w}/U = 0.064$,
 $L_w^x = 0.053$ m; Grid C,
 $\sigma _{w}/U = 0.032$,
 $L_w^x = 0.028$ m. To further evaluate the isotropy of experimental flow fields, the spanwise correlation coefficients of vertical fluctuating velocities are measured, as shown in figure 4(b). The vertical integral length scales in the spanwise direction
 $L_{w}^{y}$ can be then determined according to the definition, which are: Grid A,
 $L_w^y = 0.059$ m; Grid B,
 $L_w^y = 0.050$ m; Grid C,
 $L_w^y = 0.026$ m. We expect
 $L_{w}^{x}$ and
 $L_{w}^{y}$ of homogeneous isotropic turbulence to be equal. However, as observed in previous experiments,
 $L_{w}^{x}$ is slightly larger than
 $L_{w}^{y}$ in grid turbulence, the ratio
 $L_{w}^{x}$/
 $L_{w}^{y}$ being equal to 1.07, 1.06 and 1.06, respectively. It seems that strict isotropy is difficult to satisfy for grid turbulence; however, the results indicate that the degree of anisotropy is slight, and the grid turbulence can be regarded as approximately isotropic. With the above turbulence parameters, the two-dimensional turbulence spectrum can be determined as follows:
 \begin{equation} \phi_{WW}(k_{1},k_{2})=\frac{46\sigma_{w}^2(L_{w}^{x})^4(k_{1}^2+k_{2}^2)}{{\rm \pi} [1+7.172(L_{w}^{x})^2(k_{1}^2+k_{2}^2)]^{7/3}}. \end{equation}
Measurements in three flow fields. (a) Spanwise distributions of vertical turbulence intensities. (b) Spanwise correlations of vertical fluctuating velocities. (c) One-dimensional vertical velocity spectra. (d) One-dimensional lift spectra.

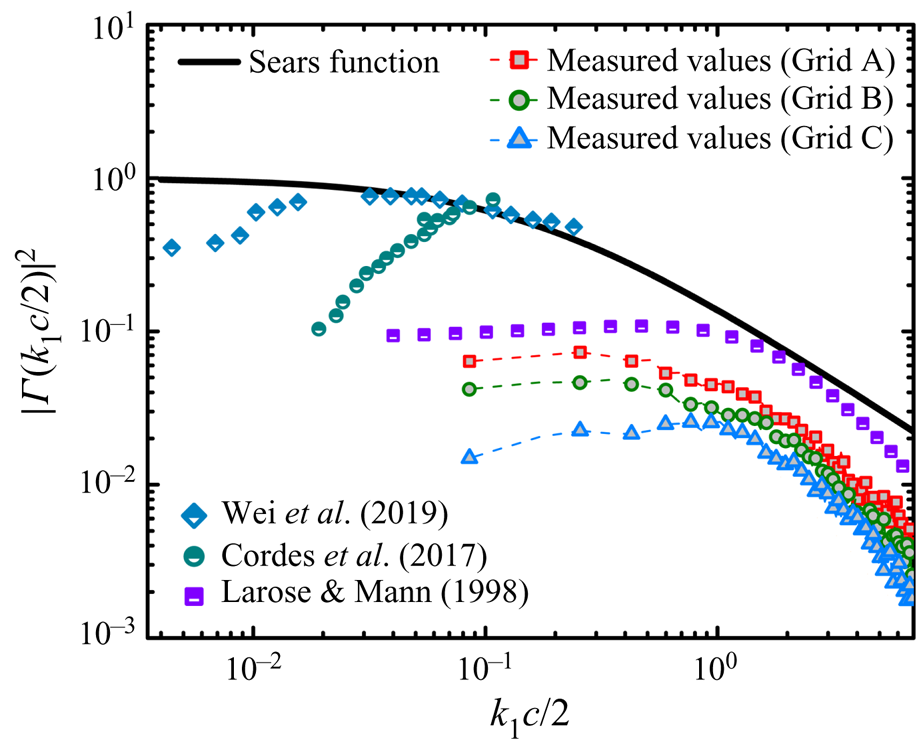
The one-dimensional lift spectra measured in the three flow fields are shown in figure 4(d). Due to different turbulence parameters, these one-dimensional lift spectra are of course different. The discrepancies caused by the turbulence intensity can be easily eliminated by the use of generalized aerodynamic admittance, which is defined by (2.1). The generalized aerodynamic admittances obtained in the three flow fields are shown in figure 5. The measured values are compared with the Sears function. The results of Wei et al. (Reference Wei, Kissing, Wester, Wegt, Schiffmann, Jakirlic, Hölling, Peinke and Tropea2019), Cordes et al. (Reference Cordes, Kampers, Meißner, Tropea, Peinke and Hölling2017) and Larose & Mann (Reference Larose and Mann1998) are also included for comparison. As expected, the results show that the measured values of generalized aerodynamic admittances are still different in the three flow fields, and they are all less than the Sears function. Obviously, the generalized aerodynamic admittance cannot eliminate the discrepancies caused by the turbulent integral scale, which leads to the variations of generalized aerodynamic admittances in different turbulent flow fields. Due to this flow-field dependence, there is usually certain variability in the reported aerodynamic admittance measurements from different wind tunnel tests. For example, the present measurements are different from the measurements of Larose & Mann. One of the consequences of this phenomenon is that the prediction of lift response based on the wind tunnel testing data may be inaccurate, because the similarity of turbulent integral scale cannot be satisfied in some cases. It should be noted that the present discussion is based on a symmetric airfoil at zero angle of attack. From the results of Wei et al. and Cordes et al., when the airfoil has non-zero angle of attack or camber, the longitudinal velocity fluctuation would also produce a similar effect, reducing the values of admittance at low frequencies. Hence, the influence of longitudinal velocity fluctuation should be considered for a non-zero angle of attack and asymmetric airfoil.
Generalized aerodynamic admittances obtained in three flow fields. The measured values are compared with the Sears function. The results of Wei et al. (Reference Wei, Kissing, Wester, Wegt, Schiffmann, Jakirlic, Hölling, Peinke and Tropea2019), Cordes et al. (Reference Cordes, Kampers, Meißner, Tropea, Peinke and Hölling2017) and Larose & Mann (Reference Larose and Mann1998) are also included for comparison.

4.2. Influence of spanwise effect
In this section, we experimentally determine the spanwise effect and analyse its influence in detail. To determine the spanwise effect, the spanwise influence term needs to be known, which can be achieved by measuring the spanwise coherence of lift. The general form of the spanwise influence term is expressed as follows (Li & Li Reference Li and Li2017):
 \begin{equation} \eta(\tilde{k}_{1},\tilde{k}_{2})=\frac{1+a_{1}{\rm \pi}\tilde{k}_{1}^\mu}{1+a_{1} {\rm \pi}\tilde{k}_{1}^\mu+a_{2}{\rm \pi}\tilde{k}_{2}^2}, \end{equation}
where  $a_{1}$,
 $a_{2}$ and
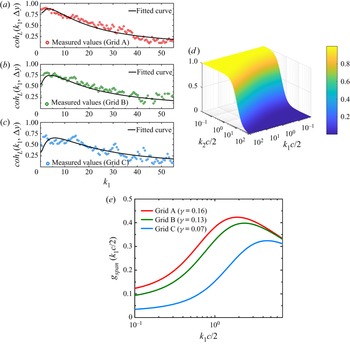
 $\mu$ are free parameters. The measured values of lift coherence in three flow fields are shown in figure 6(a–c). By the use of (2.6) to compare the measured lift coherence, the free parameters of the spanwise influence term are determined as follows:
 $a_{1}=1.33$,
 $a_{2}=2.04$ and
 $\mu =1.12$. Then substituting
 $a_{1}$,
 $a_{2}$ and
 $\mu$ into (4.3), the spanwise influence term is obtained, as shown in figure 6(d).
Measured values of spanwise coherence of lift obtained in (a) Grid A, (b) Grid B and (c) GridC. (d) The spanwise influence term determined from lift coherence. (e) Curves of spanwise effect factors corresponding to three turbulent flow fields.

Now the spanwise effect factor can be calculated based on (2.8). For ease of integration, the presentation of the two-dimensional turbulence spectrum is best given in terms of dimensionless parameters. Hence, (2.8) is rewritten as follows:
 \begin{equation} g_{span}(\tilde{k}_{1}) =\frac{\displaystyle\int_{-\infty }^{+\infty} \xi_{WW}(\tilde{k}_{1},\tilde{k}_{2})\eta(\tilde{k}_{1},\tilde{k}_{2})\,{\rm d} \tilde{k}_{2}}{\displaystyle\int_{-\infty }^{+\infty }\xi_{WW}(\tilde{k}_{1},\tilde{k}_{2})\,{\rm d}\tilde{k}_{2}}, \end{equation}
with
 \begin{equation} \xi_{WW}(\tilde{k}_{1},\tilde{k}_{2})=\frac{\tilde{k}_{1}^2+ \tilde{k}_{2}^2}{[1+28.688\gamma^2(\tilde{k}_{1}^2+\tilde{k}_{2}^2)]^{7/3}}, \end{equation}
where  $\gamma = L_{w}^{x}/c$ is the ratio of vertical turbulent integral scale to chord length (for ease of description, hereinafter it is called the scale ratio), which is respectively equal to 0.16, 0.13 and 0.07 in the three flow fields. Clearly, the control parameter of the spanwise effect is actually the scale ratio
 $\gamma$. The scale ratios corresponding to the three flow fields are different, leading to different degrees of spanwise effect, as shown in figure 6(e). This is the main reason for the flow-field dependence of generalized aerodynamic admittance. As a whole, the smaller the scale ratio, the less is the spanwise effect factor, and the more significant is the spanwise effect. The spanwise effect factor is less than 1. This makes the generalized aerodynamic admittance always less than the Sears function. The results also show that the spanwise effect factor is relatively small at low frequencies, while gradually increasing as the frequency increases. This indicates that the influence of spanwise effect mainly occurs at low frequencies, and an increase of frequency tends to reduce this influence overall. It should be noted that the curve of the spanwise effect factor would reach a peak at a specific frequency. This specific frequency is related to the dominant frequency determined by the turbulent integral scale. It is not difficult to understand that at the dominant frequency, the correlation of turbulent flow is the strongest, and the influence of the spanwise effect is the weakest; consequently, the spanwise effect factor is the largest at this frequency range. Anyhow, the generalized aerodynamic admittance is the result of one-wavenumber aerodynamic admittance being influenced by the spanwise effect. In the next section, we show the one-wavenumber aerodynamic admittances in three flow fields after excluding the influence of the spanwise effect.
4.3. One-wavenumber aerodynamic admittance
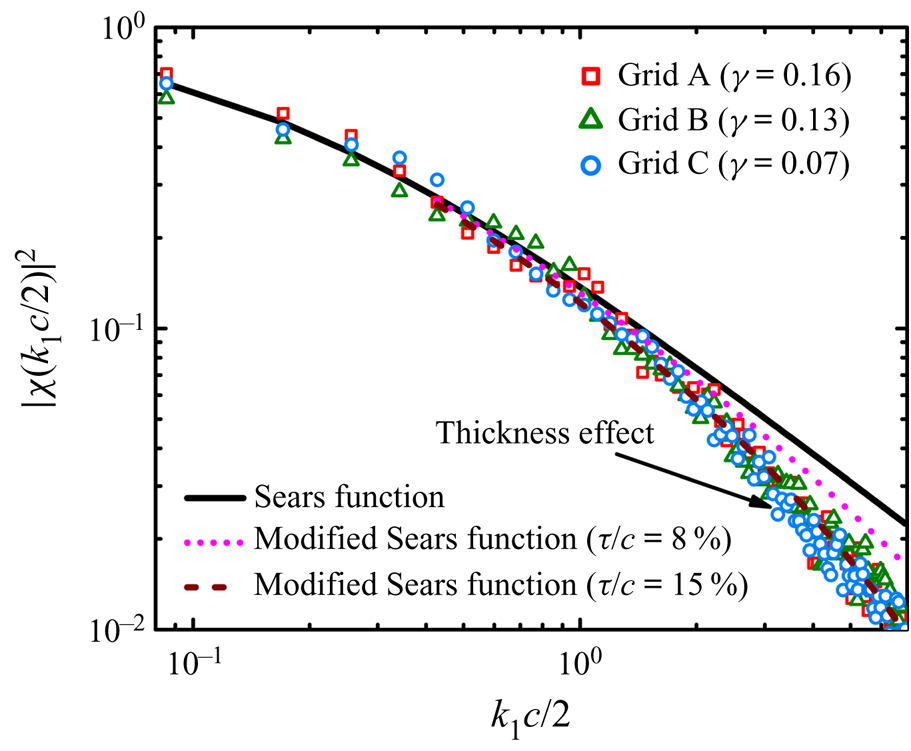
After the spanwise effect is determined, the experimental values of one-wavenumber aerodynamic admittance can be obtained with (2.9). Unlike our previous work (Li et al. Reference Li, Yang, Li and Liao2018) conducted on the basis of strip assumption, the influence of spanwise effect is precisely separated out in the present study. This enables us to provide a more accurate analysis of the characteristics of one-wavenumber aerodynamic admittance in different flow fields. Figure 7 shows the experimental values of one-wavenumber aerodynamic admittances of a NACA 0015 airfoil in three flow fields, which are compared with the Sears function. The results show that when the spanwise effect is separated out, the discrepancies between one-wavenumber aerodynamic admittances among the three turbulent flow fields are significantly reduced. Compared to the generalized aerodynamic admittances, the one-wavenumber aerodynamic admittances obtained in different turbulent flow fields apparently have better consistency, and roughly agree with the Sears function at low frequencies for all cases. It should be noted that there are still slight deviations between experimental values among the three turbulent flow fields, which may be caused by the variation of turbulent flow in the vertical direction (the thickness direction). The airfoil is idealized as a lifting surface in the present analysis, which is assumed to be sensitive only to the flow field in its own plane, while the vertical variation of fluctuating velocity is taken to have negligible effect on the lift response. For an actual airfoil with thickness, this simplification may lead to a certain deviation. A full three-dimensional analysis method needs to be developed in the future to further improve the accuracy of the results. Nevertheless, it can be seen from the results that the flow-field dependence of generalized aerodynamic admittance is mainly from the spanwise effect. It is believed that the fundamental properties of the results would not be lost because of the simplification.
One-wavenumber aerodynamic admittances obtained in three flow fields. The experimental values are compared with the Sears function. The modified Sears function proposed by Lysak et al. (Reference Lysak, Capone and Jonson2013, Reference Lysak, Capone and Jonson2016) is also included for comparison.

In addition, it can be also seen that the experimental values of one-wavenumber aerodynamic admittances of the NACA 0015 airfoil decay faster than the Sears function at high frequencies. Previous work (Gershfeld Reference Gershfeld2004; Glegg & Devenport Reference Glegg and Devenport2009; Devenport, Staubs & Glegg Reference Devenport, Staubs and Glegg2010) studied the applicability of the flat-plate assumption for an airfoil with thickness. Those studies theoretically demonstrated that at high frequencies where the relevant turbulent length scale was comparable to the thickness, the flat-plate assumption is invalid and would make the Sears function overestimate the lift response. Hence, the faster attenuation of experimental values at high frequencies might be attributed to the airfoil thickness. However, relevant experimental studies are still few. To consider the influence of the thickness effect, Lysak et al. (Reference Lysak, Capone and Jonson2013) proposed a modified form of the Sears function. Subsequently, an experimental verification was performed by Lysak et al. (Reference Lysak, Capone and Jonson2016) based on the measurements of NACA 65 series airfoils with elliptical leading-edge profiles. For comparison, here the modified Sears function (see Appendix A) is introduced to account for the thickness effect of the NACA 0015 airfoil (circular leading edge) used in this work. The results show that the modified Sears function corresponding to thickness-to-chord ratio  $\tau /c = 15\,\%$ captures well the experimental values of the NACA 0015 airfoil at high frequencies. Certainly, the influence of the thickness effect would be weakened with a decrease of the thickness-to-chord ratio; therefore, the modified Sears function corresponding to thickness-to-chord ratio
 $\tau /c = 8\,\%$ is closer to the Sears function. Concerning the mechanism of the thickness effect, currently most studies consider that it is mainly caused by the distortion of turbulent flow due to the mean flow around the airfoil. However, it should be noted that there is a variation of turbulent flow in the thickness direction, as mentioned before. This would lead to a lack of correlation of fluctuating velocity between upper and lower airfoil surfaces, and further research is required to investigate its influence.
5. Conclusions
This work investigates the lift aerodynamic admittances of a NACA 0015 airfoil in three different turbulent flow fields. The generalized aerodynamic admittances are directly obtained by the measured one-dimensional spectra of lift force and vertical fluctuating velocity, the same as the traditional method. The one-wavenumber aerodynamic admittances are determined by separating out the spanwise effect which is experimentally determined by measurements of lift spanwise coherence. The results show that the generalized aerodynamic admittance is the result of one-wavenumber aerodynamic admittance after being influenced by the spanwise effect. In different turbulent flow fields, the influence of the spanwise effect which is controlled by the scale ratio is also different, leading to the flow-field dependence of generalized aerodynamic admittance. Meanwhile, the generalized aerodynamic admittance is also much less than the Sears function at low frequencies due to the influence of the spanwise effect. Unlike the generalized aerodynamic admittance, the experimental values of one-wavenumber aerodynamic admittances in three flow fields have good consistency. This confirms that the one-wavenumber aerodynamic admittance of an airfoil is mainly related to the cross-sectional shape. The experimental results also roughly agree with the Sears function at low frequencies, verifying the applicability of the Sears function in different turbulent flow fields. However, the Sears function overestimates the experimental values of one-wavenumber aerodynamic admittance at high frequencies due to the influence of airfoil thickness. An appropriate modification of the Sears function with the exponential attenuation correction factor appears to be an effective approach for considering the influence of the thickness effect.
Funding
The work is supported by the National Natural Science Foundation of China under grant nos.52008357 and 51878580 and the Fundamental Research Funds for the Central Universities with project no. 2682021CX006.
Declaration of interests
The authors report no conflict of interest.
Appendix A
Using an unsteady lift calculation methodology designed to capture the high-frequency asymptote of leading-edge interaction, Lysak et al. (Reference Lysak, Capone and Jonson2013, Reference Lysak, Capone and Jonson2016) proposed a modified lift response function including a quasi-steady correction factor and high-frequency attenuation function. Correspondingly, the modified Sears function is expressed as follows:
 \begin{equation} |S(\tilde{k}_{1})|^2_{modified}=|S(\tilde{k}_{1})|^2 \exp\left[\frac{-\beta(\tau/c)\tilde{k}_{1}}{\rm \pi} \right], \end{equation}
with
 \begin{equation} \beta(\tau/c)\approx b_1(\tau/c)+b_2(\tau/c)^2, \end{equation}
where  $|S(\tilde {k}_{1})|^2$ is the Sears function,
 $\tau$ is the maximum thickness of airfoil and
 $b_1$,
 $b_2$ are free parameters which can be determined by fitting the experimental values. For the NACA 0015 airfoil, the free parameters are
 $b_1 = 2.42$ and
 $b_2 = 0.63$.