Do electoral rules affect electoral outcomes? If so, what are the mechanisms that drive this process? Electoral rules have long captured the attention of political scientists, as they dictate how votes are translated into seats and thus can determine how many parties (and which ones) gain legislative representation, keep party systems in place, or even bias the entire political system to the right or left.Footnote 1 Furthermore, since electoral rules can be more easily manipulated than other features of the political system – such as the party system or the structure of executive authority, to say nothing of more informal factors such as political culture – understanding how small changes in such rules can affect electoral outcomes constitutes a central research question within the discipline.
Since the work of Duverger,Footnote 2 it has been known that electoral rules may operate through two mechanisms. The mechanical effect refers to the fact that different electoral rules may translate the same distribution of votes into different distributions of seats. This effect is ‘mechanical’ in the sense that the seats are distributed according to a mathematical algorithm, independently of human volition. But of course, strategic players – candidates, voters or party elites – can anticipate these effects and adjust their behavior accordingly, thus modifying the underlying vote distribution. Duverger called this phenomenon the psychological effect of electoral rules.
Even though this distinction is well understood, as a practical matter, disentangling the relative contribution of these mechanisms to electoral outcomes is complicated by the fact that they may interact with each other in multiple and contradictory ways. For example, imagine a change in electoral rules that is expected to benefit small parties (mechanical effect): to the extent that this makes voters more likely to support small parties (psychological effect), the final vote distribution will be more fragmented, which may end up benefitting large parties. In other words, a reform intended to boost the vote share of small parties may nevertheless leave large parties with as many seats as before (albeit with fewer votes). This may create the impression that the new rules have no effect at all, when actually the mechanical and psychological effects are working against each other.
Alternatively, a change in rules may have no effect on the distribution of votes, either because players anticipate (correctly) that the mechanical effect is trivial, or because they are imperfectly informed – or imperfectly rational – and thus fail to adjust their behavior. It may also be the case that players adjust their behavior in response to a change in electoral rules, but this is not enough to change the distribution of seats above and beyond what the new rules would warrant. For example, in a context of three-party competition, increasing the number of seats from two to three will likely result in one more party winning representation; given this change, the psychological effect cannot make a difference unless the vote share of the first-, second- or fourth-placed party increases substantially, thus depriving the third-placed party of a seat.
These examples do not pretend to be exhaustive; rather, their goal is to illustrate that understanding the effect of electoral rules requires looking at three different sets of outcomes. First, the fact that strategic players anticipate the mechanical effect means that electoral rules may affect the way in which voters and elites coordinate their behavior before seats are distributed: how many parties enter the race, how many votes they receive or whether voters tend to favor large parties over small ones. Secondly, electoral rules shape the distribution of seats: how many parties gain representation, how seats are distributed among them and how (dis)proportional is their allocation. Finally, the effect of electoral rules on the distribution of seats may be driven by the mechanical effect, the psychological effect, or some combination of the two. The point is that finding that electoral rules do not matter for some outcomes is consistent with finding strong effects for others; for example, a change in rules may have no effect on the final distribution of seats, but only because the mechanical and psychological effect are cancelling each other out. The bottom line is that electoral rules can only be deemed inconsequential when they fail to have an effect on any of these outcomes.
Furthermore, and despite abundant observational evidence of an association between electoral rules and political outcomes,Footnote 3 showing that this relationship is causal has proved elusive. One possibility is that the relationship may reflect reverse causality, that is, political parties choose those rules that are more likely to keep them in office. Alternatively, changes in electoral rules and electoral outcomes may result from a common cause, such as a shock to voters’ preferences. The number of seats elected in a district may affect electoral outcomes, but districts that elect more representatives also tend to be more urbanized and more socially diverse, which may shape voters’ willingness to support certain kinds of parties.Footnote 4 Comparing elections for different offices within the same polity – that is, lower- and upper-house elections that follow the same district boundariesFootnote 5 – is problematic because behavior in both tiers may be correlated, for example if citizens cast a straight-party vote, or if small parties systematically nominate their best candidates in the more competitive tier.Footnote 6
To address these issues, in this article I exploit two natural experiments determining the distribution of district magnitude in elections for the Argentine Chamber of Deputies. First, the Argentine lower house is elected by closed-list proportional representation (PR) in twenty-four multi-member districts that are coterminous with the country’s provinces;Footnote 7 however, half of the chamber is renewed every two years, and thus the nineteen provinces that have an odd delegation size elect a different number of representatives in concurrent and midterm election years. Secondly, the choice of which provinces would elect a larger number of representatives in concurrent or midterm years was decided by lottery in 1983, when half of the deputies elected in that year were randomly assigned a shortened two-year mandate instead of a four-year one.Footnote 8 In other words, in Argentina the number of seats elected in a given district varies periodically, but several potentially confounding factors – such as history, social diversity or the structure of the party system – remain constant. Furthermore, whether a province elects more or fewer representatives in a given year is not systematically associated with midterm or concurrent elections. Taken together, these institutional features provide a credible strategy for identifying the short-run effect of district magnitude on electoral coordination, the distribution of seats, and the extent to which the mechanical and psychological effects contribute to the latter. At the same time, the fact that district magnitude only varies by increments of one within provinces and oscillates periodically every two years means that this design cannot address the effect of large shifts in magnitude, nor can it assess the impact of magnitude changes that are expected to be permanent.
In line with theoretical expectations, the results show that district magnitude – the number of seats elected in a given district in a given election – increases the effective number of parties receiving votes and decreases the vote share of the two largest parties, though the estimates are somewhat imprecise. Magnitude also has a strong positive effect on the (effective) number of lists gaining representation, and a large negative one on electoral disproportionality. In substantive terms, these results imply that simplifying Argentina’s electoral calendar so that all provinces elected their entire delegation simultaneously would decrease electoral support for the two largest parties by 6.3 percentage points, increase the number of lists gaining representation by 0.7 per province, or cut electoral disproportionality in half. These effects are somewhat stronger for small provinces as well as those that had a large regional party in 1983, though the difference with the rest of the sample is not substantively large. Further inspection reveals that the effect of magnitude on the distribution of seats is almost entirely driven by the mechanical effect: although higher magnitudes do increase the vote share of small parties, the fact that many Argentine provinces elect few representatives means that this effect cannot compete with that of having an additional seat to distribute.
This article contributes to a rapidly growing literature on the causal effect of electoral rules.Footnote 9 In this regard, it is worth noting that while none of its three major elements – the explanatory variable, the main outcome variables or the identification strategy – is unique, their combination is novel. To begin with, I focus on the effect of electoral rules on the distribution of both votesFootnote 10 and seats,Footnote 11 rather than either of them separately. Unlike Singer, I focus on variation in district magnitude driven by the electoral calendar rather than exogenous reapportionment changes.Footnote 12 In this regard, my identification strategy is very similar to that of Crisp and Demirkaya,Footnote 13 though these authors examine the combined effect of district magnitude and the electoral formula simultaneously. To disentangle the relative contribution of the mechanical and psychological effects, I adopt the framework proposed by Fiva and Folke,Footnote 14 but looking at the role of district magnitude rather than the electoral formula. Finally, the fact that not all Argentine provinces have higher magnitudes in the same election years allows me to account for national-level waves – unlike the cases of Norway or Brazil, where national waves are contemporaneous with changes in electoral rules.Footnote 15
RESEARCH DESIGN AND DATA
Expectations
District magnitude is one of the most fundamental elements of an electoral system: it influences how many parties enter the race and how voters choose between them, and determines how proportional is the translation of votes into seats.Footnote 16 Some authors claim that this effect is conditional on the underlying number of social cleavagesFootnote 17 or the extent to which legislators can seek a personal vote,Footnote 18 but none of them denies that district magnitude is one of the most relevant components of an electoral system.
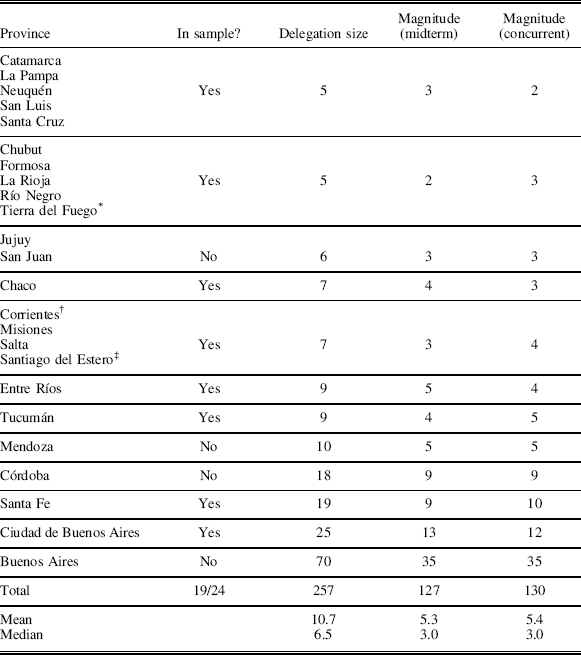
More specifically, the literature has advanced four main claims about the effect of district magnitude on electoral outcomes. First, as long as a PR formula is employed, higher magnitudes should increase the number of parties winning seats.Footnote 19 Secondly, the anticipation of this effect should increase both the number of parties running and the vote share of small parties. In small-magnitude districts, only large parties can expect to win seats, which induces voters to withdraw support from small parties and discourages them from entering the race in the first place. As district magnitude increases, the opposite effect holds: voters become more likely to cast a ballot for small parties, thus increasing the incentives for such parties to field candidates.Footnote 20 Thirdly, these effects should be stronger in more heterogeneous districts. Intuitively, the previous mechanism should only operate when voters would like to support small parties but are wary of ‘wasting’ their votes on hopeless candidates; if voters have a strong preference for large parties to begin with, increasing a district’s magnitude should not increase electoral support for small parties.Footnote 21 Finally, higher magnitudes should induce a more proportional translation of votes into seats: with more seats to distribute, an allocation that roughly reflects the vote shares obtained by different parties is more likely.Footnote 22 However, this relationship may not apply in very small districts. For example, if two parties obtain roughly 50 per cent of the vote, a magnitude of two will result in a more proportional allocation of seats than a magnitude of three: in the first case, the seat distribution will be 1–1, while in the second the largest party will win one additional seat.Footnote 23 Since small magnitudes are common in Argentina (see Table 1), this is a relevant consideration.
Delegation Sizes and District Magnitudes in Argentina, 1985–2015

Note: midterm years are 1985, 1989, 1993, 1997, 2001, 2005, 2009 and 2013. Concurrent years are 1987, 1991, 1995, 1999, 2003, 2007, 2011 and 2015. (*) Elected only two deputies before 1991 (in midterm years). (†) The ordering of midterm and concurrent elections is reversed after 1993, when the subnational electoral calendar changed. (‡) The ordering of midterm and concurrent elections is reversed after 2005, when the subnational electoral calendar changed.
The Argentine Electoral Calendar
I examine these claims with district-level data for elections to the Argentine Chamber of Deputies between 1985 and 2015. The electoral rules governing the composition of this body provide two natural experiments with which to identify the short-term effect of district magnitude on electoral outcomes. First, the use of a scattered electoral calendar means that district magnitude varies regularly within provinces (see Table 1). Specifically, the chamber is elected by closed-list PR in twenty-four multi-member districts that are coterminous with the country’s provinces.Footnote 24 Within each district, seats are distributed according to the d’Hondt formula, with a legal threshold of 3 per cent of registered voters.Footnote 25 Deputies serve four-year terms, but according to the 1853 constitution – which the outgoing military government reinstated in 1983 – each province elects half of its representatives in each election. Thus, the nineteen provinces with an odd number of representatives have higher magnitudes in some years than in others (see Table 1).
The number of seats per province has remained almost constant since 1983. That year, the outgoing military government established that each province would receive one seat per 161,000 people (or a fraction larger than 80,500), but added three additional provisions. First, each province would receive three additional seats regardless of its population. Secondly, no province could have fewer than five deputies. And thirdly, no province could have fewer deputies than it had at the time of the military coup of 24 March 1976. The initial allocation of seats was based on the 1980 census; Congress was supposed to reapportion the number of seats per province in subsequent censuses (1991, 2001 and 2010), but it has not done so. The only district to gain representation since 1983 was Tierra del Fuego, which elected two deputies before it became a province in 1990, and five afterwards. Thus the chamber had 254 members between 1983 and 1991, and has had 257 since 10 December 1991.
The other natural experiment is that whether a province has a higher magnitude in years with concurrent executive elections was decided randomly in 1983. Since executive officials – presidents, governors and mayors – are elected every four years,Footnote 26 some legislative elections take place in years with executive elections (‘concurrent years’), while others take place during midterms (‘midterm years’).Footnote 27 To the extent that variations in magnitude are collinear with concurrent or midterm years – for example, if higher magnitudes always coincided with midterms – disentangling the effect of magnitude from that of concurrency would be impossible. This is a serious consideration, both due to coattail effectsFootnote 28 and because nomination and entry decisions are unlikely to be independent across offices, which may affect the pool of candidates.Footnote 29 For example, national legislators often run for governor or mayor at the end of their mandate,Footnote 30 and parties that agree to support a common candidate for a given office may also support a common list of candidates for a different office.
Fortunately, not all provinces have higher or lower magnitudes in concurrent or midterm years (see Table 1). Moreover, whether a province ended up electing more representatives in midterm or concurrent years was decided by lot in 1983. That year, every province elected its entire congressional delegation, but half of each district’s representatives received a two-year mandate instead of a four-year one. To decide which legislators would receive a full term, each party-province delegation had to divide its members into two groups of equal size, Group 1 and Group 2.Footnote 31 Party-province delegations that had an odd number of representatives had to coordinate with another provincial delegation from the same party that also had an odd number of representatives. A random draw determined that legislators belonging to Group 1 would receive a four-year mandate, implicitly deciding which provinces would elect a larger number of representatives in concurrent and midterm years.Footnote 32
Specification
These considerations suggest employing a difference-in-differences approach in which the treatment of interest – having a higher district magnitude – is switched on and off every two years. Identification using a difference-in-differences design depends on the parallel-paths assumption; that is, the treatment and control groups would have followed parallel paths in the absence of treatment.Footnote 33 The fact that district magnitude varies periodically within provinces with an odd number of representatives is reassuring in this regard, as it ensures that the results cannot be attributed to the fact that a change in magnitude in a province happened to coincide with some secular demographic change or a major realignment of that province’s party system. In particular, the fact that the Argentine political system changed substantially after 2003Footnote 34 is not problematic because the treatment of interest continued to vary in a regular fashion afterwards.
Nonetheless, the parallel-paths assumption would be violated if higher magnitudes coincided with concurrent (or midterm) years in all provinces, because in that case having a higher magnitude would be perfectly collinear with (non-)concurrency. It is here that the second natural experiment kicks in: since higher magnitudes coincide with concurrent years in some provinces but not in others, and since a province’s electoral calendar was randomly determined, the effect of concurrency will cancel out in the aggregate. To put it differently, while simply comparing a province with itself at different moments in time would violate the parallel-paths assumption – because within provinces, higher magnitudes are always (or never) collinear with (non-)concurrency – provinces that have a higher magnitude in midterm years are, as a group, comparable to those that have a higher magnitude in concurrent years, and thus the parallel-paths assumption is reasonable.
Formally, I fit models of the form:
 $$\matrix{ {Y_{{pt}} \,{\equals}\,\gamma \cdot Magnitude_{{pt}} {\plus}\mu _{p} {\plus}\delta _{t} {\plus}{\epsilon}_{{pt}} ,} \hfill \cr } $$
where Ypt is the outcome, Magnitude pt is the district magnitude of province p in year t, μ p and δ t are province and year fixed effects, and ε pt is the error term. The sample is restricted to provinces with an odd number of representatives. Since the model includes province fixed effects and Magnitude only varies by increments of one within provinces, this is equivalent to including a dummy indicating whether a province had a higher magnitude in a given year.
I also report two additional sets of results. Since a unit change in Magnitude should be more relevant in small provinces, I report separate results for the subsample of provinces that have a delegation size of five (see Table 1). To examine whether the effect of Magnitude is heterogeneous, in some specifications I interact it with Vote Third Party, the average percentage of the vote for president, national deputies, governor and provincial deputies obtained by the largest party other than the Partido Justicialista (PJ) or the Unión Cívica Radical (UCR) – Argentina’s two main political parties – in the founding 1983 election. This variable captures the capacity of regional elites to sustain a viable provincial party – no small feat in a heavily nationalized election like that of 1983, when the UCR and PJ captured 92 per cent of the presidential vote, 94 per cent of national legislative seats, most provincial legislative seats and nineteen of twenty-two governorships.Footnote 35 Arguably, Vote Third Party is different from the number of social cleavages in a province as commonly measured in the literature. In practice, however, this distinction is more apparent than real. On the one hand, the opposition between center and periphery, which often leads to the creation of regional parties – third parties in Argentina have rarely crossed provincial boundaries – has long been recognized as a distinctive social cleavage.Footnote 36 On the other, the theoretical argument about the heterogeneous effects of district magnitude is not about the underlying number of social cleavages per se, but rather about the effect of electoral rules when voters demand, and elites supply, multiple electoral alternatives. As long as multiple parties can claim substantial electoral support, it does not matter whether those parties represent ‘real’ social cleavages or rather elites’ capacity to sustain competitive party organizations; the relevant point is that voters faced at least three viable choices in the ballot, leading to more serious coordination problems than would have been the case otherwise.
Data
I employ six outcome variables. To measure electoral coordination, I look at # Lists Running, a count of the number of lists participating in the election; the effective number of parties in votes or ENPV, a weighted average of the number of lists contesting;Footnote 37 and Vote First Two, the combined vote percentage of the two most-voted lists. Higher values of the first two variables indicate a more fragmented playing field, while Vote First Two measures the extent to which voters tend to favor large parties. Thus, Magnitude should have a positive effect on the first two variables and a negative effect on the third. To examine the final distribution of seats, I look at how many parties received at least one seat, # List Seats; the effective number of parties in seats, ENPS; and the Gallagher Index, a measure of the disproportionality in the translation of votes into seats.Footnote 38 Again, the effect of Magnitude should be positive for the first two variables and negative for the third. Data for constructing these variables comes from Andy Tow’s Electoral Atlas, a website that provides district-level information on electoral returns in Argentina.Footnote 39 Table 2 presents the descriptive statistics, distinguishing between the main sample and the subset of ten provinces with a delegation size of five.
Descriptive Statistics
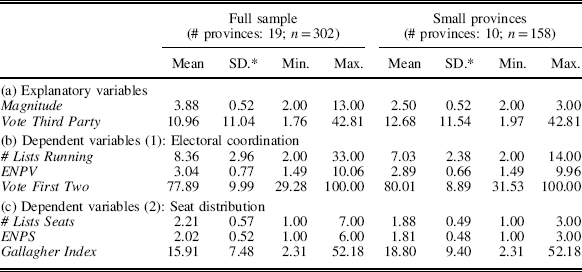
Note: (*) within-province standard deviation (except for vote third party, which does not vary over time).
To examine how the mechanical and psychological effects contribute to the final distribution of seats, I follow Fiva and Folke and employ a district’s actual vote distribution in year t as a counterfactual for that district’s vote distribution at t+1, and vice versa.Footnote 40 Then, I calculate both the actual and counterfactual distributions of seats at t and t+1; since there are multiple changes in district magnitude, I repeat the process for all subsequent pairs of years (t+2 and t+3; t+4 and t+5; and so on).
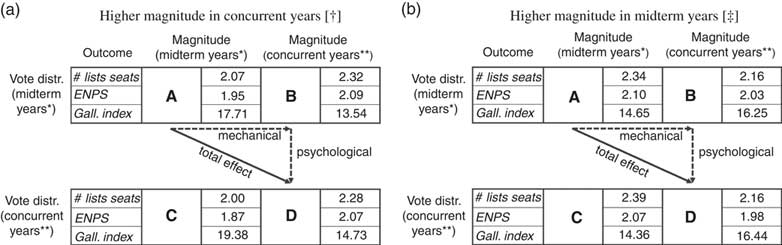
Consider Figure 1, which closely mirrors Figure 3 from Fiva and Folke.Footnote 41 In each panel, the top row indicates the mean values of the outcome variables based on the actual vote distributions from midterm years, while the bottom row does the same for concurrent years. The columns indicate whether district magnitude corresponded to that of midterm or concurrent years. Thus each panel is divided into four sectors: A and D indicate the actual values observed in midterm and concurrent years, respectively, while B reports the values that would have resulted from employing the vote distribution from midterm years to calculate the seat distribution in concurrent years, and the opposite is true for C. The figure is divided into two panels to underscore the fact that in some provinces district magnitude is higher in concurrent years, while in others it is higher in midterm years. Thus in Figure 1a, both # List Seats and ENPS increase (and the Gallagher Index decreases) as we move from A to B or D – implying an increase in Magnitude – while the opposite holds for Figure 1b.
Disaggregating the contribution of the mechanical and psychological effects to the final distribution of seats Note: A and D report the actual values of the outcome variables, while B and C indicate the values that would have resulted from counterfactual vote distributions. (*) 1985, 1989, 1993, 1997, 2001, 2005, 2009 and 2013. (**) 1987, 1991, 1995, 1999, 2003, 2007, 2011 and 2015. (†) Chubut, Corrientes, Formosa, La Rioja, Misiones, Río Negro, Salta, Santa Fe, Santiago del Estero, Tierra del Fuego (since 1991) and Tucumán. (‡) Catamarca, Chaco, Ciudad de Buenos Aires, Entre Ríos, La Pampa, Neuquén, San Luis and Santa Cruz.

The total effect of the electoral rules on the distribution of seats is the difference between A and D, that is, between the actual values observed in midterm and concurrent years. As noted by Fiva and Folke, this effect can then be decomposed into several subcomponents. The mechanical effect indicates what would happen if the vote distribution remained constant, but district magnitude changed; that is, it is the difference between actual outcome A and counterfactual outcome B.Footnote 42 The psychological effect is estimated as the change in outcomes that results from keeping the electoral rules constant, but updating the vote distribution – that is, the move from B to D. Note that this should not be interpreted as the effect of the electoral rules on the distribution of votes – what I call electoral coordination – but rather as the extent to which a change in the distribution of seats can be attributed to a change in the distribution of votes.
The distinction is relevant, because even a substantial change in the distribution of votes may not bring about a change in the distribution of seats. To see why, suppose that district magnitude increases from 2 to 3 in a scenario of three-party competition. If the distribution of votes does not change, this alone will guarantee a seat to the third-placed list. And since three lists are receiving one seat each, the seat distribution can only change if the most-voted list grabs an additional seat from the third-placed one, which requires either (a) a large increase in the vote share of the first- or second-placed lists or (b) a massive defection from the third-placed list in favor of lower-placed ones. The bottom line is that, if Magnitude increases from 2 to 3 and the three most-voted lists are close to each other, even a large change in the vote distribution need not alter the distribution of seats.
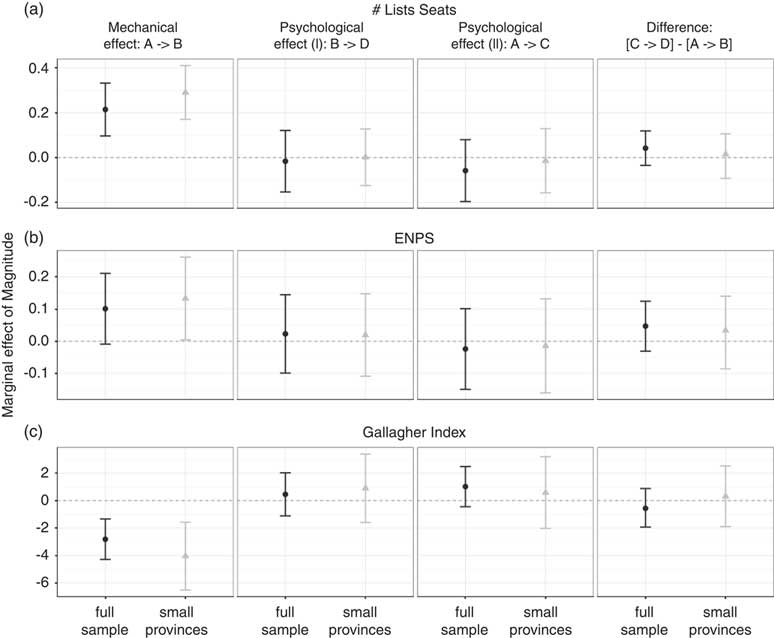
Finally, the psychological effect can be divided into two subcomponents. On the one hand, higher magnitudes may increase electoral support for small parties so much that these parties would have won representation even if district magnitude had remained constant. This effect is estimated as the difference between A and C. For the reasons discussed above, however, this is unlikely to be an issue in low-magnitude districts. On the other hand, there is what Taagepera and Shugart called the ‘law of conservation of disproportionality’: to the extent that the psychological effect increases voter support for small parties, the mechanical effect will be stronger than what would otherwise be the case.Footnote 43 In terms of Figure 1, this is the difference between moving from C to D – that is, keeping the vote distribution from concurrent years constant, while changing the number of seats to distribute – minus the mechanical effect; formally, [C→D]−[A→B].Footnote 44 Since this effect cannot be estimated directly, I estimated each of its two components separately, and calculated the standard errors by bootstrapping.Footnote 45
RESULTS
Balance Check
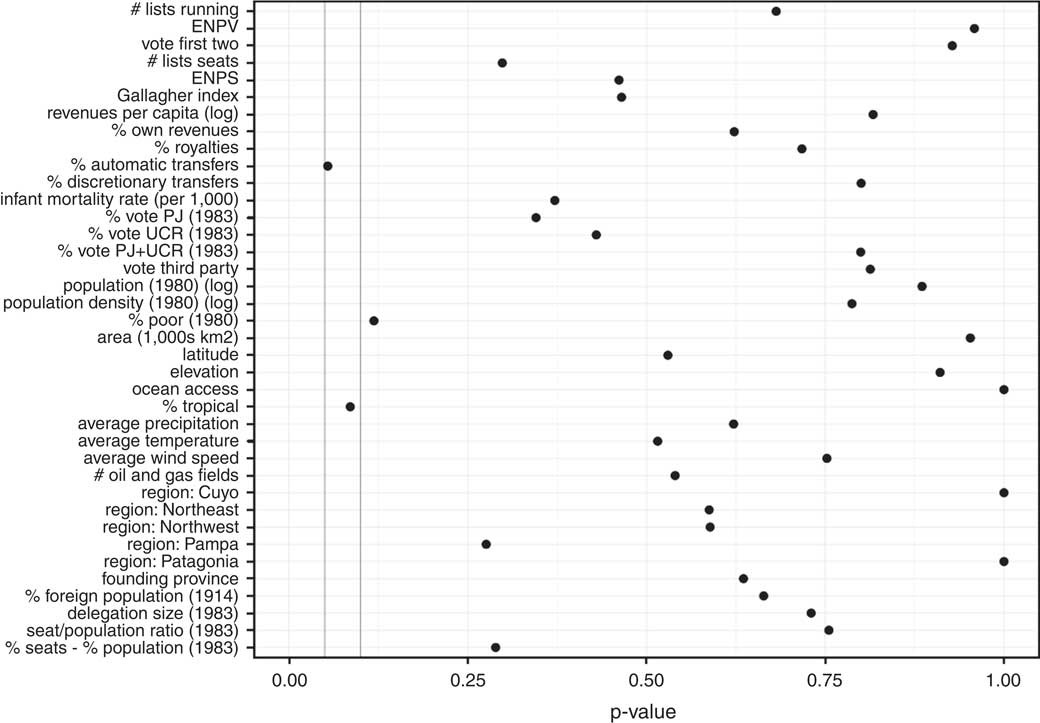
For the identification strategy to be valid, provinces that have a higher magnitude in midterm or concurrent years should not be systematically different in terms of their pre-treatment characteristics. Table 1 already showed that the electoral calendar does vary between provinces that elect a similar number of representatives: districts with a delegation size of five or nine are evenly divided; the two largest provinces have a higher magnitude in opposite years (concurrent in Santa Fe, midterms in the City of Buenos Aires); and among provinces with a delegation size of seven, one has a higher magnitude in midterm years and the other four in concurrent years. More systematically, Figure 2 shows that whether a province was assigned to have a higher magnitude in midterm or concurrent years is not systematically associated with other provincial characteristics. Specifically, the figure reports the exact p-values for the sharp null hypothesis that receiving a higher magnitude in midterm years had no effect on the distribution of thirty-eight pre-treatment covariates for any province.Footnote 46
Checking covariate balance Note: the dots report the exact p-values for the sharp null hypothesis that having a higher magnitude in midterm years has no effect on any province. See the Appendix for further details.

Consistent with the claim that assignment to either group was randomly determined, only two differences are statistically significant at the 0.10 level: the percentage of a province’s land area covered by (sub)tropical biomes and the percentage of 1983 provincial revenues that came from automatic transfers from the national government. This is unlikely to be an artifact of the small sample size: most p-values are quite large, and Appendix Table A1 shows that the substantive difference in means between both groups is quite small.
Electoral Coordination
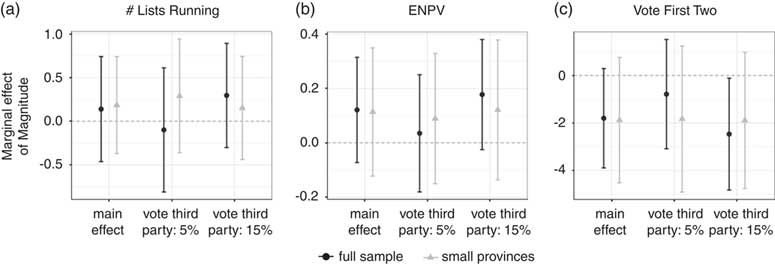
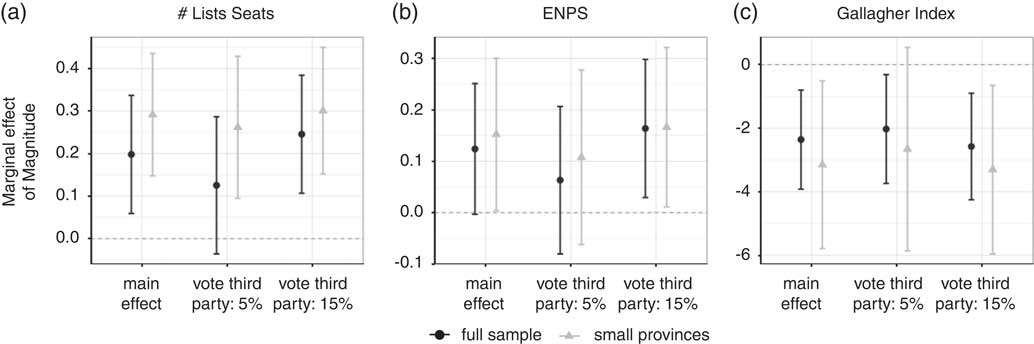
To facilitate interpretation I present the results graphically, relegating all tables to the Appendix. Figure 3 reports the point estimates and 95 per cent confidence intervals of the marginal effect of Magnitude on different measures of electoral coordination. The confidence intervals are calculated using robust standard errors clustered by province, and adjusted on the basis of t-scores from a Student distribution with 18 (or 9) degrees of freedom rather than the usual z-scores. I present the results for both the unconditional effect of Magnitude, and the conditional effect when a party other than the PJ or the UCR obtained 5 or 15 per cent of the vote in 1983, respectively. I also report separate estimates for the full sample and the subset of provinces with a delegation size of five.
Point estimates and 95 per cent confidence intervals for the effect of district magnitude on electoral coordination in Argentina, 1985–2015 Note: all values are based on the results reported in Appendix Table A2.

Figure 3a shows that district magnitude has little effect on the number of lists competing in a race: the estimated effect is positive but substantively small, and the confidence intervals are very wide. This likely reflects the combination of two forces. Since establishing a party that has a realistic chance of winning seats entails a long-term investment, strategic politicians should not be overtly responsive to changes in magnitude that are expected to be short term. Moreover, the fact that hopeless lists are pretty common in Argentina suggests that for many parties the decision to run is not motivated by the prospect of winning a seat.Footnote 47
The next two panels show that higher magnitudes increase the effective number of parties in votes and reduce the vote share of the two most-voted parties, though both effects fall short of statistical significance at conventional levels. Specifically, a one-unit increase in Magnitude increases the effective number of parties in votes by 0.12, a value comparable to that reported by other authors.Footnote 48 To put this number in perspective, consider what would happen if Argentina simplified its electoral calendar, holding legislative elections every four years instead of two. This would increase the median district magnitude from 3 to 6.5 (see Table 1), which would translate into 0.42 more effective parties – a 14 per cent increase over the average number of parties in the sample, and more than half the within-province standard deviation for this variable (see Table 2). The effect is even stronger when Vote Third Party ≥15 per cent, though neither of these estimates is statistically significant at conventional levels. There is little difference between the full sample and small provinces.
Figure 3c shows that a one-unit increase in Magnitude decreases the percentage of the vote obtained by the two largest parties by 1.8 percentage points. In concrete terms, this means that simplifying Argentina’s electoral calendar would increase electoral support for small parties by 6.3 percentage points, a substantial effect considering that Vote Third Party averaged 22 per cent during the study period (see Table 2). The effect is only statistically significant at the 0.10 level, though the estimate is substantively larger (and significant at the 0.05 level) when a third party obtained 15 per cent of the vote or more in 1983. Again, there is little variation by district size.
Distribution of Seats
Figure 4a shows that a one-unit increase in Magnitude translates into 0.2–0.3 parties gaining representation in the national legislature, an effect comparable to changing the electoral formula in municipal elections in Norway.Footnote 49 Were Argentina to simplify its electoral calendar, the number of lists gaining representation would increase by 0.7 per province, which would translate into 0.70×24=17 additional lists in the chamber. The results are stronger for small provinces and for districts in which a third party did better in 1983, though the corresponding estimates are not statistically distinguishable from the main effects for the full sample.
Point estimates and 95 per cent confidence intervals for the effect of district magnitude on the distribution of seats in Argentine lower house elections, 1985–2015 Note: all values are based on the results reported in Appendix Table A3.

Figure 4b shows that a one-unit increase in Magnitude increases the effective number of parties gaining representation by 0.12–0.15. This effect is roughly half the size of that found by other authors in Spain or Norway,Footnote 50 and implies that if the Argentine electoral calendar were simplified, the average ENPS would increase by about 0.40 – four-fifths of the within-province standard deviation (see Table 2). The effect is larger for small provinces and those where a third party did better in 1983, though the magnitude of the difference is modest.
The last panel of Figure 4 shows that higher magnitudes are also associated with a more proportional translation of votes into seats. The size of the effect is four to six times larger than that reported by Fiva and Folke,Footnote 51 though admittedly the baseline level of disproportionality was much lower in Norway. To put these numbers in perspective, an increase in Magnitude from 3 to 6.5 would cut disproportionality by more than half, from 15.9 to 7.7. The effect is somewhat stronger for small provinces, contradicting Taagepera and Shugart’s suggestion that increasing district magnitude from 2 to 3 may result in more disproportional outcomes. Nonetheless, the fact that the confidence intervals for these provinces are comparatively wider than before suggests that there are some instances in which increasing Magnitude from 2 to 3 did increase electoral disproportionality.
Decomposing the Mechanical and Psychological Effects
Figure 5 shows that these results are almost entirely driven by the mechanical effect. For both the full sample and the subset of small provinces, the estimate for the mechanical effect is almost identical in size to the main effects reported in Figure 4, while estimates of the psychological effect are generally centered at zero. As mentioned above, this does not mean that there is no psychological effect in the sense that an increase in district magnitude does not prompt a change in the distribution of votes, but rather that whatever changes there are in the distribution of votes, they are not strong enough to bring about a change in the distribution of seats. In particular, when Magnitude equals 2 or 3 – two-thirds of the sample – a pattern of three-party competitionFootnote 52 will result in a 1–1 or 1–1–1 distribution of seats. In other words, increasing Magnitude will increase the (effective) number of lists receiving seats by one, all by virtue of the mechanical effect. For the psychological effect to make a difference, voters should become either much more willing to support the two largest parties or to desert the third-placed one so that the seat distribution becomes 2–1–0. Alternatively, when there are only two strong parties,Footnote 53 an increase in Magnitude from 2 to 3 will change the seat distribution from 1–1 to 2–1–0; the psychological effect can only make a difference if the vote share of the third-placed list increases substantially.
Point estimates and 95 per cent confidence intervals for the contribution of the mechanical and the psychological effects to the distribution of seats in Argentina, 1985–2015 Note: all values are based on the results reported in Appendix Table A4.

Of course, these results may also reflect the fact that district magnitude has no effect on the distribution of votes. The fact that the results reported in Figure 3 are not always statistically significant at conventional levels gives credence to this interpretation. However, this argument is subject to two objections. The estimates of Figure 3, while not entirely precise, go in the expected direction and are substantively meaningful; in contrast, the estimates for the psychological effects are very close to zero. Moreover, the psychological effects need not be associated with equivalent changes in the distribution of votes: for example, the 2003 electoral reform in Norway had a sizable psychological effect, despite failing to change the ENPV.Footnote 54
Robustness and Placebo Tests
These results are robust to several specification changes. One potential concern is that the confidence intervals are too narrow because they do not take into account the small number of provinces included in the sample. This is unlikely to be an issue, as the intervals are already adjusted using a Student distribution with 9–18 degrees of freedom, and the distribution of the explanatory variable is identical for all provinces. Nonetheless, Appendix Tables A2 and A3 show that calculating the 95 per cent confidence intervals on the basis of the wild bootstrap procedure proposed by Cameron et al.Footnote 55 produces identical results. Alternatively, the results may be driven by a handful of districts in which the effect of Magnitude is particularly large. To account for this possibility, I replaced the outcome variables with their rank-based versions – that is, I assigned a value of 1 to the observation with the lowest value within a province, 2 to the second-lowest, and so on until 16 – thus ensuring that the outcome variables have the same distribution for all provinces. The results remain the same, with the exception of the effective number of parties in seats. Closer inspection shows that this is due to the fact that in districts that combine two-party competition with a delegation size of five, increasing Magnitude from 2 to 3 usually changes the distribution of seats from 1–1 to 2–1–0, thus reducing the ENPS from 2 to 1.8.Footnote 56 While modest in absolute terms, this effect wreaks havoc on the rank-based variables, which weight all increases or decreases equally.
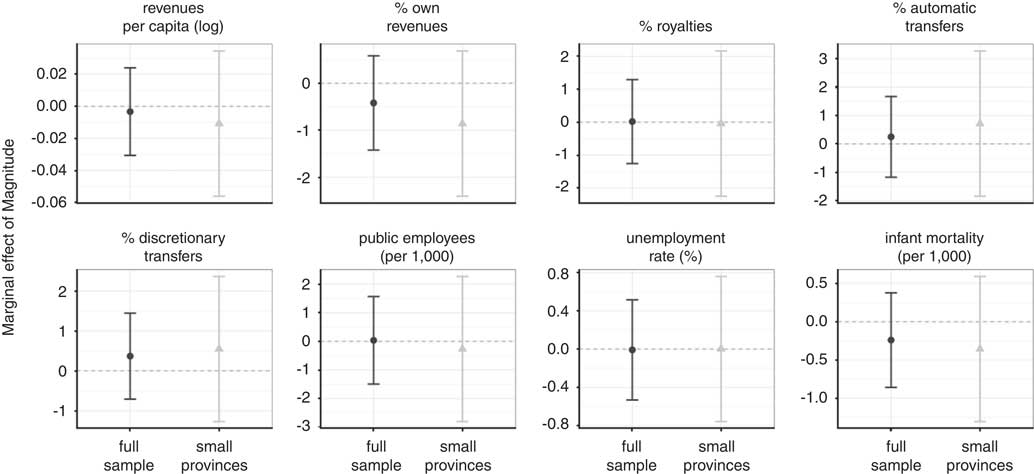
Finally, Figure 6 reports the results for a series of placebo tests in which the outcome is a time-varying covariate that should not be affected by periodic changes in district magnitude – such as provincial revenues, the number of public employees, or the unemployment and infant mortality rates.Footnote 57 Consistent with the claim that district magnitude should have no effect on these outcomes, the point estimates are not only statistically insignificant, but very close to zero in substantive terms.Footnote 58
Point estimates and 95 per cent confidence intervals for the effect of district magnitude on some time-varying pseudo-outcomes that should not be affected by electoral rules Note: all values are based on the results reported in Appendix Table A5.

DISCUSSION AND CONCLUSION
A decade ago, Matthew Shugart celebrated the maturity of the literature on electoral systems while lamenting the scarcity of ‘crucial experiments’ that could isolate the effects of electoral rules from those of other factors that shape electoral outcomes.Footnote 59 Political scientists (and some economists) responded to this appeal by devising ingenious designs to find evidence of contamination effects in mixed-member systems,Footnote 60 identifying the effect of double-ballot rules on electoral coordination,Footnote 61 determining how the mechanical and psychological effect shape the distribution of seats,Footnote 62 examining the impact of closed-list PR on voter turnout,Footnote 63 determining whether district magnitude increases the number of parties,Footnote 64 or comparing the effects of single-member plurality and multiple non-transferable-votes systems.Footnote 65
By exploiting the peculiar nature of Argentina’s electoral calendar in order to identify the effect of district magnitude on electoral coordination and the distribution of seats, this article clearly places itself within the ‘credibility revolution’ in the study of electoral systems. In so doing, it extends this literature in two ways. First, it focuses on the effect of district magnitudeFootnote 66 rather than the electoral formulaFootnote 67 or a combination of the two.Footnote 68 Secondly, while existing studies have focused on either the distribution of votes before seats are countedFootnote 69 or the relative contribution of the mechanical and psychological effect to the final distribution of seats,Footnote 70 this study examines both sets of outcomes.
The analysis underscores four main findings. First, short-term changes in district magnitude do not encourage party entry, though they do seem to increase voters’ propensity to support small parties. Secondly, even modest changes in Magnitude have a meaningful effect on both the (effective) number of lists that gain legislative representation and the disproportionality in the translation of votes into seats. Thirdly, this second effect is driven by the mechanical rather than the psychological effect of electoral rules. Finally, district magnitude appears to make more of a difference (a) in small districts and (b) among provinces that had a stronger third party in 1983, though neither effect is especially large.
Of course, these findings are more relevant if they can be extrapolated beyond Argentina. In this regard, it is worth noting that the external validity of the results is enhanced by two factors. First, these findings are consistent with previous studies: while several authors have shown that electoral rules affect voters’ support for small parties,Footnote 71 the evidence that the electoral system also affects party entry has been mixed.Footnote 72 Similarly, while the psychological effect matters for the distribution of seats in Norwegian municipalities, the mechanical effect is much larger in size.Footnote 73 Secondly, the results are consistent with theoretical expectations: higher magnitudes increase support for small parties, make them more likely to win seats, and reduce the disproportionality in the translation of votes into seats. Had the results been more ad hoc, it would be harder to claim that they are valid in other contexts; since this is not the case, the claim that they reflect universal features of electoral rules rather than the peculiarities of the Argentine case gains credibility.
That said, the structure of Argentina’s electoral calendar poses some limitations on the generalizability of the findings. Since district magnitude only changes by increments of 1, the results may offer a poor guide to what we could expect following a dramatic increase (or decrease) in district magnitude. Furthermore, the fact that magnitude oscillates in a predictable way means that the results can only identify the effect of short-term changes that are (correctly) perceived as being short term. This may be one of the reasons why variations in magnitude do not affect party entry: if party elites anticipate that district magnitude is going to oscillate, they will be less likely to invest in a new party organization based on short-term considerations. Whether this means that the strategic considerations of these politicians are driven by the lowest or highest values of district magnitude within a province is unclear, however: perhaps strategic elites decide not to run even when magnitude increases because they anticipate that they will do badly two years later; alternatively, the lure of winning office in higher-magnitude years may increase the propensity to field candidates in low-magnitude elections as well. On the bright side, exploiting the oscillation of the electoral calendar over a thirty-year period rather than looking at what happens just before or after an electoral reform ensures that the results are not being driven by a handful of elections.
Finally, this article joins a large literature that has taken advantage of the exogenous variation provided by a staggered electoral calendar to study a variety of political phenomena, including legislative careers and behavior,Footnote 74 electoral fraud,Footnote 75 coattail effects,Footnote 76 and mobilization and turnout.Footnote 77 Along with the work of Crisp and Demirkaya, who take advantage of a similar design to study senatorial elections in Brazil,Footnote 78 this article shows how staggering legislative elections may provide a unique opportunity to identify the causal effect of electoral rules. Given that such calendars are relatively common,Footnote 79 one hopes that additional opportunities of this kind will be discovered soon.