Introduction
The developmental regulation of eye growth and so refractive errors, otherwise known as emmetropization, is an active process guided by visual experience (Norton et al., Reference Norton, Essinger and McBrien1994; Diether & Schaeffel, Reference Diether and Schaeffel1997; Wildsoet, Reference Wildsoet2003). It can be demonstrated experimentally using defocusing lenses to artificially create refractive errors in young animals. For example, myopia can be induced in chicks with negative lenses that shift the image plane behind the retina. The eye corrects for the mismatch between the retina and location of the focused image by increasing its axial length. Conversely, positive lenses inhibit eye elongation. Animal model studies involving the use of defocusing lenses to artificially impose refractive errors on young animals point to an important role of the choroid in emmetropization (Wallman et al., Reference Wallman, Wildsoet, Xu, Gottlieb, Nickla, Marran, Krebs and Christensen1995; Wildsoet & Wallman, Reference Wildsoet and Wallman1995; Nickla et al., Reference Nickla, Wildsoet and Wallman1998; Nickla & Wallman, Reference Nickla and Wallman2010; Zhang & Wildsoet, Reference Zhang and Wildsoet2015).
Relevant studies involving young chicks revealed rapid changes in choroidal thickness (CT), in a matter of minutes as measured by high resolution A-scan ultrasonography, thickening in response to myopic defocus (e.g., imposed with positive lenses) and thinning in response to the hyperopic defocus (e.g., imposed with negative lenses) (Wallman et al., Reference Wallman, Wildsoet, Xu, Gottlieb, Nickla, Marran, Krebs and Christensen1995; Wildsoet & Wallman, Reference Wildsoet and Wallman1995).
Changes in CT in response to applied optical defocus, albeit smaller in scale, have also been documented in tree shrew, marmoset, guinea pigs, and even humans (Siegwart & Norton, Reference Siegwart and Norton1998; Troilo et al., Reference Troilo, Nickla and Wildsoet2000; Howlett & McFadden, Reference Howlett and McFadden2009; Mcbrien et al., Reference Mcbrien, Young, Pang, Hammond, Baird, Saw, Morgan, Mutti, Rose, Wallman, Gentle, Wildsoet, Gwiazda, Schmid, Smith, Troilo, Summers-Rada, Norton, Schaeffel, Megaw, Beuerman, Mcfadden and Rose2009; Nickla & Wallman, Reference Nickla and Wallman2010; Read et al., Reference Read, Collins and Sander2010).
Traditionally, signals from the central retina, and in humans, from the fovea, have been thought to dominate emmetropization. Nonetheless, more recent investigations point to important contributions of the peripheral retina in guiding ocular growth (Atchison et al., Reference Atchison, Pritchard, Schmid, Scott, Jones and Pope2005; Smith et al., Reference Smith, Kee, Ramamirtham, Qiao-Grider and Hung2005, Reference Smith, Ramamirtham, Qiao-Grider, Hung, Huang, Kee, Coats and Paysse2007; Mutti et al., Reference Mutti, Hayes, Mitchell, Jones, Moeschberger, Cotter, Kleinstein, Manny, Twelker, Zadnik and Study2007; Aller & Wildsoet, Reference Aller and Wildsoet2008; Liu & Wildsoet, Reference Liu and Wildsoet2011; Smith, Reference Smith2013). However, fully characterizing the relevant ocular changes has proven challenging. While off-axis (peripheral) refractive errors are readily measured, they are affected by off-axis changes in the optics of the eye, and thus need not provide an accurate picture of ocular shape changes yet current methods for evaluating local ocular shape changes are limited. More recent studies involving animal models have made extensive use of in vivo high resolution A-scan ultrasonography (Wallman & Adams, Reference Wallman and Adams1987), which allows sampling across multiple time points efficiently and accurately, i.e., at the micron scale but it is limited to on-axis measurements. This approach neither allows the spatial location of the measured site to be accurately identified nor allows reproducible measurement at off-axis (paracentral and peripheral) sites. Some of the limitations of this ultrasonography measurement protocol are avoided with in vivo magnetic resonance imaging (Troilo et al., Reference Troilo, Nickla and Wildsoet2000; Atchison et al., Reference Atchison, Jones, Schmid, Pritchard, Pope, Strugnell and Riley2004), but this approach has practical and economic limitations. Alternative in vitro approaches involving photography of tissue slices or block faces also have significant limitations, including distortions and shrinkage from fixation, embedding and/or sectioning, all of which contribute noise to the data; repeated measurements over time are also precluded in all in vitro approaches (Zeng et al., Reference Zeng, Bowrey, Fang, Qi and McFadden2013).
Advances in spectral domain-optical coherence tomography (SD-OCT) now allow three-dimensional in vivo imaging of the retina and choroid in clinical and research settings, with the capacity to track small changes in the living eye over time (Abràmoff et al., Reference Abràmoff, Garvin and Sonka2010; Jia et al., Reference Jia, Bailey, Hwang, McClintic, Gao, Pennesi, Flaxel, Lauer, Wilson, Hornegger, Fujimoto and Huang2015). A previously published paper demonstrated the potential utility of this technology for studies involving the chick model; the retinal nerve fiber layer (NFL) and ganglion cell layer (GCL) were shown as a three-dimensional spatial map (Moayed et al., Reference Moayed, Hariri, Song, Choh and Bizheva2011). However, this study did not assess longitudinal changes and was limited to one bird. On the other hand, we have shown the utility of this imaging technology used in combination with built-in digital calipers, for tracking regional CT changes over time in multiple chicks (Nava et al., ARVO abstracts, Reference Nava, Hammond and Wildsoet2012, Reference Nava, Chang, Ostrin, Chen and Wildsoet2013). In another study, the profiles of pixel brightness across the fundal layers were used to extract CT data (Lan et al., Reference Lan, Feldkaemper and Schaeffel2013). However, in the latter three cases, analyses were limited to just one point and potential regional variations were ignored.
The lack of tools for objectively and efficiently characterizing changes in both spatial and temporal domains represents an obvious limitation of the technology as previously applied. The study described here addressed the above deficiencies. Its main purposes were to develop (1) a protocol for SD-OCT imaging of the retina and choroid in the chick, and (2) analytical tools to efficiently map the thicknesses of these tissues in three dimensions. We hypothesized that 3-D OCT analyses might reveal previously undetected regional asymmetries in CT changes, with the potential to provide new insights into underlying biological mechanisms. For this purpose, we modified the Iowa Reference Algorithms for choroid segmentation (Zhang et al., Reference Zhang, Lee, Niemeijer, Mullins, Sonka and Abràmoff2012, Reference Zhang, Buitendijk, Lee, Sonka, Springelkamp, Hofman, Vingerling, Mullins, Klaver and Abràmoff2015) for analysis of SD-OCT scans obtained from the eyes of young chicks. Using the same approach, we were also able to identify and reproducibly localize the retinal area centralis, which was used as a landmark for image registration, the chick retina being both afoveate and avascular.
Materials and methods
Animals, rearing & lens treatments
White-Leghorn chicks were hatched on-site from fertilized eggs (Poultry Science division of University of California Davis School of Veterinary Medicine, California), and raised in open mesh cages under diurnal light (12 h lights on, 12 h lights off), with food and water ad libitum. At 7 days of age, single vision +15 D defocusing lenses were affixed over one eye of 15 chicks using Velcro support rings as described previously (Nickla et al., Reference Nickla, Wildsoet and Wallman1998). The contralateral fellow eyes served as controls. The lenses were checked at regular intervals across each day of the wearing period for centration and cleaned as necessary. The lens treatment effects were assessed using both A-scan ultrasonography and SD-OCT, across a total lens treatment period of 3 days.
All animal care and treatments used in this study conformed to the ARVO statement for the use of Animals in Ophthalmic and Vision Research. Experimental protocols were approved by the Animal Care and Use Committee of the University of California Berkeley.
As high resolution A-scan ultrasonography has become the gold standard for measuring choroidal and retinal thicknesses in animal model studies of myopia, values obtained by A-scan ultrasonography were directly compared with on-axis measurements of the same from OCT images, i.e., in the area centralis, obtained using digital calipers.
A-scan ultrasonography
On-axis (axial) ocular dimensions were measured under gaseous anesthesia (1.5% isoflurane in oxygen) using high frequency A-scan ultrasonography. It made use of a custom-built system involving a 30 MHz polymer transducer (Panametrics Model 176599 Waltham, NC) sampled at 100 MHz with a Sonix 810 A/D board in a computer, with an estimated resolution of ∼10 µm (Wallman & Adams, Reference Wallman and Adams1987; Wallman et al., Reference Wallman, Wildsoet, Xu, Gottlieb, Nickla, Marran, Krebs and Christensen1995; Wildsoet & Wallman, Reference Wildsoet and Wallman1995; Nickla et al., Reference Nickla, Wildsoet and Wallman1998). For each measurement, at least 15 traces were captured per eye and analyzed off-line. Although this method allows measurement of the axial dimensions of all ocular components, including the thicknesses of the three layers making up the back wall of the eye, i.e., retina, choroid, and sclera, only the choroidal data are reported here. The region sampled with this technique is expected to fall within the area centralis, near the crossing point for subdividing the maps derived from OCT imaging data into quadrants, as described below.
In vivo SD-OCT imaging
Imaging made use of a Bioptigen SD-OCT( Bioptigen, NC, USA). This instrument has an axial resolution of approximately 4 µm (Kiernan et al., Reference Kiernan, Mieler and Hariprasad2010). The instrument uses a wavelength of 840 nm, and a scan rate of approximately 32,000 A-scans per second. Images were collected from both eyes of all animals, starting one day before the lenses were attached (at day 7), with additional images collected 1 and 3 days after the initiation of lens wear, always between 12:00 noon and 4:00 pm, to take into account possible diurnal variations in the thicknesses of the ocular layers of interest (Nickla et al., Reference Nickla, Wildsoet and Wallman1998). For imaging, chicks were first anesthetized with a cocktail of ketamine and xylazine (30 mg/kg, 3 mg/kg, respectively given by intramuscular injection), then placed on a custom-made stage with x–y–z adjustments, a lid speculum inserted, and finally their position adjusted to align the optical axis of the eye being imaged with the optical axis of the SD-OCT instrument. Eye movements or motion artefacts were avoided with the dose of ketamine (anesthesia) and xylazine (muscle relaxant) administered to the chicks prior to the data acquisition.
One of the main challenges in aligning OCT scans from the chick is the lack of retinal blood vessels, which are commonly used landmarks in other animals. As an alternative landmark to aid alignment, we used the ocular pecten, a black triangular-shaped structure overlying and obscuring the optic nerve head. Alignment was considered optimal when the probe was properly positioned such that the tip of the pecten was near the center of the software acquisition window and the body of the pecten was visible in the inferior nasal retina, oriented at approximately 45 degrees. The position of the reference arm was adjusted so that the B-scan was flat as opposed to either convex or concave. For all eyes, a low resolution scout scan was first captured to ensure that the probe was appropriately positioned and then a high resolution OCT scan consisting of 500 B-scans by 400 A-scans with a 14 by 14 mm field captured, in accord with the imaging protocol for the Bioptigen SD-OCT unit. Three such scans were collected from each eye at each time point. Only the high-resolution scans were used for analyses.
SD-OCT image analysis
Detection of the area centralis
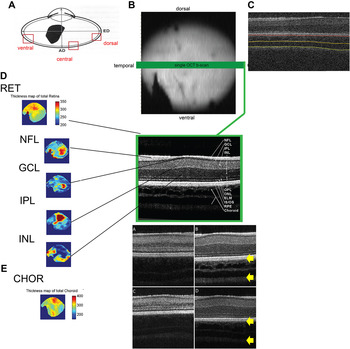
As noted in the introduction, the area centralis was used as a critical landmark for image registration, and more importantly as the crosspoint for demarcating and thus aligning the four quadrants into which CT maps were subdivided for analytical purposes. The area centralis was located (Fig. 1), after applying the Iowa Reference Algorithms to segment the total retina, GCL and NFL (Zhang et al., Reference Zhang, Lee, Niemeijer, Mullins, Sonka and Abràmoff2012, Reference Zhang, Buitendijk, Lee, Sonka, Springelkamp, Hofman, Vingerling, Mullins, Klaver and Abràmoff2015). The total retinal thickness map (Fig. 1C) thus derived revealed an area with the greatest thickness superior and nasal to the tip of the pecten. Thickness maps of the GCL (Fig. 1D) and NFL (Fig. 1E) also show regional specialization in the same area, the former showing thickening, and the latter, thinning. These features are characteristic of the chick area centralis, as described histologically (Ehrlich, Reference Ehrlich1981). This region was used as the central point for subsequently segmenting the scans into four quadrants (see choroidal segmentation below).
Sample spectral domain-optical coherence tomography scan from one eye (A) of a 7-day old chick and characterization of the retinal area centralis. A volumetric scan (B) containing 100 B-scans and 400 A-scans per B-scan, was segmented. The image to the right (C) represents a single B-scan (green line) derived from the volumetric scan to highlight the retina/choroid interface (red) and choroid/sclera (yellow) interface for choroidal map. A zoomed in version of this shows the retinal sublayers. Derived thickness maps from the segmentation of the entire retinal volume (D), include total retina thickness map showing local thickening (red area in the superiotemporal region) demarcating the area centralis, which averaged 350 µm in thickness, nerve fiber layer thickness map showing thinning in the region of the area centralis and thickening near the optic nerve/pecten, ganglion cell layer thickness map showing an elongated thickened region extending from the tip of the pecten to the superior nasal retina; maps for the inner plexiform layer and inner nuclear layer are also shown; the wedge-shaped pecten is visible in the lower field of all maps. Choroidal thickness map (CHOR, E) derived from segmentation high resolution images showing the retina/choroid interface and choroid/sclera (yellow arrows) also shown (lower right).

Choroidal segmentation using the Iowa Reference Algorithms
To construct regional thickness maps of the choroid, we adapted the Iowa Reference Algorithms to segment the choroid for each A-scan in the entire OCT volume. In brief, retinal layers were first segmented using the previously reported intraretinal layer segmentation method (Garvin et al., Reference Garvin, Abràmoff, Wu, Russell, Burns and Sonka2009; Lee et al., Reference Lee, Niemeijer, Garvin, Kwon, Sonka and Abràmoff2009). The choroid layer is readily identified as that beneath and immediately adjacent to Bruch’s membrane. A sufficiently large subvolume containing the choroid was then selected as the target region on which choroidal segmentation, using a dual-surface graph-based method to segment choroidal surfaces can be performed. Vertical intensity gradients were used to form the cost images. Smoothness constraints were adopted between neighboring A-scans to adjust the smoothness of the segmented surfaces. The choroidal surfaces were subsequently segmented using graphical optimization, and solving for the minimum s–t cut in the employed geometric graph (Zhang et al., Reference Zhang, Lee, Niemeijer, Mullins, Sonka and Abràmoff2012, Reference Zhang, Sonka, Folk, Russell and Abràmoff2014).
Quadrant quantification of the choroid
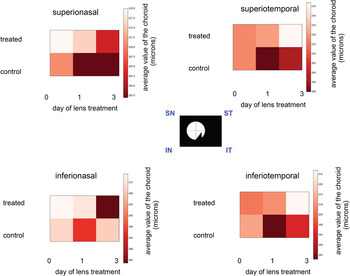
A Matlab-based script was used to divide the resulting choroidal and total retinal thickness maps into 4 quadrants intersecting at the area centralis (see Figs. 1 and 4). The average CT was calculated for each of the quadrants, referred to as inferiotemporal (IT), inferionasal (IN), superionasal (SN), and superiotemporal (ST). Averages were calculated for treated and fellow control eyes of each lens treatment group and compared using repeated measures ANOVA (SPSS, IBM Inc.). Color maps showing regional variations in choroidal thicknesses as well as variations across time and between pairs of eyes were also derived. The data were also analyzed statistically using mixed level (two way) repeated measures ANOVAs, with time and region as within-subjects factors, and lens treatment as the between-subjects factor, followed by post-hoc testing (SPSS, IBM Inc.). For each CT map, a global thickness value, representing the average across the entire map, was also derived for use in some analyses.
On-axis to global CT ratio
To evaluate the temporal relationship between on-axis changes in CT and global CT changes over the lens treatment period, the ratio of these two parameters was derived and changes with time examined. Differences between lens-treated eyes and contralateral control eyes were analyzed using paired t-tests (SPSS, IBM Inc.).
Reproducibility
To quantify the reproducibility of repeated measurements performed by the same observer at different visits, we calculated the repeatability, reproducibility and intraclass coefficients (ICCs) for obtaining global choroid measurements.
Results
Effect of imposed myopic optical defocus on on-axis (central) CT
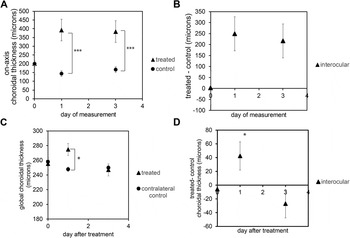
Consistent with the results of previous studies (Wallman et al., Reference Wallman, Wildsoet, Xu, Gottlieb, Nickla, Marran, Krebs and Christensen1995; Wildsoet & Wallman, Reference Wildsoet and Wallman1995), A-scan ultrasonography detected significant choroidal thickening in the eyes fitted with positive lenses (Fig. 2), with most of the changes occurring within the first day of lens wear, with minimal additional choroidal thickening over the remaining 2 days of the treatment period. Treated eyes recorded a net increase in CT of 190.9 ± 10.9 µm over the first day. In contrast, for contralateral control eyes, CT changes were not significant. These interocular differences in behavior and changes over time were verified statistically (two-way repeated measures ANOVA, between subjects (lens), F = 59.078, P < 0.0001, within subjects (time), F = 4.427, P < 0.05).
On-axis choroidal thickness (CT) data plotted as a function of treatment day, for lens-treated and contralateral (control) eyes measured using high frequency A-scan ultrasonography (means ± standard error of the mean, SE shown) (A, n = 15) and global CT data, derived using the segmentation algorithm on optical coherence tomography images (C, n = 15). Derived interocular differences in CT normalized to day 0 (B and D). Most of the lens-induced central choroidal thickening occurred within the first day of lens treatment, with values for both treated and control eyes changing minimally thereafter, as reflected in the relative stability of interocular differences from days 1 to 3 of the treatment period. Global choroidal thicknesses (C and D), for treated eyes show a significant increase after 1 day of lens treatment (P < 0.05) but this effect is transient and no longer evident by day 3; values for control eyes changed little over the same period. Interocular differences further illustrate the global thickening in treated eyes after one day of treatment and slight thinning relative to control eyes on day 3.

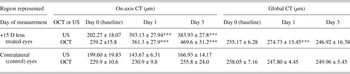
Irrespective of whether on-axis CT data were collected with A-scan ultrasonography or OCT, choroidal thickening is apparent in lens-treated eyes on day 1 and day 3 compared to values from contralateral control eyes (Table 1, P < 0.05), and equivalent values collected with each of the techniques were comparable.
Summary of choroidal thickness (CT) data (mean ± SE), captured from lens-treated and contralateral control eyes over a 3-day lens treatment period for the area centralis (on-axis region, left column), using high frequency A-scan ultrasonography (rows 1 and 3), and spectral domain-optical coherence tomography (SD-OCT) imaging (rows 2 and 4), and global averages derived from SD-OCT images using 3-d segmentation (right column) a .

a ***P < 0.001, least significant difference post-hoc test.
Furthermore, to investigate the repeatability of the segmentation algorithm in extracting CT data, several OCT scans from each eye of four birds were taken for analysis. The coefficient of variation derived from these scans for the choroid was 2.60%. The intraclass correlation derived was 0.9839 (P < 0.0001).
Effect of treatment on global CT
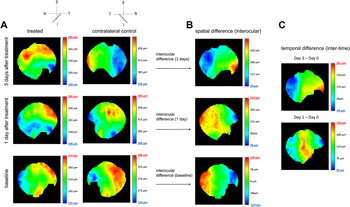
Representative CT maps for a treated eye and its contralateral fellow and the three measurement time points are shown in Fig. 3 along with derived interocular (spatial) and inter-time (chronological) difference maps. The choroids of young untreated chicks showed relatively little variation in thickness across the sampled areas (Fig. 3A, baseline maps), but this picture changed after the initiation of the monocular lens treatments, which induced a relatively localized choroidal thickening in lens-wearing eyes, while also apparently perturbing CT in the contralateral eyes, although the changes were more subtle. By deriving interocular difference maps, it was possible to characterize and quantify asymmetries in the changes in treated and control eyes (Fig. 3B). Chronological difference maps were subsequently derived from these interocular difference maps to graphically illustrate changes over the treatment period (Fig. 3C).
Choroidal thickness maps for treated and contralateral control eyes (A) for a representative chick fitted with a monocular +15 D lens, and imaged prior to (baseline), as well as after 1 and 3 days of treatment, derived interocular (treated–control) spatial difference maps for the same time points (B), and chronological interocular difference maps (C) (day 1–0 & day 3–0). The insert at top left provides orientation reference, S-superior, N-nasal, T-temporal, I-inferior, with the slanted line denoting the location of the pectin.

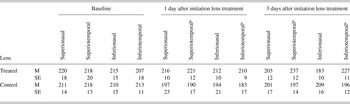
To allow regional differences to be tested statistically, thickness values were derived for each of four quadrants, centered on the area centralis. Data are shown in Fig. 4 and summarized in Table 2. Statistical analyses using a mixed repeated measures ANOVA, with lens treatment as a between-factor and choroidal quadrant and time as within-subject factors, revealed a significant overall effect of quadrant (F = 3.163, P < 0.05), as well as interactions between time, quadrant, and lens (F = 2.766, P < 0.05). Pairwise comparisons based on estimated marginal means revealed a significant difference between superiotemporal and inferiotemporal quadrants (P < 0.05, Table 2, Fig. 4).
Regional choroidal thicknesses, for each of the four quadrants and each measurement time point as shown, for both the lens-treated and contralateral control eyes of 15 chicks. S-Superior, N-nasal, I-inferior, T-temporal.

Mean choroidal thicknesses (M) and standard error (SE), for each of the four quadrants and each measurement time point

a Significance value <0.05 based on mixed-design repeated measures ANOVA.
Global CT values are summarized in Table 1 and plotted in Fig. 2. When choroidal thicknesses in central and peripheral regions are thus averaged, differences between treated and control eyes, as detected with A-scan ultrasonography were greatly diminished. The measurement of global choroid for day 1 for the treated group is significantly higher than the contralateral control (paired t-test, P < 0.05).
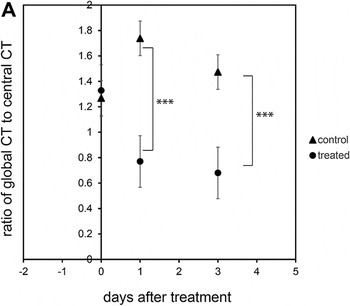
On-axis to global CT ratio
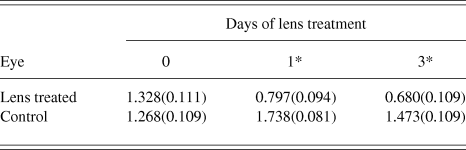
To better understand the nature of the CT changes, specifically how localized they were, the effects of the lens treatments on the on-axis to global CT ratio and also changes in this parameter with time were analyzed by ANOVA. These data are also shown graphically in Fig. 5. While there was little difference between the ratios for treated and control eyes at baseline, differences were apparent after the first day of lens treatment and were still in evidence after 3 days of treatment. These differences reflect the early increase in on-axis CT ahead of peripheral choroidal thickening, which appeared more variable from the maps and also less enduring. Statistical analysis of these data using a repeated measures ANOVA with lens as the between-subjects factor and time as within-subjects factor reveal a significant overall effect (Between-subjects effects, F = 47.131, P < 0.001, Table 3). Within subjects effects show interaction between duration of lens wear (time) and lens (F = 15.706, P < 0.001).
Ratio of global choroidal thickness (CT) to central (on-axis) CT, plotted as a function of time over the lens treatment period. This index decreased with time for the treated eyes but increased for the control eyes, implying that the treatment effect was relatively localized to the area centralis region.

Mean ratio of on-axis to global choroidal thickness (standard errors in brackets) for lens-treated and contralateral control eyes, and each measurement time point a

a *P < 0.001, least significant difference post-hoc test.
Discussion
Described herein is a novel, noninvasive, and accurate method for utilizing SD-OCT imaging to characterize spatial and temporal changes in choroidal thicknesses in young chicks. Our primary motivation for exploring this technology was evidence for local regional control of early eye growth regulation, and increasing interest in the role of the peripheral retina in the development of myopia. In this context, there was an identified need for an in vivo method for characterizing local changes in CT, which is known to be modulated by optical defocus. Nonetheless, the technique described also has potential application for similar analyses of retinal thickness changes in the same and different species.
As noted in the introduction, it was previously shown using high frequency A-scan ultrasonography that the central (on-axis) choroid can thicken and thin in response to imposed optical defocus, according to its sign, and these changes along with additional changes at the level of the sclera serve to move the retina to the altered plane of focus and thus restore the eye to emmetropia. When optical manipulations are only applied to one half of the retina, the changes in the eye shape appear confined to the affected region, although the in vitro data relied on in one such study involving chicks (Diether & Schaeffel, Reference Diether and Schaeffel1997) are inherently noisy and thus unreliable.
In the current study, we used the most robust defocus paradigm—single vision positive lenses (+15 D), to investigate whether high resolution SD-OCT imaging could be successfully employed to characterize regional, time-sensitive changes in CT in response to defocus. The choice of a positive lens over a negative lens was made on the basis that there is a limit to how much a relatively thin tissue, the choroid, can thin, as is the expected response to the latter lens. For this initial study, we deliberately chose a single vision lens design over multifocal lenses, despite wide-spread interest in their application for myopia control, because of the inherent ambiguity related to the local retinal experience of defocus with commonly used concentric designs. We also avoided the potentially confounding influence of diurnal variations in thickness (Nickla et al., Reference Nickla, Wildsoet and Wallman1998) by scheduling all imaging sessions within a narrow time frame each day.
To confirm the repeatability of the algorithm in extracting the outer choroid boundaries, we also did further repeatability studies. The ICC was higher than 0.80 and the coefficient of variation is 2.6%. That our segmentation tool applied here to determine choroidal thicknesses performed very well is evidenced by the high ICC and low coefficient of variation obtained for derived data (R = 0.98, P < 0.001).
We were able to characterize through segmentation analysis of captured SD-OCT images the choroidal thickening responses of lens-treated eyes of young chicks. That we were able to visualize peripheral choroidal thickening in vivo and also quantify regional asymmetries in their eyes represents significant technological advances for this field. We were also able to detect temporal changes in CT maps, where previously, such temporal studies have been limited to defocus-induced responses of the central choroid.
The CT maps obtained using the segmentation algorithm revealed the choroid to be regionally asymmetric, with the temporal choroid being more responsive than the nasal choroid. This temporal-nasal asymmetry was previously observed ex vivo in the measurement of relative posterior nodal distances (PNDs) in 30-day old chicks. The PNDs were measured by placing the excised eye on a graduated rotatable table (Schaeffel et al., Reference Schaeffel, Glasser and Howland1988, Reference Schaeffel, Troilo, Wallman and Howland1990).
Furthermore, there is an interesting parallel from human studies, where, for myopic subjects, the nasal choroid is reported to be thinner than the temporal choroid (Margolis & Spaide, Reference Margolis and Spaide2009; Agawa et al., Reference Agawa, Miura, Ikuno, Makita, Fabritius, Iwasaki, Goto, Nishida and Yasuno2011).
Nonetheless, induced global CT changes were not as dramatic as the changes recorded using ultrasonography and qualitative inspection of the CT maps also revealed a central bias to the thickening, in the vicinity of area centralis. Among possible explanations for this result, three are offered here.
First, it is possible that the ocular growth modulatory signal generated by the area centralis is stronger than that generated by more peripheral retinal regions, perhaps reflecting its greater sensitivity to optical defocus and/or poorer quality images at more peripheral locations. However, the latter effect is likely to be minimal, given that the peripheral optical quality of the chick eye appears to be very good (Maier et al., Reference Maier, Howland, Ohlendorf, Wahl and Schaeffel2015).
Second, mechanical constraints on choroidal thickening are likely to be greater in the periphery where the choroid merges with the ciliary body and inferiorly, where the retina and choroid are anchored by the pecten.
Third, intersubject variability may have dampened differences in quadrant and global choroidal thicknesses, especially if greater in more peripheral than central regions. In two previous studies involving chicks, one using SD-OCT and the other using high frequency A-scan ultrasonography, the intersubject variability in central choroidal thicknesses was found to be quite high, 23% and 24%, respectively (Guggenheim et al., Reference Guggenheim, Chen, Yip, Hayet, Druel, Wang, Erichsen, Tumlinson, Povazay, Drexler and Hocking2011; Lan et al., Reference Lan, Feldkaemper and Schaeffel2013).
Regardless of the explanation, we were able to detect an overall increase in global CT after just one day of lens wear, with this effect declining thereafter, suggesting more rapid attenuation of the thickening response in the periphery than centrally. At a more general level for animal model studies of eye growth regulation, such data serve to complement more routinely collected in vivo data, including on-axis and peripheral refractive errors, with the potential to provide valuable additional insights into underlying mechanisms, and responses to experimental optical and drug manipulations.
The main purpose of the current study was to develop a method for quantifying CT changes in vivo both centrally and more peripherally. However, we were also able to demonstrate the utility of this imaging method for mapping regional specialization within the retina. Specifically, we were able to identify a region of specialization superior and nasal to the tip of the pecten, where the retinal GCL showed significant thickening, and which we believe to be the area centralis, based on descriptions from an earlier ex vivo study mapping the area centralis from the histological profiles on the ganglion cell density and axonal patterns in the chick (Ehrlich, Reference Ehrlich1981). In that study, the greatest density of ganglion cells was localized to a superior region, slightly nasal to the tip of the pecten, encompassing a region of 0.360 mm2 to 1.42 mm2 in area (Ehrlich, Reference Ehrlich1981). This is equivalent to 0.8 degrees to 3.128 degrees, respectively for a 7-day old chick with an axial length of 8.27 mm. Our assigned location of the area centralis also matches with observations at the level of the NFL reported in a second, slightly later histological study, in which a “node” is described, “about 2 mm from the dorsal end of the optic disc and a set of structures radiating out from this node” (Morris, Reference Morris1982).
In the context of eye growth regulation and separate from our interest in the choroid, there are many applications for maps of retinal sublayers as derived by automated 3-D segmentation. For one such maps can serve as useful guides for histological sectioning and targeted analysis of retinal wholemounts post enucleation of eyes exposed to retinal neurotoxins (Wildsoet & Pettigrew, Reference Wildsoet and Pettigrew1988; Bitzer & Schaeffel, Reference Bitzer and Schaeffel2004). Derived retinal maps that localize the area centralis can also inform studies of gene and protein expression involving the retina or adjacent ocular layers. For example, prior in vivo mapping may allow more accurate orientation of stained whole-mounted retinas and thus localization of specific proteins. In gene expression studies, prior in vivo mapping could reduce some of the imprecision in regional sampling, which is of special relevance to studies involving multifocal lens designs that aim to locally manipulate retinal signals and thus eye growth.
The present study is not without limitations. High resolution SD-OCT scans were acquired with alignment between the imaging probe and the eye optimized manually for vertical, horizontal, and depth directions through a customized stage. Slight variations in the orientation of scans can add noise to results of comparisons of thickness maps collected across time and from the two eyes of individual animals. For instance, the angle of the pectin is affected by head tilt, and thus may differ slightly from scan to scan but need not be sufficient to be detected. Thus the spatial and chronological (intertime) difference maps in Fig. 3 are affected by the thickness maps having a slight tilt in the absolute, nasal, temporal, superior, and inferior axes. Such noise could be reduced with more advanced acquisition tools that track and measure head tilt and the top viewing angle between the eye and the probe, used in combination with algorithms that correct for deviations before 3-dimensional segmentation is undertaken. Such tools would also make for more efficient image analysis.
It is to be noted that no corrections for lateral magnification were made, and thus it is possible that equivalent scans from treated and fellow control eyes, and from the same eyes on different days will encompass different areas, due to differences in axial length. However, we believe such measurement artifacts to be minimal for the following reasons. First, there is evidence from previous studies that the retinal magnification factor, which is about 0.15 mm per degree of visual angle in the chick, does not vary significantly with eccentricity (Ehrlich, Reference Ehrlich1981). Second, because the distance from the posterior nodal point to the retina for the eye of young chicks is about half that in human eyes and the scan length is much larger than that used in imaging human eyes (rectangular scan set to the maximum allowable by the system, “14 mm”, compared to usual 6 mm scan setting for human eyes), the scan angle used in imaging our chick retina is much wider. These differences, together with the high sampling density used (approximately 20,000 points across the entire retina), decreases the need for lateral magnification correction.
As a final aside, the imaging technology used here did not allow resolution of the sublayers making up the choroid. The chick choroid has a well-developed outer layer of lymphatic-like lacunae, where much of the thickening appears to occur, based on related histological studies (Wallman et al., Reference Wallman, Gottlieb, Rajaram and Fugate-Wentzek1987; Junghans et al., Reference Junghans, Liang, Crewther and Crewther1999). Nonetheless, changes in blood flow have also been recorded with visual manipulations with known effects on CT (Fitzgerald et al., Reference Fitzgerald, Wildsoet and Reiner2002). Improved imaging could provide valuable insight into these choroidal events and the inter-relationship between them.
In summary, we have demonstrated the combination of in vivo high resolution SD-OCT imaging and segmentation to be a valuable tool for characterizing regional asymmetries in retinal and choroidal thicknesses, as may occur naturally or are induced experimentally, e.g., by defocus. We have derived other indices, including a global thickness parameter and a central/global choroid ratio and have shown their utility in characterizing the relationship between the central (on-axis) and the overall CT changes.
Supplementary Data
Supplemental materials can be viewed in this issue of VNS by visiting http://journals.cambridge.org/VNS.