

The core of this article examines the policy choices necessary to maintain the ability of the Social Security program to pay all promised benefits. Fortunately, relatively small changes to its funding could end the continuing fear that Social Security will run out of money in the mid-2030s. On the touchy issue of cutting benefits, the article develops a proposal to protect the “old-old” that provides an acceptable path for restructuring the benefit. If beneficiaries and their advocates can be convinced to accept a modification in calculating the benefit, other stakeholders ought to accept a modest revenue increase. The argument presented this article is based on empirical facts about Social Security and appeals to widely accepted values in the American polity.
Overview
After a brief explanation of the relevance of Social Security solvency for a symposium on health (which receives more attention in the discussion in the last section), the article devotes two sections to our policy proposal for restoring long-term solvency to Social Security. The first section provides a useful overview of important details of the Social Security program and explains what we regard as the only feasible and fair approach to reducing expenditures by restructuring the benefit. It contains one technical subsection that estimates the potential savings generated by our proposal, but the casual reader can easily understand our comprehensive approach to restoring solvency without reading the quantitative analysis.
The following section reviews proposed ways of raising new revenues within the current Social Security program (i.e., excluding shoring it up with funds from general federal revenues). Unlike our proposal for restructuring the benefit, we suggest changing some aspects of the revenue stream and give reasons for our adamant opposition to other popular but ill-considered avenues for raising new revenues. In this section, many of the options we suggest are open-ended in the sense that we suggest revenue streams that can be altered but do not define precise amounts. It is the decision makers in the hurly-burly of legislative politics who will decide where on a continuum to peg any particular change. It would be a mistake, however, to view this openness as a lack of confidence in our arguments. Because our case for this comprehensive approach to Social Security solvency is grounded in well-researched facts and sound values consonant with the program’s long history and American values, we are confident that the path toward long-term solvency that we sketch is the optimal one.
Consideration of the policy proposal outlined here as a whole will, we believe, lead skeptics to acknowledge the apodictic power of our arguments for those subscribing to the notion of an American polity. Of course, the choice of liberal democratic policy regimes involves hypothetical, not categorical propositions, as the discussion makes clear.
In the discussion, we address the vexing issue of feasibility and fit our proposal into larger theoretical policy frameworks in the literature. The authors confess to having much less confidence in our thoughts on political feasibility. Unlike a reasoned policy argument, politics is much too contingent and mercurial for us to be at all certain that our somewhat optimistic best guesses will be realized in the next decade. Thus, we are very diffident about venturing into the domain of political analysts and journalists. In contrast, we feel more secure that grounding our arguments in established, if new, conceptual policy frameworks helps clarify our proposal and arguments by demonstrating how they fit into established modes of policy discourse. But the first task is to show why Social Security is a social determinant of health and, for that reason, an article on its most important problem belongs in a symposium issue on health in Politics and the Life Sciences.
Social determinants of health
The understanding of what constitutes “health” and “health care” has expanded since World War II. No longer is “health” merely the absence of disease and disability and health care an effort to rid the individual of an identifiable malady. An early indicator of this evolution was the adoption by the World Health Organization in 1946 of its seminal definition of health: “Health is a state of complete physical, mental, and social well-being, and not merely the absence of disease or infirmity.”1 Currently, the broader conception of health sails under the flag of the “social determinants of health.”Reference Marmot and Wilkinson2
Social determinants include concerns about a wide range of inputs necessary to good health.Reference Onie, Lavizzo-Mourey, Lee, Marks and Perla3 The U.S. Centers for Disease Control and Prevention has adopted the social determinants approach, which it defines as follows: “Social determinants of health are life-enhancing resources, such as food supply, housing, economic and social relationships, transportation, education and health care, whose distribution across populations effectively determines length and quality of life.”Reference Brennan-Ramirez, Baker and Metzler4 Thus, at contemporary health and public health conferences, it is common to hear papers on the “built environment,”Reference Haskins5 social capital (e.g., the work of Ichiro Kawachi), and the need to provide safe places to exercise. Lifestyle and preventive health have received increasing emphasis during the second half of the last century, but recent research shows that it is a mistake to focus exclusively on the individual in thinking about how to champion these approaches to health behavior. Pathbreaking research using network analysis has demonstrated that patterns of association have implications for health.Reference Christakis and Fowler6 In reality, the appreciation that individual health depends on a healthy environment goes back at least to the fifth century BCE, to the Hippocratic author of Airs, Waters, and Places. In the nineteenth century, what we now call public health was referred to as the “sanitary movement”; its advocates struggled against devotees of unregulated capitalism to provide supplies of clean water, milk, and food and safer working conditions.Reference Rosen7
This broader understanding of health and health care is especially important for the fields of gerontology and geriatrics, the allied clinical specialty. The quality of life of older Americans depends not only on clinical medicine but also on the adequacy and quality of what can be called the “aging-support system,”Reference Brandon, Alt, Morone, Litman and Robins8 which combines conventional health care, age-relevant social services, and secure access to the basic needs of life such as food and shelter.Reference Onie, Lavizzo-Mourey, Lee, Marks and Perla3, Reference Bradley, Elkins, Herrin and Elbel9, Reference Bradley and Taylor10 In market-based economies such as the United States, a secure basic income ranks high among fundamental necessities. Fortunately, most senior citizens and the long-term disabled in the United States enjoy the guarantee of Social Security and its protection against inflation. Thus, only 13.8% of those 65 and older are in households falling below 125% of the federal poverty level.11 Social Security beneficiaries (including the disabled) are the only Americans guaranteed an income; for many retired people, Social Security benefits provide the largest portion of their monthly income.
Maintaining this critical support for the health and happiness of older Americans is vital in the face of challenges by those who would change current income maintenance policies. A backlash against Social Security and Medicare, the two largest federal domestic spending items, might well follow the decision of the Donald Trump administration to initiate massive additional deficit spending ($1.5 trillion in tax reform, $300 billion in the February 2018 budget compromise, $200 billion in infrastructure investment, and the inevitable rise in interest payments on this debt burden). Although powerful House Speaker Paul Ryan (R-WI) retired in 2018, other Republicans are likely to continue attacking the domestic entitlement programs using his playbook. Ryan, former chair of the House Budget Committee, had a long history of targeting entitlements, going back to his “Path to Prosperity: A Blueprint for American Renewal.”12 Almost a decade before, following his successful 2004 reelection campaign, President George W. Bush attempted to make individual workers responsible for investing part of the Social Security taxes that their labor generated; this unsuccessful effort to partly privatize Social Security was intended to be the first major step toward making America an “ownership society.”Reference Brandon, Alt, Morone, Litman and Robins8 Even supporters of Social Security have long argued that its projected difficulties in paying the full benefit in the 2030s justify reforms; they may gain enough political traction to act in the next decade.Reference Sommer13
Many political observers maintain that Congress can only act when a crisis looms. That view seems unduly cynical. But perhaps that crisis will soon engulf the United States, because under the new Trump tax regime, revenues—at least corporate profit taxes—are much lower than predicted, and expenditures continue to rise.Reference Tankersley14 Surely, there must be some political reward for a legislator or other policy entrepreneur who gains a reputation for “saving Social Security,” especially since Social Security payroll tax revenues are counted as part of the consolidated federal budget. The measures required to maintain solvency will be much easier to achieve before there is a major Social Security funding crisis. Faced with such ongoing challenges as President Trump’s proposed 2019 budget,15 friends of Social Security should take timely action in the next Congress to ensure that the 75-year time horizon only shows surpluses, thereby preempting attacks by those who would “reform” it out of existence. Achieving this goal requires securing an adequate income from the payroll taxes dedicated to financing Social Security augmented by the earnings on reserves.
Social Security and restructuring its benefit
Public servants, who face increasing numbers of intractable problems such as decaying infrastructure, public resistance to raising income taxes, global migration, and climate change, would be well advised to develop a short list of tractable problems to address. Demonstrated success in resolving a few of these less impossible issues would help restore public trust in government capacity. Moreover, success in responding to well-chosen tractable problems could chip away at some of the complex problems that currently appear to be intractable.
Potential insolvency in the Social Security Trust Funds is among the problems that can be solved. The 2019 annual report of the Board of Trustees of the Old-Age and Survivors Insurance (OASI) and Disability Insurance (DI) Trust Funds16 projected that in 2035, the combined Trust Funds will have current obligations greater than reserves and all revenue sources (excluding interest on assets). Without the DI Trust Fund, which will become insolvent late in 2052, OASI will be insolvent in 2034, which demonstrates that the DI Trust Fund liability is dwarfed by actuarial estimates of future OASI benefit obligations. Thus, to continue paying 100% of benefits in the 2030s will require additional revenues or reduced benefits or, preferably, a combination of these two strategies.
Social Security has staunch defenders who oppose any substantive change to the program, but dire warnings of impending deficits by those who wish to alter it are likely to gain greater political traction as insolvency draws closer. The Social Security Administration itself has joined the chorus urging action sooner rather than later.17 Over the 75-year time horizon used by Social Security actuaries, the fiscal shortfall is fairly small. Thus, the problem is solvable, but there is merit in making changes sooner rather than later to ensure the long-term solvency of Social Security.
We contend that the United States needs another compromise analogous to that reached between the Ronald Reagan administration and congressional Democrats in 1983.Reference Light18, 19, Reference Bernstein and Bernstein20 At that time, policymakers on all sides of the issue recognized the necessity of accepting some changes that would be painful for the interests they represented. In principle, universal social insurance pensions such as Social Security can be made solvent using three distinct approaches: cutting benefits, raising revenues, or reducing the number of beneficiaries. Only the first two were used in 1983; the third is not generally mentioned as an option in the literature on social insurance. However, greater scrutiny of potential beneficiaries is a possible way to reduce expenditures for a small part of the overall financial distress caused by any rise in disability claims. (Social Security includes the DI Trust Fund, which provides income for covered workers with long-term disability, defined as the inability to work after a five-month waiting period.) Because the DI Trust Fund is small compared with the OASI Trust Fund, this article only considers cutting benefits and raising additional revenue.
We argue that restructuring the benefit, but in a manner that will not be felt for many years, would cause the least harm to beneficiaries and provide critical new income for some when they need it the most. By accepting modest benefit cuts with delayed impact, advocates for Social Security beneficiaries would position themselves to challenge other interests to accept the pain of increasing revenues. Specifically, the article revisits a suggestion for changing the calculation of the cost-of-living allowance (COLA), which adjusts benefit payment to offset price inflation. Although the proposal received some attention from President Barack Obama and two study commissions in 2010 and 2011,Reference Quinton21, Reference Shear22, Reference Cook, Moskowitz and Hudson23, Reference Munnell and Hisey24 its flaws were widely recognized, and in recent years, it has attracted less attention. Our proposal would eliminate the obvious flaw. Adopting our proposal would supply about one-sixth of the revenue necessary to close the Social Security shortfall over the 75-year time horizon. We explain why we believe that altering the COLA calculation is superior to other ways of cutting the benefit. In keeping with the principle of “shared pain” that made the 1983 compromise possible, the remainder of the shortfall would need to be made up by raising revenues.
Thus, this article focuses on the proposal to change how the COLA is calculated in order to reduce benefits (as opponents argue) or to account more accurately for the actual increases in living costs experienced by older Americans (as proponents explain). Because details of how COLA increases are calculated are somewhat technical, pundits and politicians tend to avoid the important policy facts and argue their broad—and depressingly repetitive—talking points. However, sound policymaking demands that concerned citizens and public servants understand the details. After explaining the proposed benefit modification and why its savings are superior to savings generated by alternative benefit cuts, the article surveys proposals to generate more Social Security revenue. Our review of the pros and cons of possible measures to increase Social Security Trust Fund revenues is arguably as important as our innovative adaptation of proposed benefit cuts in charting the path for another comprehensive shared pain compromise to solve the problem of long-term Social Security solvency. In the discussion, we return to the question of the feasibility of action in the first half of the 2020s to forestall long-term Social Security insolvency.
Indexing in Social Security
Older Americans receiving Social Security benefits are among the fortunate few Americans who are not living on “fixed incomes” for a substantial part of the income that most beneficiaries need to live. While workers today—even unionized workers—are not promised annual wage increases or even inflation adjustments, year in and year out the Social Security Administration announces by how much benefits will increase to offset increases in living costs. The increase is determined by the Bureau of Labor Statistics (BLS), which calculates the consumer price index for urban wage earners and clerical workers (CPI-W) based on monthly surveys that it conducts.
Legislation passed in 1972 established automatic inflation protection (effective in 1975) following a 20% increase in the Social Security benefit. Both were engineered by Wilbur Mills (D-AK), powerful chair of the House Ways and Means Committee, who had presidential aspirations in the 1972 elections. The incorporation of inflation protection into Social Security can be seen as the maturation of America’s peculiar welfare state, which provides universal social insurance only for seniors and the long-term disabled. Since that watershed, the major Social Security debates have focused on how to finance the obligations undertaken by earlier generations, as the demographic profile of the country has changed and the economic base has shifted from large-scale manufacturing to a postmodern service economy.
An important characteristic of inflation protection is the difference between the CPI that adjusts benefits and the adjustment for the value of previous years’ wages of those who are contributing to the Trust Funds. The CPI only adjusts the sums paid to beneficiaries who have become eligible to receive their retirement benefit or disability check. In contrast, up to age 60, Social Security increases the value of each worker’s credited earnings by a wage index. This difference is a master stroke in fostering both fiscal probity and equity. The average increase in credited earnings by all covered workers over the previous year’s average is used to increase the value of the previous year’s wages credited to the covered worker and the updated total of prior years’ earnings. Because wages generally rise faster than prices as the nation’s economy experiences real growth, Social Security revenues increase at a greater rate than the expenditures necessary to cover CPI-adjusted benefits.Reference Biggs, Brown and Springstead25 The same percentage is used to increase the credited earnings of bankers, who receive generous salary increases and, say, low-paid school teachers or employees of nonprofit child daycare centers. Thus, young people can choose nonprofit service careers that pay poorly but have some of that decision’s harmful long-term economic effects on their Social Security retirement benefits diminished by the fact that every worker’s annual earnings record is increased by the average wage gains received by all workers that year, whether they are well paid or poorly paid.
Another consequence of indexing credited earnings to wages up to age 60 is that each age cohort will have an average benefit that is greater in constant dollars than that received by previous age cohorts, because over a lifetime, wage increases are greater than price rises. Philosophically, this inequality can be defended on the grounds that the wealth of the nation grew during the working years of each cohort, thereby justifying the enjoyment in retirement of some of the benefits of the economic growth achieved during that cohort’s working years. Of course, in a pay-as-you-go social insurance system, current workers must pay the benefits of current Social Security beneficiaries, just as the age cohort currently in retirement paid for the benefits—including any growth dividend—of the previous age cohort.
Indexing: History and details.
The United States calculates inflation by identifying a “market basket” of goods and services that a representative sample of urban wage and clerical workers use and sending surveyors to buy those goods in local stores. In 1972, when legislation indexing Social Security was enacted, the only CPI measure was based on costs incurred by urban wage and clerical workers; that measure became the basis for calculating the Social Security COLA. In 1978, the BLS established the consumer price index for all urban consumers (CPI-U). Whereas the CPI-W samples the average costs experienced by approximately 32% of U.S. residents—families with at least one member in the workforce—the CPI-U reflects the consumption of 87%. The population sample on which the CPI-U is constructed includes retired individuals as well as professionals, the self-employed, and unemployed individuals. However, the Social Security law was never changed to base its COLA on this index.Reference Munnell and Hisey24, Reference Koenig and Waid26
Earlier critiques of the index questioned the appropriateness of the CPI-W market basket for older adults. For example, it was often said that housing costs constituted a significant part of the index, but many seniors owned their homes, and some had paid off their mortgages.Reference Bernstein and Bernstein20, Reference Marmor, Mashaw and Harvey27 However, the most recent criticisms focus on the BLS methodology used for both the CPI-W and CPI-U. The surveys divide the market basket into 211 categories, within which substitution is allowed as costs change, but substitution across categories is not allowed. For example, if porterhouse steak in the beef category rises in price, the CPI permits substitution of top sirloin beef priced more cheaply; similarly, price increases in costs of brand-name prescription drugs will trigger the substitution of appropriate generic drugs. What is not allowed is substitution across categories. Yet in reality, consumers faced with higher beef prices will purchase more pork, seafood, or chicken, which are in different categories.Reference Koenig and Waid26 (Appendix A discusses an alternative methodology and a third inflation measure.)
In response to this criticism, the BLS has done research on a “chained CPI-U” (C-CPI-U) to learn how relaxing the prohibition against cross-category substitutions would affect the inflation measure. Over time, the C-CPI-U would reduce the rate of increase. Using data from 1982 to 2010, the C-CPI-U rose 0.3% less on average each year than the CPI-W. For an average Social Security monthly benefit of $1,200, the reduction caused by using the C-CPI-U rather than the current CPI-W would amount to $4 per month, but by age 85, the average benefit would be reduced by 6.5%. The compounded reduction is enough to make an impact on lifestyle.Reference Munnell and Hisey24 By the time the beneficiary is in his or her nineties (i.e., after 30 years as a beneficiary), that benefit would be reduced by 8.4%, which would be especially hard on those with no other source of income.Reference Koenig and Waid26
But how would adopting the C-CPI and the resulting slow lowering of benefit levels affect Social Security? The answer, using National Commission of Fiscal Responsibility and Reform (Simpson-Bowles) 1999–2010 data, was that it would reduce “Social Security’s 75-year actuarial deficit … [of] about 2 percent of taxable payrolls … by 0.5 percent of taxable payrolls.”Reference Munnell and Hisey24 Reduction of the 75-year deficit by one-quarter through benefit reduction would be a substantial step forward. It could be parsed as a sufficient contribution by beneficiaries, leaving the remaining 1.5% of taxable payroll to be generated by measures that expand revenue from other stakeholder groups.
Critiques of the CPI-W or C-CPI-U.
Two related objections are made against using the C-CPI-U. One criticism objects that an index based on the spending of urban wage and clerical workers (CPI-W) is an inappropriate measure of the spending of senior citizens, because most of them are no longer in the labor force. The Older Americans Act of 1987 instructed the BLS to develop an index that would better capture the real spending of seniors. In response, the BLS began generating the experimental consumer price index for the elderly (CPI-E) based on the spending patterns of those 62 and older in the CPI-U sample.Reference Stewart and Pavalone28 The application of appropriate weighting algorithms permitted the BLS to make statistically valid inferences about the spending of elders. Inflation estimates generated by the CPI-E for 1982–2010 showed an average increase that was 0.27% greater than the CPI-W on which the actual Social Security benefit was based.Reference Munnell and Hisey24 A beneficiary retiring in 2015 with an average monthly benefit of $1,355 ($16,260 yearly) would receive monthly benefits 8.9% higher after 25 years if the COLA were calculated by the CPI-E instead of the CPI-W, according to a Senior Citizens League analyst using more recent 2015 data.29
The other objection rests on the practical effects for older Americans of chaining either current index. The chief reason for chaining the CPI is that it is a more accurate measure of the average inflation experienced by all consumers. But advocates for older Americans argue that changes leading to lower COLA increases will only exacerbate the current injustice in Social Security benefits, because even the unchained indexes underestimate inflation in health care costs born by older Americans. They point out that the CPI-W and CPI-U do not reflect differences between the average health care costs of Social Security beneficiaries and those experienced by younger populations (which dominate the measures in the standard indexes). Although elders over 65 as an age cohort have better health coverage than younger age groups, patient cost sharing is a greater burden. In part, that burden is because seniors disproportionately suffer from disease and disability. But as health care prices rise, the 20% copayment required by Medicare Part B and the cost of the hospital deductible in Part A rise each year. Moreover, the Prescription Drug and Medicare Modernization Act of 2003 instituted greater Part B premiums for higher-income beneficiaries, even if they do not elect prescription coverage under Part D.Reference Brandon, Alt, Morone, Litman and Robins8
On average from 1982 to 2010, health care constituted 13% of spending by those 65 and over but only 5% of spending by those younger than 65.Reference Munnell and Hisey24 Of course, there is a great deal of individual variation in spending by both groups and often very little real choice about purchases of health care by those who face significant—and costly—health problems. The “medical care” component in calculating the CPI expenditure survey weights in 2009–2010 counted for 11.6% of eight general groupings of the 211 market-basket categories for the CPI-E index but only 5.7% of the CPI-W index that serves as the basis for the Social Security COLA. The broader CPI-U, which includes the unemployed and some retired persons, registered medical care as 7.1%. The cost of living rose at greater rates in every component of both the CPI-W and CPI-U than in the CPI-E, except for the medical care and housing components, where the percentage increase in medical care of the CPI-E was slightly greater than the percentage increase in housing costs.Reference Koenig and Waid26 Recent analyses predict that by 2029, older middle-income seniors (those with individual incomes in 2014 dollars of $25,001–$74,298, excluding home ownership) will not be able to pay for both health care and housing that provides ongoing care needed to cope with limitations on independent living.Reference Pearson, Quinn, Loganathan, Datta, Mace and Grabowski30, Reference Span31
Proposal: An acceptable chained CPI
The problem with chaining any version of the CPI, then, is how to protect older beneficiaries, whose minor reductions in COLA increases to their monthly Social Security benefit compound over the years. As explained earlier, a reduction of only $4 monthly when a beneficiary is in his or her 60s will compound over the years so that some 30 years later, the reduction caused by changing to the chained CPI will be about 8.4%.Reference Koenig and Waid26 Clearly, reductions approaching 10% constitute a hardship. Moreover, seniors in the oldest age ranges are especially vulnerable. Some of these “old-old” will have outlived other income sources; many will face devastating bills for health care and long-term care after Medicare and other insurance has paid; and almost all will experience such life-altering events as the death of a spouse or residential moves that sometimes have significant financial consequences.
Constraints and solution.
Predicting who will face these problems is impossible. Far from being a homogeneous age “class,” those who reach senior citizen ages have had a lifetime during which to individuate themselves. If prospective identification of those who will be harmed by a reduced benefit is impossible, then the best alternative is to fashion an intervention for everyone who reaches an advanced age, when financial hardships are most likely to become manifest. Means testing to determine which elders are really being harmed would destroy the social insurance foundations of Social Security and is therefore unacceptable. Means-tested Medicaid eligibility already creates an incentive for families to divest elders of their assets; that behavioral response has no place in America’s only pure social insurance program. Thus, any change to the benefit by altering the COLA must treat all similarly aged beneficiaries alike.
We also must make sure in the short term that we are not jerking large amounts of money out of the economy. On the other hand, policymakers must not forget the fundamental reason for altering the COLA calculation: to reduce long-term expenditures by Social Security in order to reduce the potential impact of Social Security on the U.S. deficit and thereby to forestall a likely political crisis over shoring up an impending Social Security insolvency in 10 to 15 years.
There is at least one solution that would generate savings by reducing COLA increases while meeting the constraints of protecting the “old-old” and avoiding disruption to the economy. Legislation is needed to make the C-CPI-U the basis for COLA calculations. All of the elderly would receive COLA increases at slightly smaller rates. However, those who survive into their mid-80s, when the reduced benefit can be expected to pinch the finances of some, should receive a one-time 8% to 10% boost in their monthly benefit. A bonus of this size would increase the value of the benefit enough that continuing to use the C-CPI-U for calculating the COLA during their few remaining years would put these old-old recipients in the same unharmed position as new beneficiaries in their 60s receiving income for the first time. A plausible peg for determining the age at which to award the benefit bonus would be the year after beneficiaries reach the period life expectancy measured at age 66, the eligibility age for full retirement for those becoming eligible from 2008 to 2019.32 To be consistent with other federal policies, this “survivor’s bonus” should be calculated using the combined (i.e., average) life expectancy of both males and females at age 66.
If fairness can be achieved for the most impacted seniors by adopting this policy, it is important to make explicit how this change could relieve the federal fisc. Because the definition of life expectancy is the age by which half of the population has died and half survives, the first 15 years of any cohort’s survival constitutes a source of pure savings by the amount generated by shifting from the CPI-W to the C-CPI-U. Subsequent to the bonus awards, there continue to be no benefits to those who are deceased and those receiving the one-time benefit boost continue to die. In 2017, only 9% of all beneficiaries were 85 or older.33 Thus, the bonus is a declining obligation on the part of Social Security. Because use of the chained index continues, COLA increases after the bonus generate lower increases than the unchained CPI-W. (Survivors receiving the benefits of those who received the increase and subsequently died would continue to get the deceased’s full benefit, including the one-time raise. Survivors getting the benefit before the increase would have to wait for the boost until their own age qualified them.)
Estimating savings.
Our proposal, which balances the need to reduce Social Security deficits and the constraints of equity, has two parts, and both have programmatic and macroeconomic effects. First, the proposal would reduce the costs of OASDI by switching from the current CPI-W to the C-CPI-U. Increasing the Social Security benefit more slowly over time would reduce cost, but it also would have an impact on the macro economy. OASDI paid out more than $952 billion in 2017,34 in an economy of $19.5 trillion.Reference Martin, Hartman, Washington and Catlin35 Program expenditures of such magnitudes constitute a significant proportion of the nation’s gross domestic product. Seniors and other program participants have a high propensity to spend their Social Security deposits, thereby generating further macro-level spending. Thus, the proposal to slowly lower benefits by using the C-CPI-U would slightly reduce economic output and lead to a proportionate reduction in OASDI income, but without shocks to the economy. The second part of the proposal, to provide a significant one-time COLA increase to survivors who reach an advanced age, would increase OASDI costs, but it would also generate positive economic activity that would yield some additional income to the program. Therefore, the estimate of the financial impact of our proposal must consider both the cost and the income effects of the separate parts of the proposal before they are combined to produce an overall figure for the proposal’s potential Social Security deficit reduction.
Estimating the total savings generated by changing from the CPI-W to the C-CPI-U must account for both changes to cost and changes to income to the program. Such income and cost forecasts are difficult, because the estimate of each is tied to the other and based on many assumptions of social and economic behavior. Estimating these endogenous values requires estimates of macro spending behavior that are beyond the general technical analyses found in the literature. Fortunately, the Social Security Administration’s Office of the Chief Actuary has published a number of technical reports in response to legislation introduced in Congress that account for both the cost and income effect of proposals.
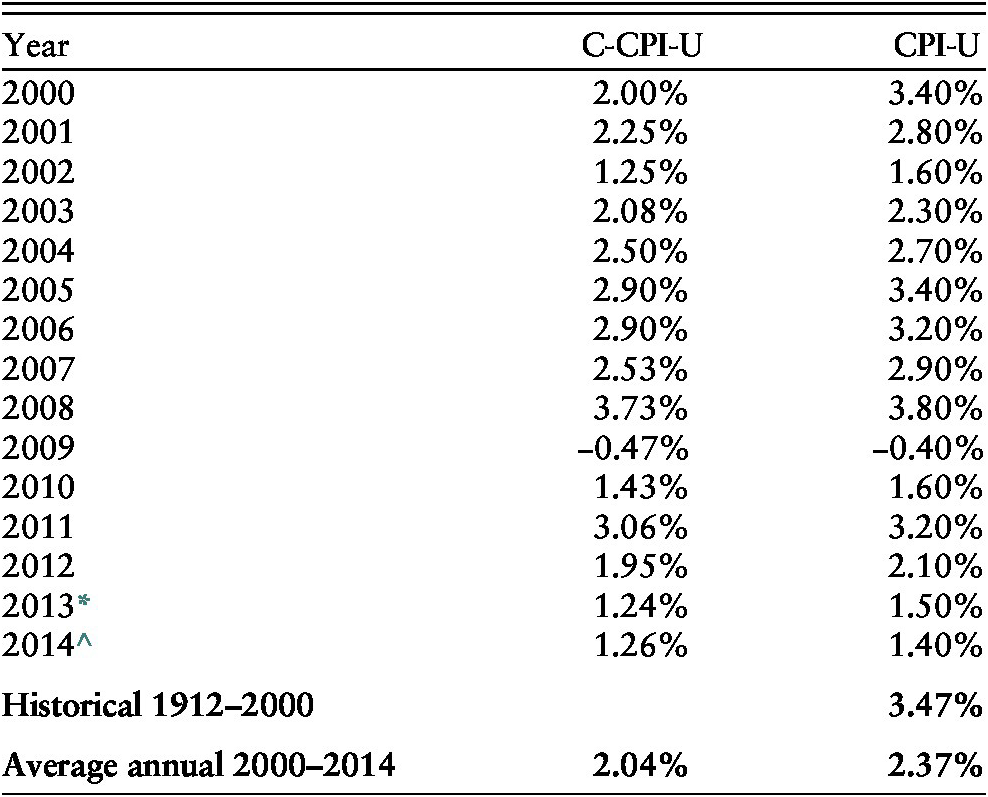
In response to legislation introduced by Congressman Xavier Becerra (D-CA), the ranking member of the Subcommittee on Social Security, one report explored the cost, income, and changing Social Security balances that would result from switching to either the C-CPI-U or the CPI-E.36 (Appendix B shows how the C-CPI-U has tracked the CPI-U over time.) Using the intermediate assumptions of the Board of Trustees’ 2011 annual report, it found that switching to the C-CPI-U resulted in lower costs relative to income of 0.55% of taxable payrolls over a 75-year period. The report also showed that income was reduced by 0.03% of payroll, because of the effects of lower economic activity on tax yields to Social Security. Combining the lower program costs and lower Social Security revenues resulted in a net Social Security deficit reduction of 0.52% from switching to the C-CPI-U. Applying the net reduction of 0.52% to the 75-year actuarial deficit of 2.22% of payroll37 produced an average 23.4% decrease in the Trust Fund deficit. This estimate accounts for both the cost and income effects of switching from the CPI-W to the C-CPI-U using 2011 data.
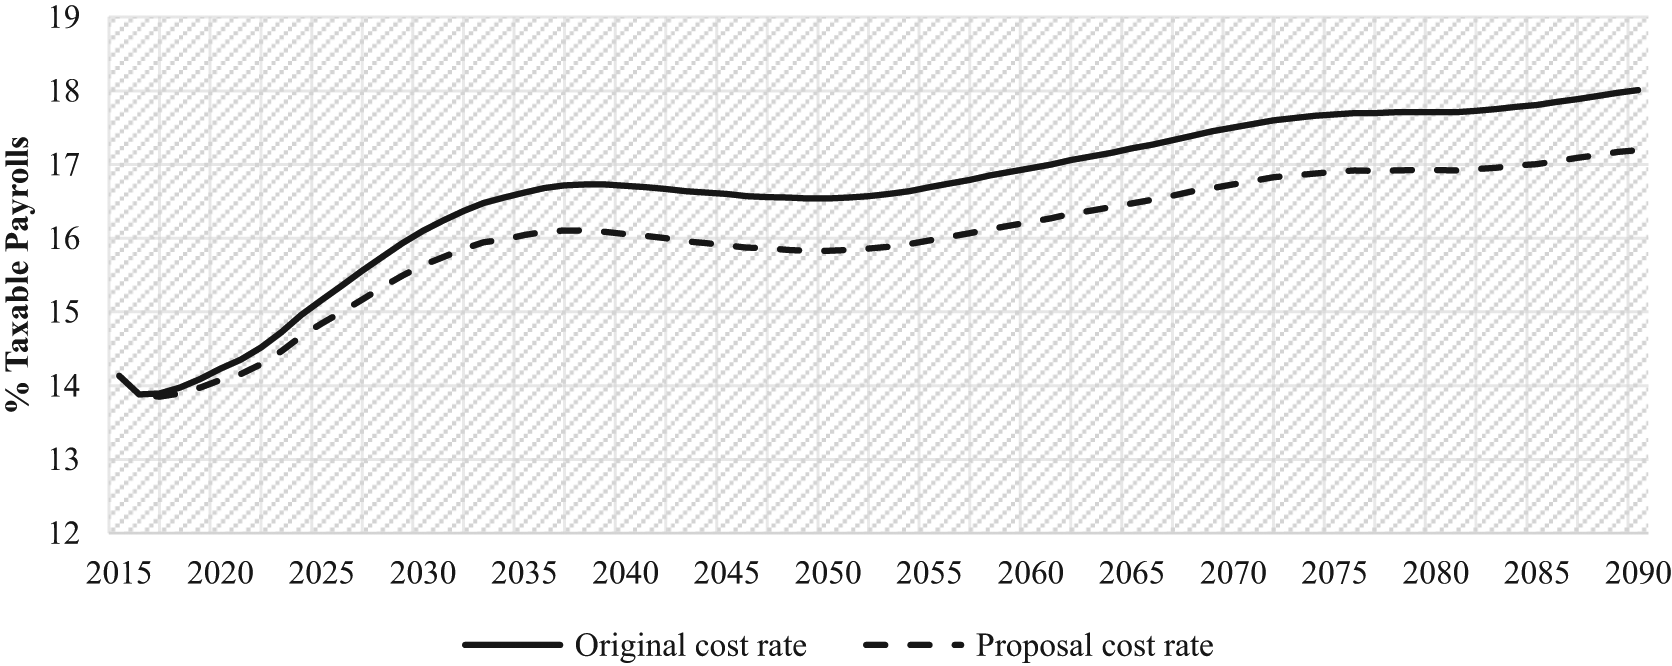
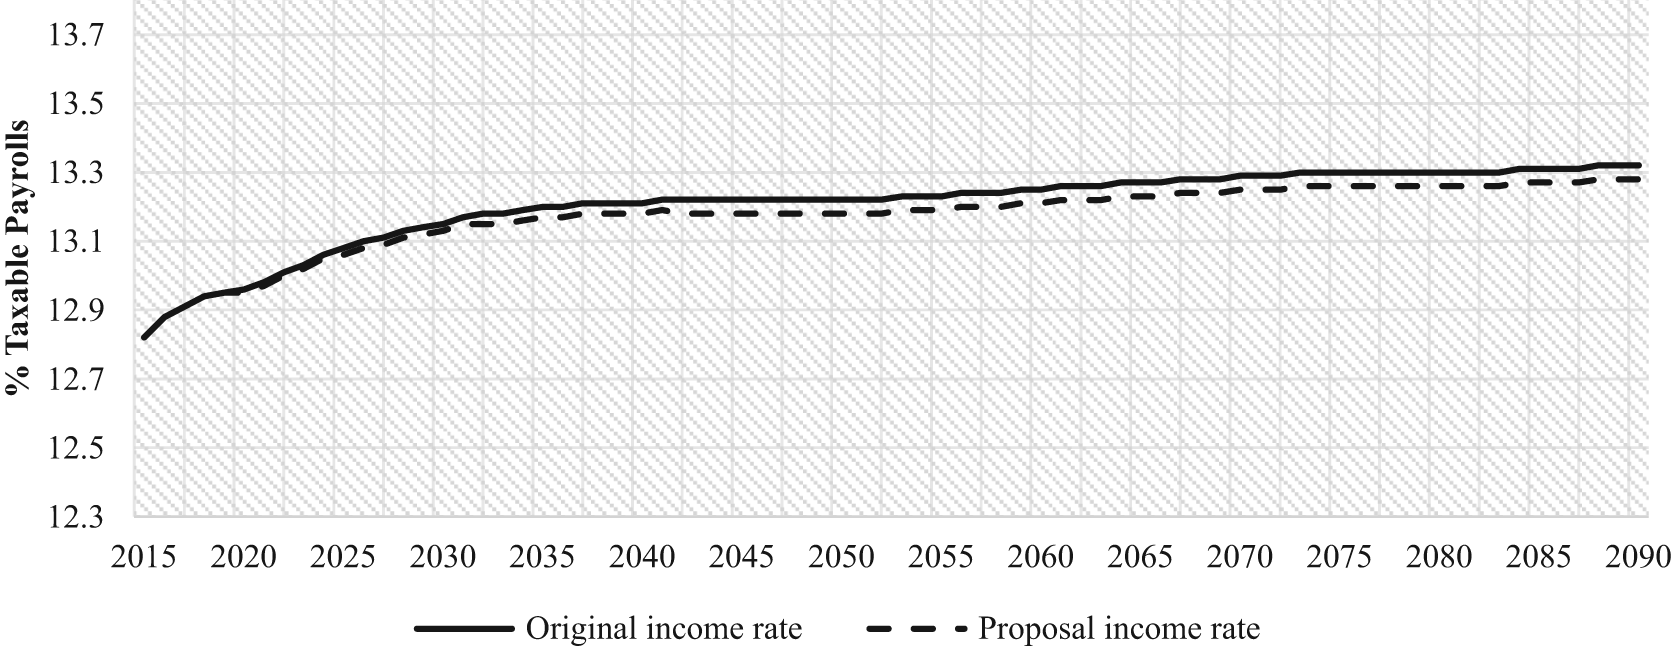
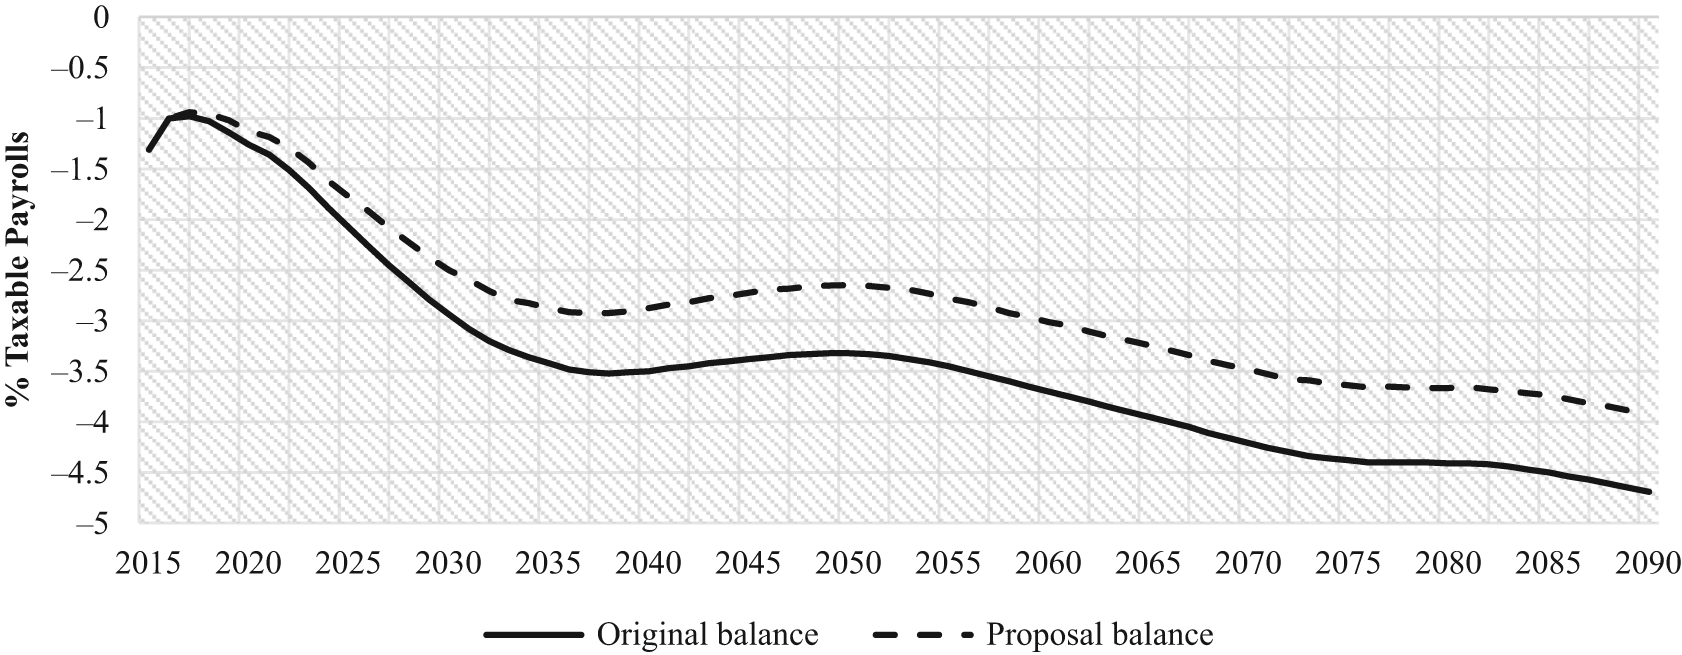
To update the report to the present Trust Fund condition, data from the Board of Trustees’ 2015 annual report were used to calculate the cost savings if the C-CPI-U proposal were adopted in 2014. The percentage reduction for each amount in the proposal for the first through 75th year was then calculated with the updated cost, income, and balances from the 2015 report. Figure 1 shows that as costs grew over time, the savings from the C-CPI-U also grew. The average effect on program costs of the savings from substituting the C-CPI-U over the 75-year period is a reduction of 0.615% of taxable payroll. The income rate—that is, lower tax yields—is relatively small and constant over time, with an average program income reduction of 0.032% (Figure 2). Thus, the average balance over the 75-year period is increased by 0.583% of taxable payroll (Figure 3), which is a savings of 21.8% of the actuarial deficit (currently 2.68% of taxable payroll).
Cost Changes from C-CPI-U Proposal Intermediate Cost Scenario.

Income Changes from C-CPI-U Proposal Intermediate Cost Scenario.

Balance Changes from C-CPI-U Proposal Intermediate Cost Scenario.
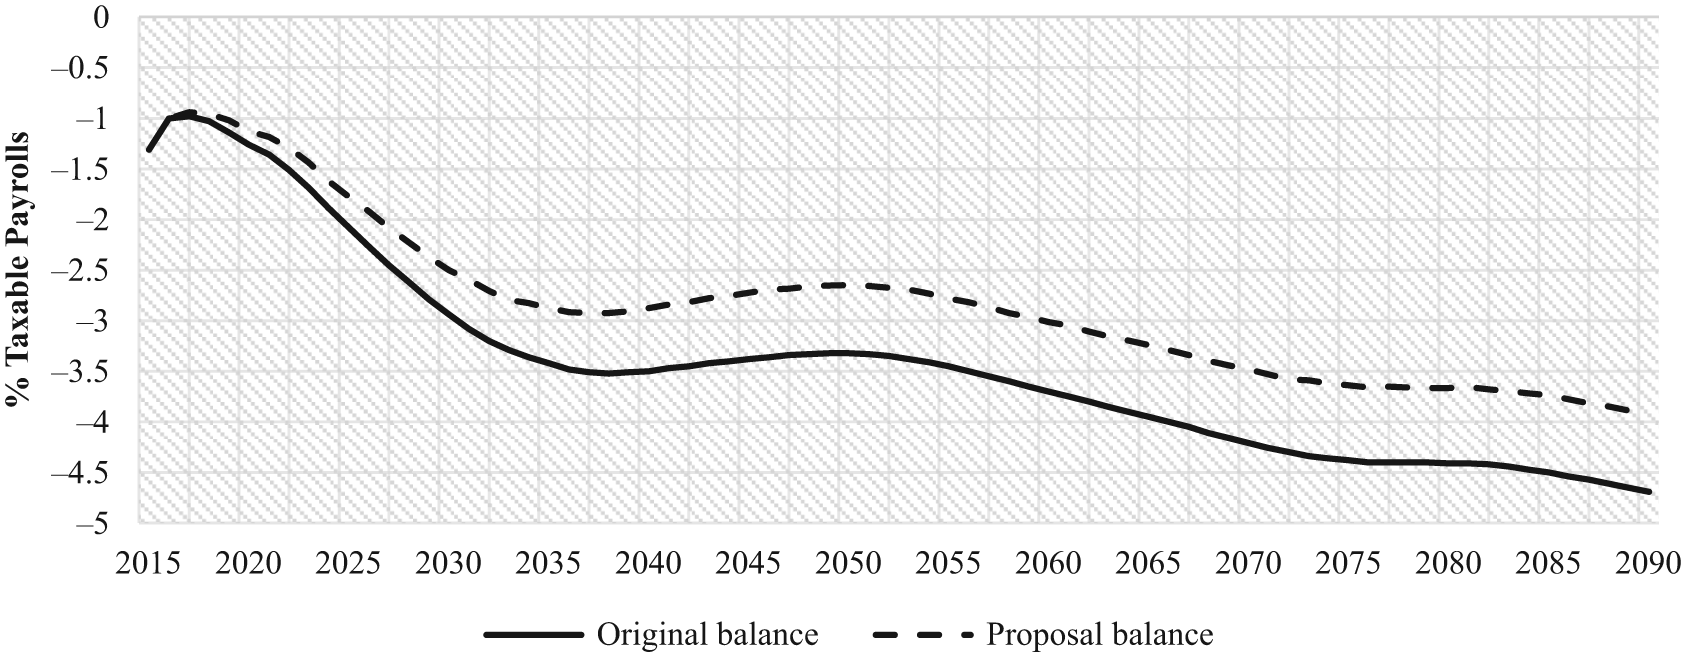
We find that the updated savings are in line with previous estimates of the savings resulting from using the C-CPI-U, but it is important to recognize that deficits have increased over the last three years. These increasing deficits actually create greater nominal savings for a chained COLA. However, the reduction in the Trust Fund balance and changes to the assumptions between 2011 and 2014 reduce the relative percentage savings from the proposal. This unfortunate reduction in the relative cost savings of switching to the C-CPI-U confirms the observation that the longer it takes to act, the lower the relative benefit achieved by adopting the proposal will be.
The second part of the proposal recommends providing a survivor’s bonus to OASDI participants when they reach an advanced age. We could not find any previous analysis that provided a bonus based on cohort life expectancy, but the Social Security Administration38 produced a report that explored the results of providing a 5% one-time increase in benefits at age 85. This report found that the one-time benefit increase would increase the 75-year actuarial deficit by 0.1% of taxable payroll based on the intermediate assumptions. Unfortunately, the income and cost rate calculations were not shown in this report; therefore, we could not update it as we did with the 2011 analysis, which applied the C-CPI-U uniformly. However, it is likely that this benefit would not increase significantly from the earlier time period, because many of the changes that resulted in higher actuarial deficits were due to macroeconomic assumptions reflecting the recession and reduced long-run economic activity. In any case, this 2011 study suggests that a larger 10% bonus may reasonably be expected to increase the deficit by about 0.2% of taxable payroll.
The overall effect of the two parts to our proposal would be to reduce the actuarial deficit. If a 5% one-time benefit were given to survivors sometime in their mid-80s and the CPI is chained as discussed, the percentage reduction in the actuarial deficit is estimated to be 18.0% over the 75-year period. With a 10% benefit hike and the chained CPI, the reduction in the deficit would reasonably be around 14.2%. These nontrivial savings can extend the Trust Fund balance if the proposal is enacted in the near term. Of course, the beneficiaries’ sacrifice must be matched by sacrifices from other stakeholder groups in order to secure the long-term financial solvency of Social Security.
Evaluating the proposal and other benefit cuts
This section addresses the reasons why adopting the C-CPI-U combined with a one-time bonus for those living to an advanced age is superior to other commonly considered ways of cutting benefits. It continues the analysis in the discourse register that policymakers use; later in the article, we directly consider “policy feasibility” or, more bluntly, how these changes might be “sold” to legislators and the public. Decision makers are fully aware of the fact that the elderly have demonstrated great resistance to changes in both Medicare and Medicaid benefits in the past. Emphasis on the longevity bonus for the old-old allows the proposal to be accurately described as an enhancement to Social Security. The perception is widespread among both the elderly and experts that increasing numbers of Americans are living to an advanced age, but they lack the financial resources to sustain themselves late in life, when they are typically most vulnerable.Reference Pearson, Quinn, Loganathan, Datta, Mace and Grabowski30, Reference Span31, Reference Johnson and Wang39 This proposal addresses the very real public problem of impoverished very old Americans while simultaneously serving as the cornerstone of a compromise to secure Social Security solvency. The change to the C-CPI-U, then, can be seen as the technical financial tweak necessary to enable Social Security to address these two pressing twenty-first-century needs.
This proposal to secure a contribution from Social Security beneficiaries toward reducing the future Trust Fund shortfall, while doing minimal harm to beneficiaries, is something of a technical fix.Reference Derthick40 Legislation addressing complex and controversial issues with automatic “mechanisms” that are far from transparent to the general public are common in Medicare and Social Security. Medicare examples include the Prospective Payment System that introduced diagnosis-related groups to hospital finance and the even more recondite resource-based relative value scale used to pay physicians. These systems have remained in force for some 40 and 30 years, respectively, which suggests that they were not abject failures.
An advantage of a “tech fix” is that few voters or legislators will make the effort to understand it, but they are generally happy to accept the technical authority that it seems to embody. Once adopted, a tech fix removes some vexed issue that needed fixing from the political agenda for several election cycles or until negative consequences become apparent. Sometimes a tech fix does ameliorate the problems that its sponsors claim it addresses, as we believe our proposal would do. The trick is to make sure the technical fix is plausibly related to the problem. In the case of debates about indexing the Social Security benefit, it misses the point to argue whether the C-CPI-U does a better or worse job of capturing precisely the inflation experienced by retirees than the CPI-W currently used. The fundamental issue for Social Security is political: how to ensure the long-run solvency of OASDI in order to maintain faith in Social Security and solidarity among workers and retirees while avoiding undue hardships for beneficiaries. Overcoming this challenge will be easier if Social Security beneficiaries and their advocates address the Social Security financing problem while it is still relatively fixable.
Although it is useful to have teams of economists refining ever more accurate measures of inflation, it is important to remind ourselves that these measures are all averages. Hence, they may do an excellent job of summarizing key indices of overall economic performance for a nation, but even the best measures will not describe the experience of most individuals. The truth of this observation is especially compelling for out-of-pocket spending on health care by the elderly. (Health care and housing are the only two spending categories in which, on average, elderly spending increases exceed rates of spending by younger Americans.) In the language of statisticians, the variance of American consumers’ purchasing around the mean is much too great to predict individual experience. Thus, in 2011, traditional fee-for-service Medicare beneficiaries had median out-of-pocket costs of $3,595 and mean costs of $5,041, but 10% had median costs of $10,426 and mean expenses of $19,189.Reference Noel-Miller41 Those with a chronic disease or disability are likely to fall into the high end of the distribution of out-of-pocket costs year after year.
Sooner or later, supporters of the Social Security program will be forced to accept some reduction in benefits. A change to the C-CPI-U is far superior to other options for reducing future Social Security benefits, especially if beneficiaries in their mid-80s receive the protection of a one-time bonus. The alternatives include increasing the age for the full benefit beyond 67, where it will be in 2025, and means testing the benefit to reduce the amount received by more affluent beneficiaries. Proponents of increasing the age and means testing should be reminded that both of these measures were adopted in the 1983 compromise, when 67 was made the endpoint of a phased increase in eligibility age and the Social Security benefit of more affluent taxpayers began to be counted as taxable income. Each of these measures generated greater long-term deficit reduction than the other items in the 1983 reforms, with the increase in age of full retirement amounting to 0.65% of payroll and benefit taxation, 0.6% of payroll.Reference Bernstein and Bernstein20 The new eligibility age is well known, but the institution of means testing in the same legislation seems largely to have escaped notice except by Howard,Reference Howard and Hudson42 probably because it has been categorized as a revenue increase.
The provision that earmarked the tax on half of some Social Security benefits for the OASDI Trust Fund (and later 35% of the remainder to benefit Medicare) constitutes the most efficient, effective, and just way to means test an individual’s benefit. (Only half the Social Security benefit is taxed, on the theory that double taxation should be avoided: a worker’s contribution is likely to have been taxed in the year earned, but employers’ FICA taxes typically count as a business cost and are not taxed.) In 2018, taxation of Social Security benefits generated $35.0 billion or 3.5% of OASDI income.16
If policymakers want to adjust pensions by recipients’ income (means testing), at least three considerations make taxable income the ideal form of means testing. First, the individual tax filer is only taxed if taxable income exceeds $25,000 ($32,000 for joint returns), thereby avoiding levies on lower-income beneficiaries. Second, using the tax system to reclaim a significant portion of more affluent recipients’ benefits is simple: 85% of the value of the benefit counts as taxable income, leaving the progressive income tax to apply the appropriate marginal rate to the total personal income. More affluent tax filers will pay higher taxes on their benefits. Third, no process to determine which beneficiaries deserve special consideration or what proportion of their benefit should be taxed because of particular individual situations is required. The tax code allows each tax filer to establish his or her special circumstance through deductions for health care expenses, charitable contributions, business losses, state and local taxes, and so on.
Taxation is a very effective and fair way to means test a cash benefit, but that approach is already almost maximized. Those wishing to introduce further means testing through the tax system might try to tax the remaining untaxed 15% of the Social Security benefit. To exploit all avenues for raising Social Security revenues, the exemption of tax filers with incomes below $25,000 or $32,000 from Social Security benefit taxation could be reduced or even eliminated entirely. Neither of these measures would produce a large revenue windfall. In particular, lowering the threshold is hardly worth the effort and political pain that expanding the taxable base would require. Because the threshold is not indexed, over time, more and more low-income taxpayers will have incomes large enough to trigger Social Security benefit taxation. And, of course, most who live on a small Social Security benefit and little else will continue to be exempt from the personal income tax.
Introducing additional means testing outside of the provisions for taxing the benefit would be a great mistake. Significant direct means testing of benefit payments would create a grave dangers for the program in the long term, because political support for Social Security depends on the solidarity generated by the near-universal enrollment in and need for Social Security.Reference Bernstein and Bernstein20 Moreover, many of those who have relatively high incomes as workers or early retirees have high rates of spending and limited wealth, and therefore they are counting on receiving the full Social Security benefit that they have been promised. Families belonging to disadvantaged racial or ethnic minorities, in particular, often have built up less wealth even though their current incomes may be large. To take away some of the benefit would also unjustly penalize those who have been thrifty and may not “need” the full benefit but are counting on it.
Further increases in eligibility age for the full benefit should also be rejected. It would create an unfair hardship for those whose work involves hard physical labor, which often becomes increasingly difficult for workers in their 50s and 60s to perform. Recent data using five measures of poor health recorded at ages 55–57 and 58–60 showed that the age cohort that must wait until 66 to qualify for full benefits was in significantly worse health than those who could retire at 65 or more than 65 but less than 66.Reference Choi and Schoeni43 Excess mortality as well as greater population morbidity is becoming a problem in twenty-first-century America. Experts are concerned about the recent U.S. failure to maintain previous rates of increase in American life expectancy. U.S. life expectancy rose in tandem with average life expectancy in peer Western European countries and Japan from 1960 to 1980, but since then, it has lagged the increases in life expectancy of our peers. The fact that “by 2005 U.S. life expectancy had fallen nearly 2 years below the average life expectancy in Western European populations” led the Institute of Medicine to establish the goal of reaching “parity with high resource peer nation averages” by 2030.Reference Kindig, Nobles and Zidan44 Consequently, many Americans forced to work to older ages may be faced with foreshortened time to enjoy retirement with the full benefit.
Reflective Americans should also question pressuring workers to remain employed longer, because of the implications for what is already widely acknowledged as our workaholic culture.45, Reference Ray, Sanes and Schmitt46, Reference Brooks47 The knee-jerk response of raising the retirement age yet again to solve a relatively small financial problem reinforces that stereotype. Perhaps our greater per capita income should be used to encourage and support U.S. citizens who choose pursuits other than career and money making in the last phase of their lives.
One idea to mitigate the impact of efforts to extend workforce participation on those doing hard physical labor might be to define eligibility for the full benefit by the number of years in the workforce (i.e., of Social Security contributions) rather than by chronological age. Many workers who perform taxing physical labor enter the workforce as full-time workers at relatively young ages; by this measure, they would qualify at younger ages for full benefits by their long record of workforce participation. In contrast, white-collar workers on the whole spend more time in education and out of the workforce and would therefore typically be a bit older when they qualify for the full benefit. However, those with extended periods of unemployment and those who voluntarily left the workforce to raise young children would be disadvantaged if work-years were substituted for age. Immigrants who arrive as adults would also be disadvantaged if Social Security eligibility were no longer defined principally by age.
Raising new revenues for Social Security
If benefits are to be cut by adopting the C-CPI-U as part of efforts to eliminate the long-term shortfall in Social Security revenues, increased revenues must make up the rest of the deficit. The shared pain approach to solving long-term Social Security insolvency requires revenue increases that impact those who are not beneficiaries. Fortunately, there is a much wider range of untapped options for raising revenue than for benefit cuts. The most obvious is to increase the 6.2% payroll tax paid by both individual workers and employers. Another is to require that the payroll tax be levied on all earned income, as is currently the case with the much smaller Medicare tax of 1.45% (2.9% combined employee-employer tax). A much less drastic change in the payroll tax is to make a modest increase in the maximum amount of earnings on which the current payroll tax is levied. Finally, following many precedents in Social Security’s past, those with unearned income could be regarded as a new class of eligible beneficiaries allowing income up to the earnings cap to be taxed for the benefit of the OASDI Trust Fund and subsequently to be included in calculating an individual’s benefit.
In recent discussions of Social Security, raising the tax rate on employees and/or employers is generally dismissed on the grounds that the payroll tax is high enough. To raise it further would push up employers’ cost to create new jobs. Both job creation and no-new-taxes pledges are the modern political shibboleth in the United States. Yet it seems arbitrary to argue that a 12.4% combined payroll tax is feasible but that 12.6% is impossible. Perhaps the pursuit of long-term Social Security solvency in a context of shared pain might allow 0.1% to be added to employer and employee payroll taxes.
In contrast to reluctance about suggesting payroll tax increases, the idea of eliminating the maximum taxable earnings cap is often proposed by those who see such a measure as serving both to shore up the Social Security Trust Funds and to reduce income inequality. Levying the payroll tax on all earned income would substitute a flat tax on all wage and salaried employees for a regressive tax that takes a higher proportion of income from workers earning less than $132,900 (in 2019) than from those exceeding the taxable income cap.48 To attack income inequality in America by levying the Social Security payroll tax on all earned income betrays a misunderstanding of both the inequality that is targeted and Social Security’s financing. Unearned income such as rent income, royalties paid to authors and performers, investment earnings, and a host of other income streams, including income generated by inherited wealth, are the source of a considerable portion of income inequality but escape Social Security payroll taxes.
In addition to doing little to reduce income inequality, eliminating the cap on taxing earned income would also erode the widespread support that Social Security has long enjoyed. Imposing a tax of over 12% on top of federal and state personal income taxes on dollars that are already subject to the highest marginal income tax rates would reduce the value to the employee (and employers) of any wage increase for well-remunerated professionals, the self-employed, and skilled employees such as computer coders. Some of the affluent object to current Social Security contributions on the grounds that the individual can secure a higher return for their coerced contribution by investing it themselves.Reference Derthick40, 49 This objection would become much more compelling if the limit on taxable earnings was entirely eliminated. The proposal both violates the social insurance principle that all economic classes should benefit from the program and creates a strong incentive for the affluent to advocate against compulsory participation in a program whose taxes would become much greater than any benefit that could possibly be received. Moreover, all those receiving wages and salaries already pay the Medicare tax on all earnings. For those in the tax brackets starting at $200,000 (single) and $250,000 (married filing jointly), there is an added Medicare supertax to help fund the Affordable Care Act (ACA).
However, a less drastic change that would not greatly threaten the principle of solidarity would be to increase the indexed cap on taxable earnings by some modest amount. Currently, the cap is calculated to tax 84% of wages and salaries; it used to tax 90%Reference Campbell and Hudson50 or more.Reference Derthick40 A return to 90% or a modest increase of 10% would need to be phased in over a multiyear period to avoid disrupting household budgets and to make it more palatable. Raising the cap even by a small percentage could generate considerable revenue, especially if paired with the next alternative.
The last source of additional revenues requires asking why Social Security must depend entirely for its funding on taxing wages and salaries (and taxing benefits). In principle, there is no reason why unearned income of those required to pay personal income tax should not also be taxed up to the earnings cap to contribute to the OASDI Trust Funds. Taxing this income is in keeping with a long tradition in the expansion of Social Security to cover population categories that had not previously been included. When Social Security began, it was mainly for industrial and commercial workers.Reference Berkowitz, Kingson and Schulz51 Paid farm labor, for example, was initially excluded but added early in the program’s history. Especially when additional revenue was needed, new categories of workers were added. Thus, the 1983 provisions mandated the coverage of newly hired federal employees and most of the remaining uncovered employees of nonprofits.Reference Light18, Reference Bernstein and Bernstein20 Because new employees generate immediate revenue but earn benefits that are paid years later, past coverage expansion has between particularly useful for its impact on revenue in the earlier years of the 75-year horizon.
However, inclusion of unearned income in calculating taxable earnings would have its largest effect in increasing the taxable income of workers currently covered by Social Security rather than increasing the number of potential beneficiaries. Moving a greater amount of taxable income closer to the cap on taxable income would produce more revenue to redistribute to lower-paid workers throughout the 75-year horizon, because benefits paid by the Trust Funds are progressive, with lower-income beneficiaries receiving a higher proportion of their contributions than those with higher taxed incomes. Thus, this distribution of additional revenue pushing employees closer to the taxable maximum is exactly the revenue source that the Social Security actuaries would find most useful.Reference Bernstein and Bernstein20 Of course, those whose unearned income is added to wage and salary income for purposes of the Social Security tax would still receive the benefit of more dollars than lower-income beneficiaries or what their wages alone would have generated, and those dollars would enjoy the critical COLA protection against price inflation.
Expanding the taxable income base by including unearned income would not be technically difficult or expensive. Unearned income is easily reported (along with verifiable documentation) on the personal income tax filings for the previous year, just as the W-2 employer report already includes the amount of Social Security payroll taxes paid. Individuals with incomes so low that they do not have to pay any tax should be exempt, even if they file in order to collect the earned income tax credit. Because there is no employer, unearned income would only be taxed at the 6.2% rate rather than the combined 12.4% for wages and salaries. To reflect this difference between earned and unearned income, some adjustment that reflects the proportion of their contribution that lacks a matching employer contribution would need to be made in calculating the benefits of retirees. With only the potential beneficiary’s half of the Social Security contribution coming into the Trust Fund, it would seem most logical that these contributions would boost the ultimate benefit by half of that generated by wages and salaries paid in the same year.
Discussion
The preceding pages have explained a carefully reasoned and fact-based path to a new compromise that would maintain the solvency of Social Security for the remainder of this century. The first section was devoted to explaining our innovative proposal for restructuring benefits to create significant savings while protecting the oldest beneficiaries. Its length was required both by the technical nature of the proposal and by our desire to provide important information about Social Security that is largely unknown or underappreciated. However, we regard our more succinct review of the alternatives for raising revenues to be equally important.
The largest portion of the new resources necessary to ensure Social Security solvency must come from increasing revenues rather than savings generated by reduced benefits; therefore, it is important to consider long-term effects in choosing which revenues to expand. In particular, supporters of Social Security must be careful not to undermine the fact that almost all Americans need Social Security to guarantee an adequate, if not comfortable, income in old age and for protection against disability during working years. The fact that everyone pays something for these protections but nobody suffers confiscatory taxes is the reason why social insurance programs—Social Security and Medicare in the United States—received and subsequently have retained such broad support that the program’s opponents do not openly propose their abolition.Reference Pierson52 In contrast, health care coverage under the ACA is fragmented among employment-sponsored health insurance, Medicare, expanded Medicaid, and the new subsidized markets for the purchase of health insurance and continues to be attacked 10 years after its enactment. Yet the ACA now seems to be gaining public support.Reference Jacobs and Mettler53, Reference Chattopadhyay54
Thus, our comprehensive review of options for increasing Social Security revenue suggested a mix of modest increases in the taxable earnings cap, a small increase in the payroll tax, and the collection of the individual payroll tax on the unearned income of those whose wages and salaries alone do not exceed the maximum that is subject to the Social Security tax.
Political feasibility
Of course, any Social Security legislation that can be enacted in the first half of the next decade must be politically feasible. Policy adoption involves several analytically identifiable, concurrent development paths; KingdonReference Kingdon55 recognizes three: the policy, political, and problem streams. The first involves developing policies that can be presented to other policy experts, think tanks, and legislative staffers as plausible ways to address a public problem. The second involves advocating some policy to the broader audience—legislators, advocacy groups, lobbyists, and the public. If the longevity bonus is budget neutral or part of a plan to generate savings, this larger audience can be expected to provide political support for a policy proposal that aids the oldest beneficiaries, who are presumed on the basis of good evidence to be deserving.
Skeptics might easily ask, why devote so much effort honing a proposal for Social Security reform now? In this hyperpartisan atmosphere with the party that struggled so hard to defeat Social Security in control of the senate and the presidency, such a specific policy proposal might easily be considered a waste of time.Reference Derthick40 This challenge needs to be met on two levels. One is an analysis of political and institutional factors that could potentially constitute sufficient conditions to generate a shared pain compromise. (It would be sheer lunacy to claim to outline the necessary conditions for such a transformation, because the real world of contingency can never be so constrained—Hempel’s covering-law theory to the contrary notwithstanding.Reference Hempel56, Reference Dray and Fetzer57) The other explanatory level of political feasibility is in terms of the conceptual frameworks developed by policy analysts observing patterns and regularities in policymaking.
An important first step is to explain how we view our study of Social Security. We have focused on the technical problems of outlining a practical compromise and only intimated in the preceding sections why political actors might be willing to adopt our plan. In terms of Kingdon’sReference Hempel56 well-known conceptual framework, we have labored to produce and defend a feasible technical policy that responds to the problem stream and constraints relevant to the specific provisions of our suggested compromise. We have not felt it useful simultaneously to respond to the demands generated by the politics stream. Nor, up to this point, have we speculated about “open windows” when contemporaneous, somewhat independent problem, policy, and political streams converge to move an issue and its possible policy and political solution onto the agenda for likely government action. Of course, items seriously on the government agenda sometimes—perhaps often—fall off the agenda without any fundamental action being taken. (The “repeal and replacement” of the ACA by the 115th Congress provides a telling example.)
Situational factors.
Three considerations suggest that conditions in the mid-2020s might produce an opening for a well-crafted policy proposal such as the one we offer. One barrier to change in Social Security is the adamant opposition of powerful interest groups. Attempts to change Social Security or Medicare benefits run up against a classic case of concentrated costs and diffuse benefits. As younger age groups still in the workforce struggle to maintain their position in a precarious economy, advocates for elderly Americans can no longer dominate the political landscape as they once did. For good reason, changing the benefit structures of these social insurance programs used to be considered the “third rail” of politics—touch it and you were politically dead. Yet President George W. Bush’s Prescription Drug Act of 2003 and the numerous political sallies by Paul Ryan suggest that altering entitlements is no longer unimaginable, even if neither is still in Washington. Political actors will have to be very cautious in navigating these rapids in the political stream.
Although the public is generally reluctant to embrace provisions that raise revenues or cut benefits in such programs as Social Security, the greatest resistance to a shared pain compromise will undoubtedly come from interest groups representing the elderly who fear benefit cuts. Some of these groups, such as the National Committee to Preserve Social Security and Medicare, built themselves as fierce resisters of any attempt to restrict benefits.Reference Day58, Reference Brandon, Bradley, Litman and Robins59 However, wiser heads among the “Gray Lobby”Reference Pratt60 may come to accept the fact that entitlements are no long politically sacrosanct, as explained earlier. The longevity bonus for the very aged provides just the sort of sweetener that reasonable advocacy groups can emphasize in their very public grudging acceptance of negative changes in benefits as part of a broader compromise that promises long-term solvency. An increased willingness by the public to question long-established entitlements will likely generate a response—however reluctant—by elderly interest groups that will allow some consideration of changes in Social Security. This dynamic constitutes a change in Kingdon’s political stream; the worsening federal financial picture that has developed only recently, on the other hand, alters the problem stream.
Seniors’ interest groups also need to be very sensitive to the fact that as the federal government is forced to pay increasing amounts in interest on a rapidly growing debt, resurgent deficit hawks in both parties will demand some visible action to address the increasingly troubled federal financial problems. The magnitude of the federal financial problems was not widely recognized at the time of this writing (prior to the 2018 midterm elections), but it will become readily apparent in the first half of the 2020s unless there is uncharacteristic and forceful legislative intervention. According to the New York Times, the current federal budget involves spending $800 billion more than revenues, based on Congressional Budget Office analyses; next year’s deficit will exceed $1 trillion according to the Office of Management and Budget.Reference Tankersley61
The Trump tax reform legislation, which cut the standard corporate tax rate from 35% to 21%, led to a one-third decline in federal receipts from corporate profits taxes in the first half of 2018 compared with the same period in 2017, despite the booming economy. The legislation also increased the ability of corporations to offset taxes on earnings with investment spending. Moreover, companies holding overseas earnings are allowed to repatriate them by paying the tax on them over eight years.Reference Tankersley14 Yet on the individual side of the federal revenue ledger, wage gains have hardly exceeded inflation,Reference Leonhardt62 although in early 2019, the wage picture was beginning to look a little brighter.
The president has suggested that his unexpected deficit in federal revenues will be made up by increased income from his new tariffs levied in pursuit of trade wars. However, only about $5 billion will be generated by the new tariffs promulgated by the beginning of August 2018 (on top of $35 billion that the Treasury would collect without the new, higher tariffs). Using the tariff rates mentioned for all new tariffs the administration has threatened and assuming (pace reality) that Americans would continue to buy the much more expensive imported goods in the same volume, the New York Times estimated that new revenues would amount to some $135 billion a year.Reference Leonhardt62 At the same time, the administration is proposing new spending for subsidies to farmers hurt by the president’s trade war ($12 billion) and the proposed space force ($8 billion for starters).Reference Tankersley14, Reference Cooper63 If those budget-busting expenditures are still speculative, increases in military and nonmilitary spending passed this year will total $94 billion; if incorporated in next year’s budget, those increases will grow to $139 billion.Reference Leonhardt62
The third consideration suggesting that political actors may feel forced some time in the 2020s to pry open a window for restructuring the Social Security benefit is the logic implicit in a largely unheralded change introduced in the Tax Cuts and Jobs Act of 2017 (P.L. 115-97). Although it has received almost no attention in the media, the Tax Cuts and Jobs Act mandates that tax authorities begin using the C-CPI-U.64 The CPI-U, for example, has long been used outside of Social Security to define inflation-indexed thresholds, including the brackets defining marginal tax rates. Because the C-CPI-U more accurately represents prices and consumption by the U.S. urban population, adopting the chained CPI can be justified as a technical correction that closes unintended loopholes in tax law, entitlement programs, and other inflation-sensitive aspects of federal policy. Chaining the CPI results in decreasing inflation-driven increases in tax brackets and therefore imposes higher marginal rates on taxpayers as their income rises. Over time, filers’ taxable incomes will move into higher tax brackets more quickly than previously; consequently, federal revenues will rise more rapidly than under current law. The Institute on Taxation and Economic Policy (2017) forecasts that lower increases in tax brackets will begin affecting middle- and upper-class taxpayers by 2025, but the act’s effects on the inflation-adjusted thresholds of the earned income tax credit will begin to reduce that critical subsidy for more than 20% of low-income childless workers in 2019.
In effect, then, the same legislation that cut marginal tax rates for the next eight years enacted a tax increase over the long run. For older Americans and their advocates, who generally oppose any change in the benefit, this change in tax law is a likely harbinger of future legislation that will extend the chained CPI methodology to Social Security and other domestic entitlement and welfare programs. Deficit hawks, who decry the rising costs of entitlement programs, will argue that chaining the CPI index is a logical extension of the principles already incorporated in tax law.
This subsection has pointed out observable factors in the current political environment that could embolden political actors to address the vexing but ultimately tractable issue of long-term Social Security solvency.Reference Sommer13 We first noted that the “third rail” of politics now carries much lower voltage than it did 40 years ago. This development is much more conducive to opening negotiations than the situation that faced Congress and President Reagan in 1983. The financial problems facing the federal government in the next decade provide a powerful incentive to open this policy window. Social Security solvency provides political actors with a very visible opportunity to be seen chipping away at the federal deficit. The third factor, adoption of the C-CPI-U for income taxes, ought to lead advocates for the elderly to enter into negotiations to avoid the devastating consequences for the old-old if Congress extends the same principles used in the tax reform legislation to Social Security benefits. Accepting a restructured benefit that protects older Social Security beneficiaries by providing a one-time longevity bonus but still reduces Trust Fund outlays allows advocates to insist on increases in revenues that can achieve sustained Social Security solvency, thereby eliminating the basis of future demands for benefit cuts.
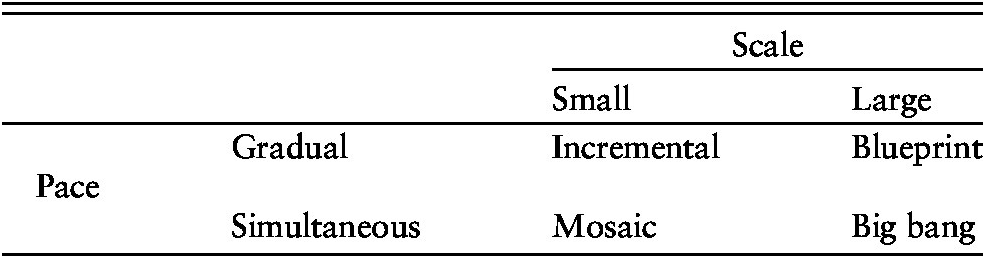
We believe that together these three prominent features of the current social, economic, and political situation are sufficient to lead to fruitful negotiations over Social Security solvency, but we make no privileged claim for them; other analysts might point to other factors. Indeed, the recognition of the potential for punctuated equilibriumReference Hempel56, Reference Baumgartner and Jones65 and big bang enactmentReference Tuohy66 in agenda setting and policy adoption means policy change could easily emerge from entirely different background conditions. We must now turn from the uncertain exercise of specifying potential paths to political feasibility at the level of observable phenomena to analyze the nature and breadth of the proposals that we have made. Fortunately, this “theoretical” turn is made easier by a new conceptual framework from a leading analyst of the policy process.
Relevant conceptual frameworks.
Relating our proposals for Social Security solvency to the theoretical literature in political science will complete our effort to produce a comprehensive proposal. It is impossible, of course, to undertake a thorough review of the rich and theoretically acute policy literature, but we have already shown that our proposals belong to what KingdonReference Hempel56 usefully calls the policy stream. The previous subsection broadened our effort by indicating aspects of the current empirical situation that might make action on the important issue of solvency possible in the 2020s. Next we will show how our policy arguments made earlier in this article are appropriately grounded in “the argumentative turn.”Reference Fischer and Gottweis67 Our principal task in this subsection, however, is to show the connections between our proposals, the empirical situation, and theoretical frameworks for understanding policy change. More specifically, how does the likely 2020 political environment outlined here fit into the best thinking about possible action if a policy window opens? Fortunately, a new volume by Carolyn Hughes TuohyReference Fischer and Gottweis67 incorporates and builds on older policy writing. Her book has the advantage of focusing on what emerges when policy windows open, covering both enactment and implementation.
Earlier in this article, we repeatedly expressed concern about the possibility of eroding the solidarity that elicits support for social security from all socioeconomic classes. This constraint contrasts with technical constraints on seeking Social Security solvency, such as the 75-year time horizon and measuring solvency by taxable payroll. MajoneReference Majone68 emphasized the importance of policy constraints that come into prominence over the long term. Our repeated references to the importance of maintaining solvency to sustain political support over the years provide an excellent example of this kind of constraint. No one program change is likely to destroy solidarity forever, but many small changes inimical to solidarity will foster the spread of the ethos of maximized self-interest that can be the death knell of social insurance. Thus, the solidarity constraint is subject to a certain degree of flexibility, which Majone recognizes as its “probabilistic” character, but our arguments never suggest trading it off at the margins for some other good.
That observation is important to Majone,Reference Lindblom69 who challenged Herbert Simon for suggesting that the goals of policy amount to just another constraint. Goals, Majone points out, are utilities that can be traded off if greater utility can be attained through some alternative policy mix. However, constraints lose their meaning if they are not inviolable at some fundamental level.Reference Lindblom69 An example of a goal that would supplant our effort to achieve Social Security solvency would be enactment of a significant carbon tax earmarked for Social Security and Medicare and thereby rendering Trust Fund solvency a nonissue. In such a circumstance, maintaining the constraints of social solidarity and universal belief that individuals earn their benefit would be as important as ever.
The arguments for our policy proposals repeatedly use threats to solidarity as a compelling reason to favor one kind of revenue increase over another. In Section 1, we undertook the more difficult task of developing a workable benefit cut that would not harm the most vulnerable elderly and would not provide a shock either to the budgets of individual Social Security beneficiaries whom it affected or to the economy as a whole. While reflecting these self-imposed constraints, the policy goal that our benefit proposal achieved is appropriately flexible. Specifically, we suggested a one-time increase of 8% to 10% for beneficiaries of an advanced age, but the proposal leaves the details to policymakers at the time of enactment. Similarly, our proposal suggests the general idea of a one-time increase and illustrates it with a specific principle (achievement of average life expectancy at the time new beneficiaries become eligible for full benefits), but again, the details invite dealmaking in the enactment process. Thus, we have been very clear about the distinction between policy constraints and policy goals in formulating our policy proposal for a benefit cut and engaging in the discussion of revenue increases.
This reflection on the nature of our arguments for a comprehensive effort to achieve Social Security solvency prepares us to better understand the opportunity that a policy window might open in the first half of the 2020s. Tuohy’s reviewReference Fischer and Gottweis67 of health policy developments in the Netherlands, the United Kingdom, the United States, and her native Canada from 1980 to 2018 convinced her that differences in the pace and scale of policy change define the most important differences in policies on the government action agendas when a policy window opens. (The failed Clinton health reform is one of her case studies, so enactment cannot be a criterion for the existence of a policy window worthy of study.)
TuohyReference Fischer and Gottweis67 uses the two dimensions of pace and scale to create a fourfold table for classifying the policymaking strategies that are most likely to emerge in different political and policy environments (Table 1). Incremental change strategies have been recognized as the most common policy path in the U.S. legislative process since David LindblomReference Lindblom69, Reference Lindblom70 first highlighted the similarity between this sort of policy process and markets. In Tuohy’s framework, incremental strategies are characterized by their small scale and slow pace—that is, a series of small changes are made over time, and those changes do not typically remake fundamental policy or transform institutions. An example of an incremental health policy is the 2004 change in Canada’s Medicare policy emerging from a meeting of the federal and provincial prime ministers that only enlarged funding and adjusted intergovernmental responsibilities but made no attempt to take advantage of a genuine opportunity for fundamental reform. None of the three U.S. health policy cases that she studied is classified as incremental.
Policy strategy type by scale and pace.

Source: Authors’ adaptation of Carolyn Hughes Tuohy, Remaking Policy: Scale, Pace, and Political Strategy in Health Care Reform (Toronto: University of Toronto Press, 2018), Figure 1.1, p.14.
The antithesis of an incremental strategy (diagonally opposite in Table 1) is the big bang change, a major innovation that occurs all at once. Tuohy’s examples of big bang change are the founding of the British National Health Service (1945–1946) and the Clinton health reform (1993–1994) that failed in Congress. Small changes that happen all at once—small scale, fast paced—are characterized as mosaic strategy (rather than incremental, which implies that separate small changes occur over time). Her U.S. examples are the enactment of Medicare and Medicaid in 1965 and the ACA (2009–2010).
The diagonal opposite of mosaic policy strategies are blueprint strategies, which are gradual in pace of change but large in scale. Blueprint policy strategies appear to be rare in health policy: Tuohy only has one case fitting this cell in Table 1, the turn toward universal managed competition in the Netherlands, which unfolded between 1987 and 2006. Blueprint strategies are possible when all relevant parties agree to the planned program, the coalition in power can count on controlling the policy adoption process (including overcoming attempted vetoes), and new institutions and operating program need to be established. While few health policies that would qualify as blueprint strategies come to mind, this alternative to the ad hocery of incrementalism achieved modest attention in the U.S. policy literature when the federal government enjoyed the capacity and sufficient popular trust to aspire to large achievements such as landing a man on the moon.71 Doubters might object that the blueprint that was followed in reaching the moon was implementation of an executive and legislative commitment made at a specific and concentrated period of time. Yet Tuohy’s classification includes implementation, which leads the reader to infer that executive direction of the continual changes in a complex technical implementation process necessary to land on the moon and return qualifies as a case of blueprint policymaking in the United States.
Our proposals for Social Security solvency seem to qualify as “mosaic.” The proposal is certainly small scale: it should be planned to raise no more than the funding necessary to ensure Social Security solvency over the next 75 years with enough reserves to withstand severe and lengthy economic hardship. Some of the revenue provisions will need to be phased in to allow individuals and employers to adjust, but spacing and delay in implementation are not disqualifying for mosaic policy strategies. The ACA counts as a mosaic strategy, despite major provisions, such as the health insurance marketplaces that only became operational four years after enactment and other provisions that took even longer to go into effect. Perhaps the major objection to considering as mosaic the solvency proposals or a shared pain compromise that embodied them is that the scale is so much smaller and the change so much less fundamental than either passage of Medicare and Medicaid in 1965 or the ACA. Yet classifying a shared pain compromise as incremental would require that it be a series of acts of policy adoption moving toward the goal of solvency in successive limited comparisons of possible target revenue or saving streams and the funding needed to stave off insolvency for the next few years.
Perhaps classification according to the Tuohy scheme depends on the background against which the policy is assessed. A shared pain policy addressing the issue of Social Security solvency might clearly be mosaic in the context in which we have proposed it, but simultaneously it could function as an incremental part of an effort to chip away at the ever-changing budget difficulties that will face the United States in the next decade. Similarly, adjusting the inflation index by adopting the C-CPI-U might be considered incremental, because that action extends the logic already in current tax law. Thus, how to classify a new policy may depend on the narrative that the analyst gives: what is regarded as the problem to which the policy is a response and how final or adequate is the policy for that problem definition.
The previous subsection listed three factors—entitlements’ declining immunity from criticism, increasing concern about federal deficits, and extension of chaining CPI-U calculations—that together might allow a policy window to open for legislation on Social Security solvency in the 2020s. A fourth consideration—the actual policy proposals—must play a major part in determining which strategy cell best fits the objective conditions generated by the interaction of the three factors. Throughout this essay, we have talked about the shared pain necessary for an adequate compromise that will eliminate the solvency issue. But how the pain is felt matters a great deal. The ideal pain is one that occurs far enough in the future that those who will suffer find it hard to imagine or may not even be identifiable at the time of policy adoption. It also helps to overcome reluctance to accept pain if its cause, such as chaining the inflation index, is so arcane that few beneficiaries will understand what might happen in future. Both of these considerations should help to mitigate resistance by Social Security beneficiaries to the proposed benefit restructuring.
In contrast to the concentrated costs of benefit cuts, two of the proposed revenue increases—raising the payroll tax and cap on taxed earnings—would have modest impacts on most workers’ incomes. Therefore, negotiators can hope that opposition to raising revenues will be limited, if the future problems of Social Security or the federal budget difficulties in the next decade can stifle an immediate outcry of “no new taxes.” Legislation enacting these two revenue increases should ensure that they do not begin at the same time, because some individuals paying the payroll tax and all employers will be subject to both kinds of increases. Ideally, an increase in payroll taxes of 0.001%, which would raise the greatest revenue, should begin the year after enactment. Perhaps to ease the burden on employers, it ought to be implemented in two portions. Increasing the threshold on which the payroll tax is levied could be phased in over three to five years, perhaps staggered to avoid threshold rises in years with payroll tax increases.
The third proposal, requiring individuals to pay the same payroll tax (currently 6.1%) on unearned income up to the Social Security tax cap, is politically dicey. The most compelling arguments for extending both the tax and Social Security benefits to all income rest on the fairness of treating all incomes equally if benefits are increased commensurately and the pressing need for adequate revenue to end the threat of Social Security insolvency. The political actors involved in forging the shared pain compromise will have to determine whether expanding the Social Security payroll tax to unearned income is possible in the political situation that they face. Perhaps, like the age qualification for the full Social Security benefit, taxing unearned income will need to be phased in slowly over 20 or 30 years.
Income and health
This article began by pointing out two reasons why Social Security is an important social determinant of health in the United States: its benefit constitutes a significant portion of the income of most older Americans as well as those unable to work because of long-term disability, and it provides the only guaranteed protection against the ravages of inflation in the United States. Indeed, it is difficult to imagine any social determinant of health that does not involve money in some way. The U.S. Centers for Disease Control and Prevention mentions “life-enhancing resources” and economics in the definition of social determinants quoted at the beginning of this article.Reference Brennan-Ramirez, Baker and Metzler4 Yet adequate income and wealth are not prominent in discussions of health, perhaps because the disciplines of economics and public health are too often compartmentalized in separate silos and largely taught in different university colleges. In light of the fact that income maintenance is not commonly discussed in relation to health, the final paragraphs of this discussion return to the claim that preserving adequate benefits under Social Security is relevant to health policy.
Policy analysts who study the connections between poverty and health often substitute the somewhat reified concept of “socioeconomic status” for “poor” or “low-income.” The usual measures of socioeconomic status are income (or, less commonly, wealth, an important variable influencing resiliency in the face of economic hardship) and education: both income and education are indicators of “social status.” However, that last term also suggests social or cultural prestige or ranking in society.Reference Barr72 Although they often go together, counterexamples show that the three dimensions are conceptually independent and occur empirically in varied mixes. The mafia don, who has great power and wealth but little formal education and low general social status despite the deference of cronies and the underworld more broadly, is a vivid example demonstrating the less than total correlation of the elements constituting socioeconomic status. Although salaries of college professors used to be much lower in comparison with population averages than they are at present, in an era when few people even earned a bachelor’s degree, faculty at the many colleges in small towns throughout America often enjoyed local prestige. The problem of poverty among destitute aged college professors was so great that long before President Franklin D. Roosevelt initiated Social Security, the Carnegie Foundation for the Advancement of Teaching responded by establishing the nonprofit Teachers Insurance Annuity Association of America in 1918 to foster pension plans in colleges and universities.
Researchers have found significant associations between poor health and each of the elements of socioeconomic status—income, education, and social status.Reference Gertner, Rotter and Shafer73 Low education levels are highly correlated with poor literacy, but measures of the narrower notion of “health literacy” in a population are often even lower than general literacy. Lower social status has been associated with greater stress and low self-esteem and their myriad sequelae. (Anecdotally, it would appear that mafia bosses have shorter lives than the general population, but that effect may be the result of imprisonment, with its multiple unhealthy consequences.) A recent well-designed state level study revealing a relationship between income and one major cause of death showed a significant inverse correlation between increases in states’ minimum wages (2006–2016) and age-adjusted suicide rates.Reference Gertner, Rotter and Shafer73 An analysis of a 2014 nationally representative survey revealed that those 65 and older needing long-term services and supports in greater amounts in order to avoid institutionalization find it difficult to pay for them for any lengthy period of time; the financial problem was greatest for singles and those 85 and older.Reference Johnson and Wang39
For this article, establishing the connection between financial poverty and poor health is sufficient to support our argument that Social Security and its continued solvency for the rest of the century is an important social determinant of health. Yet it is important to note that Social Security is also relevant to social status. Social Security has always been framed as a benefit earned by its recipients through monthly payments during their working lives. Emphatically, it is not “welfare” in the peculiar sense of a “handout” or charity that prevails in American discourse: avoiding that stigma (which can lead to low self-esteem or even self-loathing) is a defining characteristic of social insurance. It is true that, on average, low-income workers will receive a greater proportion of contributions by them and their employers than those with higher wages and salaries. However, the role of Social Security in redistributing incomes has always remained in the background. The need to continue broad-scale support of Social Security as it exists (perhaps with provisions to broaden the individual contribution to include unearned income) was critical in the evaluation of proposed avenues for increasing revenues earlier in this article. The touchstone for keeping everyone’s contributions modest in relation to the individual’s income preserves the ideal of social solidarity and the promise of continuing political support generated by communal feelings of shared values in support of an earned benefit.
The connection between income and health is both direct and mediated. The most obvious unmediated connection in societies that have evolved beyond subsistence farming is the necessity of income (including transfer funds such as the Supplemental Nutrition Assistance Program or SNAP) to procure food in amounts sufficient to forestall starvation. Clear examples of the relevance of income for health that are mediated by intervening variables are the necessity of funds to pay for electricity or other fuel required to survive extreme heat and cold and to enhance healthy nourishment by food preservation (refrigeration) and preparation (cooking). Heat waves are notorious for causing death among isolated elders and those who lack air conditioning. But environments in extremis are not necessary for poverty to cause death. A lifetime of bad eating habits and little exercise often leads to obesity and its comorbidities such as high blood pressure, diabetes, and cardiovascular compromise.
It is a mistake to focus exclusively on individual behaviors. Neighborhoods in which the poor are concentrated often become “food deserts” where stores selling fresh produce cannot be found. With transportation costly in terms of money and time, such populations often have no option other than to consume the cheap processed foods of little or no nutritional value sold in neighborhood convenience stores or bodegas. Providing individuals with more education about healthy eating does little good if the availability of nutritious foods is lacking. Low-income persons who receive support from disability, old-age and survivor pensions, or the Veterans Administration have ongoing income streams that enable beneficiaries to act more like middle-class consumers; they are the sort of consumers needed in larger numbers to support supermarkets in their neighborhoods. Thus, maintaining the modest incomes of those living in poor neighborhoods who have spent years working or in military service is an important step in addressing the community-wide problem of providing the demand necessary to sustain markets for healthy food, private medical care, drug stores, and other neighborhood commercial enterprises that foster healthy lives.
Conclusion
This article began and ended by explaining that income maintenance is a crucial part of the enlarged understanding of health and health care that has emerged over the last 70 years. That observation is especially true for older Americans, whose flourishing depends on a wide variety of changing social supports. The first section cited scholarly studies documenting the failure in recent years of the United States to match peer European countries in increasing life expectancy and decreasing morbidity and mortality.45 Many of the goods and services needed by older Americans are commodified in this market society. Thus, Social Security, the principal income support for older Americans, is arguably the central public policy concern for older Americans. It constitutes a significant part of the income streams of almost all older Americans. Moreover, Social Security is virtually the only income source in the United States that protects its recipients against the potential for devastating price inflation.
In endorsing a shared pain approach to solving the relatively small long-term Social Security deficit, this article has proposed a revision in the calculation of the COLA that involves chaining the price index that is most representative of purchases by the general urban population, the CPI-U. We estimated that our proposal, with its emphasis on a one-time bonus for those surviving to older ages to mitigate potential harsh effects on them, will save between 14.2% and 18.0% of the payroll deficit over the 75-year Social Security horizon. This technical fix to cutting the benefit by reducing the individual’s benefits slowly over the years is better than the two most common proposals for cutting benefits—raising the age of full benefit eligibility and means testing the benefit. The 1983 compromise that has sustained Social Security over the last 35 years employed both of those ways to reduce the benefit; together they constituted a very deep benefit cut that generated the bulk of program savings plus new revenues that were necessary to “save” Social Security for the next two or three generations. In fact, as Bernstein and BernsteinReference Bernstein and Bernstein20 pointed out, those benefit cuts constituted the two largest contributions toward maintaining solvency over the deficit period. Thus, only modest cuts in benefits are appropriate in the next round of contributions to fully fund Social Security for the next 75 years.
“Shared pain” means that others besides current and future beneficiaries must make sacrifices. Therefore, the analysis examined a number of potential measures that will raise additional revenues. A small increase in the payroll tax and a modest rise in the maximum wages and salaries subject to payroll taxes seem tolerable, especially in current expansionary economic conditions. Considerably larger amounts of new revenue would be generated if the employee tax were applied to unearned income up to the maximum cap (sum of earned and unearned income). This additional revenue source would create some new beneficiaries, but most of the individuals covered would already be eligible for Social Security. Because applying the individual’s 6.2% tax on unearned income can be efficiently collected along with income taxes, it will be easy to exempt low-income persons who are required to pay little or no income tax. In terms of inequality in the United States, making the individual contribution to Social Security universal would promote equality between those surviving on wages and salaries and those receiving rent, royalties, or income from investments.
Appendix A. An alternative methodology to measure inflation: Personal consumption expenditures
The personal consumption expenditures (PCE) deflator, an alternative measure of consumer cost changes developed for studies of long-term economic trends by the Bureau of Economic Analysis within the U.S. Department of Commerce, is not appropriate for calculating individuals’ Social Security COLA increases. The PCE is based largely on surveys of businesses, not surveys of household purchases, which underlie the BLS’s family of consumer price indexes.
By his own account, Scott Winship of the Manhattan Institute has long advocated for greater use of the PCE. He admits that the C-CPI-U is as good as the PCE in capturing substitution and therefore accurately determines current changes in the cost of living. WinshipReference Winship74 sees two problems with the C-CPI-U: its data requirements cause a significant time lag, and it cannot be used for longitudinal studies before 2000. The PCE is designed to study multiyear trends in an economy, but the second objection is irrelevant for the Social Security COLA, which only adjusts an individual’s benefit from one year to the next. Similarly, timely data is important for economic analysis, but Social Security benefit adjustment has always been calculated using older data.
The PCE deflator includes expenditures by third parties such as employers’ health plans on behalf of individuals, whereas the C-CPI-U includes only individual out-of-pocket costs, such as insurance premiums and patient cost sharing.Reference McCully, Moyer and Stewart75 The index used to increase individual Social Security benefits obviously should not include cost increases that beneficiaries themselves do not have to pay, although broader studies of the economy must include those costs.
Appendix B. Annual inflation measures using the CPI-U and C-CPI-U, 2000–2014
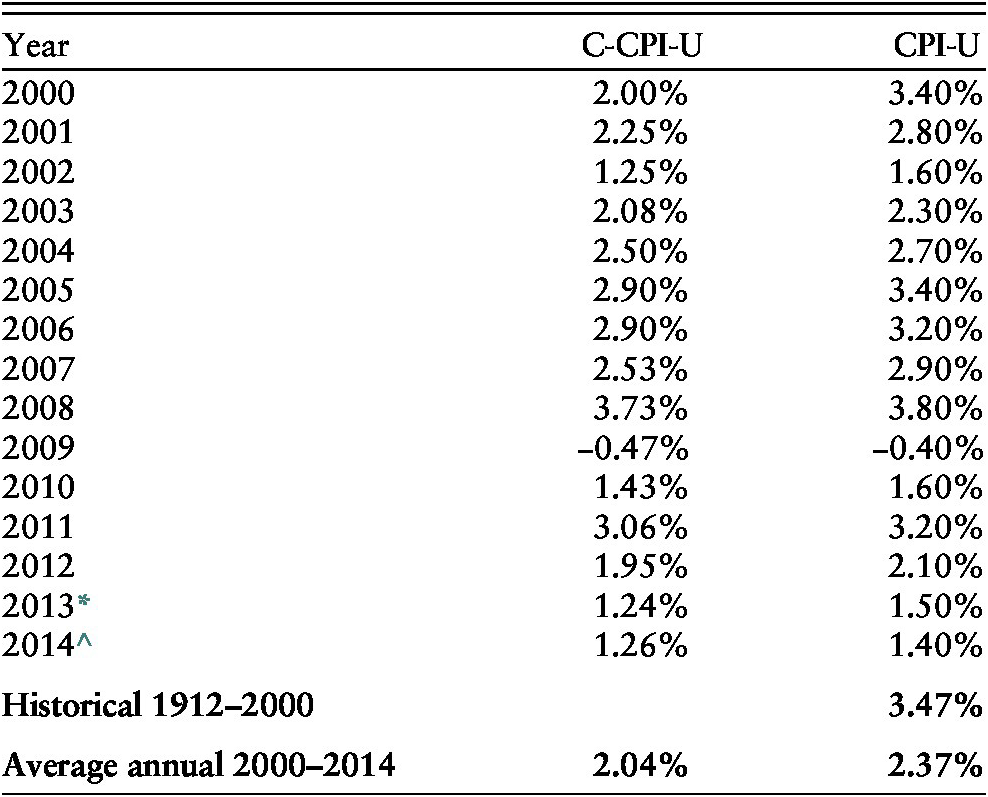
Source: Bureau of Economic Analysis, 2014.