1 Introduction
Dense suspensions of particles in low-Reynolds-number flows are ubiquitous in industry as well as in biological or natural flows. They display complex flow properties, intermediate between solid and liquid. The present study considers the ideal case of non-Brownian non-colloidal single-sized spherical particles embedded in a Newtonian fluid. However, even this simple suspension notoriously exhibits the complex non-Newtonian behaviours typical of actual suspensions (Stickel & Powell Reference Stickel and Powell2005; Morris Reference Morris2009). Recent advances in understanding the complex physics of suspensions have rested on detailed experiments and numerical simulations. Simulations provide access to some micromechanical details not easily available in experiments, such as the three-dimensional microstructure, flow field or hydrodynamic and contact forces between particles. In particular, the Stokesian dynamics (SD) (Brady & Bossis Reference Brady and Bossis1988; Sierou & Brady Reference Sierou and Brady2002) has been instrumental in providing insights into suspension physics. To a large extent, the current knowledge concerns unbounded suspensions, since most simulations – especially SD – usually consider an infinite domain by using periodicity conditions in all directions.
Conversely, confined suspensions have received much less attention. Suspension flows in porous media, blood flow in capillaries or microfluidic devices are examples of situations where interactions with boundaries are predominant. This can lead to surprising effects, such as a negative quadratic dependence of viscosity with volume fraction (Davit & Peyla Reference Davit and Peyla2008) or swapping trajectories for two spheres in shear flow (Zurita-Gotor, Bławzdziewicz & Wajnryb Reference Zurita-Gotor, Bławzdziewicz and Wajnryb2007). Walls are also known to strongly alter particle diffusion (Michailidou et al.
Reference Michailidou, Petekidis, Swan and Brady2009; Yeo & Maxey Reference Yeo and Maxey2010a
). Work by Sangani, Acrivos & Peyla (Reference Sangani, Acrivos and Peyla2011) shows a significant increase in the stresslet of a particle close to a wall, by a factor of four. Usual rheological measurements make use of rheometers where the suspension is confined. Therefore, it is not completely known to what extent walls can alter the measured rheological quantities. There is now a debate concerning the sign of the first normal stress difference
 $N_{1}={\it\Sigma}_{xx}-{\it\Sigma}_{yy}$
(where
 $x$
and
 $y$
refer to the direction of velocity and velocity gradient, respectively), since available experimental results are controversial. Numerical simulations of unbounded suspensions using Stokesian dynamics (SD) (Sierou & Brady Reference Sierou and Brady2002), the force-coupling method (FCM) (Yeo & Maxey Reference Yeo and Maxey2010b
) or fictitious domains (Gallier et al.
Reference Gallier, Lemaire, Peters and Lobry2014b
) find a negative
 $N_{1}$
. Other simulations by Mari et al. (Reference Mari, Seto, Morris and Denn2014) show that prior to shear thickening, the average value of
 $N_{1}$
is nearly zero, but is dominated by large fluctuations. In contrast, experiments report either negative
 $N_{1}$
(Zarraga, Hill & Leighton Jr Reference Zarraga, Hill and Leighton2000; Singh & Nott Reference Singh and Nott2003; Dai, Bertevas, Qi & Tanner Reference Dai, Bertevas, Qi and Tanner2013), or almost zero (Couturier, Boyer, Pouliquen & Guazzelli Reference Couturier, Boyer, Pouliquen and Guazzelli2011), or positive
 $N_{1}$
(Lootens et al.
Reference Lootens, Van Damme, Hémar and Hébraud2005; Dbouk, Lobry & Lemaire Reference Dbouk, Lobry and Lemaire2013; Royer, Blair & Hudson Reference Royer, Blair and Hudson2016), or, at last, either positive or negative values depending on the size and polydispersity of particles (Gamonpilas, Morris & Denn Reference Gamonpilas, Morris and Denn2016). Interestingly, recent simulations by Yeo & Maxey (Reference Yeo and Maxey2010b
) in wall-bounded suspensions have shown that
 $|N_{1}|$
was smaller than in unbounded suspensions. This suggests that confinement may have a role on rheology in general, and on
 $N_{1}$
in particular. This is one of the motivations of the present work.
Walls are also known to affect the suspension flow field by inducing an apparent wall slip (Jana, Kapoor & Acrivos Reference Jana, Kapoor and Acrivos1995; Coussot Reference Coussot2005) which alters the effective shear in the suspension. They also promote a local ordering by forming particle layers, as confirmed by simulations (Singh & Nott Reference Singh and Nott2000; Nguyen & Ladd Reference Nguyen and Ladd2002; Kromkamp et al.
Reference Kromkamp, van den Ende, Kandhai, van der Sman and Boom2006; Yeo & Maxey Reference Yeo and Maxey2010b
). This wall-induced layering is also clearly visible experimentally by high-resolution particle tracking (Cheng, McCoy, Israelachvili & Cohen Reference Cheng, McCoy, Israelachvili and Cohen2011; Blanc, Lemaire, Meunier & Peters Reference Blanc, Lemaire, Meunier and Peters2013; Metzger, Rahli & Yin Reference Metzger, Rahli and Yin2013; Snook, Butler & Guazzelli Reference Snook, Butler and Guazzelli2015; Pieper & Schmid Reference Pieper and Schmid2016). A hexagonal ordering takes place close to walls and is attested for volume fractions
 ${\it\phi}$
as low as 0.48 (Yeo & Maxey Reference Yeo and Maxey2010c
). This wall-induced ordering can persist on large distances, typically 10
 $a$
, where
 $a$
is the particle radius. For strongly confined systems (channel width to particle radius ratio
 $L_{y}$
/
 $a<11$
), this order also depends on the commensurability between the channel width and the number of particle layers (Yeo & Maxey Reference Yeo and Maxey2010c
). Simulations by Bian, Litvinov, Ellero & Wagner (Reference Bian, Litvinov, Ellero and Wagner2014) also show that confinement increases viscosity, facilitates cluster formation, and is essential to observe hydrodynamic shear thickening.
This paper intends to improve the current knowledge of the role of walls on suspensions – especially rheology – using numerical simulations. In the present work, we make use of a fictitious domain approach, as detailed in Gallier et al. (Reference Gallier, Lemaire, Lobry and Peters2014a
). Our method explicitly solves long-range hydrodynamics and incorporates an adequate modelling of lubrication and contact forces. Wall–particle lubrication interactions will be specifically addressed in this work due to their relevance. The thorough study by Yeo & Maxey (Reference Yeo and Maxey2010b
) has already considered simulations on wall-bounded suspensions, and has brought many significant results on the role of confinement. The present study intends to go a step further by focusing on rheology (especially normal stress differences) as well as investigating the effect of friction, which has recently been shown to have a profound impact on the rheology of homogeneous suspensions (Fernandez et al.
Reference Fernandez, Mani, Rinaldi, Kadau, Mosquet, Lombois-Burger, Cayer-Barrioz, Herrmann, Spencer and Isa2013; Seto et al.
Reference Seto, Mari, Morris and Denn2013; Gallier et al.
Reference Gallier, Lemaire, Peters and Lobry2014b
). Section 2 presents a brief description of the numerical approach used. In § 3, we present suspension simulation results in simple shear flows and investigate the role of walls on suspension structure, flow field and rheology. Throughout this study, the magnitude of confinement is described by the ratio
 ${\it\kappa}$
of channel width
 $L_{y}$
to particle radius
 $a$
, i.e.
 ${\it\kappa}=L_{y}/a$
. Most simulations are conducted on moderately confined suspensions (
 ${\it\kappa}=20$
).
2 Numerical model
This section briefly describes the numerical method used; more details can be found in a previous paper (Gallier et al. Reference Gallier, Lemaire, Lobry and Peters2014a ). In a fictitious domain method, solid particles are supposed to be filled with a fluid having the same properties as the actual fluid. From a computational viewpoint, this means that a classical fluid problem is solved in the whole domain. Particles are thus considered as some regions of the fluid constrained to have a rigid body motion.
2.1 Review of the fictitious domain method
Particles are supposed to be rigid and homogeneous, whereas the fluid is assumed incompressible and Newtonian and is governed by the Stokes equations:
 $$\begin{eqnarray}\displaystyle & \boldsymbol{{\rm\nabla}}\boldsymbol{\cdot }\boldsymbol{u}=0, & \displaystyle\end{eqnarray}$$
 $$\begin{eqnarray}\displaystyle & \boldsymbol{{\rm\nabla}}\boldsymbol{\cdot }\unicode[STIX]{x1D7A2}+{\it\rho}{\bf\lambda}=0, & \displaystyle\end{eqnarray}$$
where
 ${\it\rho}$
and
 $\boldsymbol{u}$
are the fluid density and velocity, respectively, while
 ${\bf\lambda}$
is a momentum forcing term used to enforce the rigid body motion inside particles. For a Newtonian fluid, the stress tensor
 $\unicode[STIX]{x1D7A2}$
reads
 $$\begin{eqnarray}\unicode[STIX]{x1D7A2}=-p\unicode[STIX]{x1D644}+2{\it\eta}\unicode[STIX]{x1D640},\end{eqnarray}$$
where
 $p$
is the pressure,
 ${\it\eta}$
the fluid viscosity and
 $\unicode[STIX]{x1D640}$
the rate-of-strain tensor
 $\unicode[STIX]{x1D640}=(\boldsymbol{{\rm\nabla}}\boldsymbol{u}+\boldsymbol{{\rm\nabla}}\boldsymbol{u}^{\text{T}})/2$
. The fluid velocity inside each particle must comply with a rigid body motion, so that
 $$\begin{eqnarray}\boldsymbol{u}=\boldsymbol{U}+{\it\bf\Omega}\times (\boldsymbol{x}-\boldsymbol{x}_{g}),\end{eqnarray}$$
where
 $\boldsymbol{U}$
and
 ${\it\bf\Omega}$
stand for the particle translational and rotational velocities and
 $\boldsymbol{x}_{g}$
is the position of the centre of gravity of the particle. Particle motion is given by Newton’s equations, which read, neglecting inertia:
 $$\begin{eqnarray}\displaystyle & \boldsymbol{F}^{h}+\boldsymbol{F}^{c}+\boldsymbol{F}^{e}=0, & \displaystyle\end{eqnarray}$$
 $$\begin{eqnarray}\displaystyle & \boldsymbol{T}^{h}+\boldsymbol{T}^{c}+\boldsymbol{T}^{e}=0, & \displaystyle\end{eqnarray}$$
where forces
 $\boldsymbol{F}$
and torques
 $\boldsymbol{T}$
are decomposed into their hydrodynamic part (
 $h$
), contact part (
 $c$
) and external part (
 $e$
), which can include any external force, such as gravity. The Stokes equations are solved by finite differences on a staggered Cartesian grid using standard projection methods. Once particle velocities are known, their position is updated using a second-order Adams–Bashforth scheme. Most numerical details are skipped here and may be found in Gallier et al. (Reference Gallier, Lemaire, Lobry and Peters2014a
).
2.2 Lubrication model
Lubrication forces play a major role in concentrated suspensions and require adequate modelling. They are very short range in nature, so that they can usually not be fully resolved with the typical grids employed. The present lubrication model is described elsewhere (Gallier et al.
Reference Gallier, Lemaire, Lobry and Peters2014a
) and is only briefly addressed here. It is similar to the approach used in SD or FCM inasmuch as hydrodynamic interactions are split into long-range interactions – explicitly resolved – and short-range (lubrication) contributions that must be modelled since they can not be resolved. The grand resistance matrix
 $\unicode[STIX]{x1D64D}$
, that links hydrodynamic forces/torques and translational/rotational velocities, can therefore be written as
 $$\begin{eqnarray}\unicode[STIX]{x1D64D}\approx \unicode[STIX]{x1D64D}^{r}+\unicode[STIX]{x1D64D}^{nr}.\end{eqnarray}$$
The resolved part
 $\unicode[STIX]{x1D64D}^{r}$
formally describes the part of the interactions explicitly described by the numerical model, whereas the non-resolved part
 $\unicode[STIX]{x1D64D}^{nr}$
represents the contribution that can not be resolved with the actual grid. It is classically estimated by subtracting the resolved resistance matrix
 $\unicode[STIX]{x1D64D}_{2B}^{r}$
– obtained numerically on two-sphere configurations – from the exact theoretical two-sphere resistance matrix
 $\unicode[STIX]{x1D64D}_{2B}^{theo}$
known from lubrication theory (Kim & Karrila Reference Kim and Karrila1991). For a many-particle system,
 $\unicode[STIX]{x1D64D}^{nr}$
is constructed assuming a pairwise additivity of forces. The associated non-resolved lubrication force/torque
 $\mathbf{\mathscr{F}}^{nr}=(\boldsymbol{F},\boldsymbol{T})^{\text{T}}$
is related to particle velocities
 $\mathbf{\mathscr{U}}=(\boldsymbol{U},{\it\bf\Omega})^{\text{T}}$
by
 $$\begin{eqnarray}\mathbf{\mathscr{F}}^{nr}=\unicode[STIX]{x1D64D}_{FU}^{nr}\boldsymbol{\cdot }(\mathbf{\mathscr{U}}_{\infty }-\mathbf{\mathscr{U}})+\unicode[STIX]{x1D64D}_{FE}^{nr}:\unicode[STIX]{x1D640}_{\infty },\end{eqnarray}$$
where
 $\mathbf{\mathscr{U}}_{\infty }=(\boldsymbol{U}_{\infty },{\it\bf\Omega}_{\infty })^{\text{T}}$
and
 $\boldsymbol{U}_{\infty }$
,
 ${\it\bf\Omega}_{\infty }$
,
 $\unicode[STIX]{x1D640}_{\infty }$
are the unperturbed translational velocities, rotational velocities and rate-of-strain tensor, respectively. This force/torque
 $\mathbf{\mathscr{F}}^{nr}$
represents the lubrication portion of hydrodynamic interactions that can not be resolved by the numerical approach, and is directly included in (2.5)–(2.6) as an external force and torque. The hydrodynamic stresslet
 $\unicode[STIX]{x1D64E}^{h}$
is corrected from lubrication as well using a similar procedure. The deviatoric stresslet is written in resistance form and is similarly decomposed into a resolved and non-resolved part as
 $$\begin{eqnarray}\unicode[STIX]{x1D64E}=\unicode[STIX]{x1D64E}^{r}+\unicode[STIX]{x1D64D}_{SU}^{nr}\boldsymbol{\cdot }(\mathbf{\mathscr{U}}_{\infty }-\mathbf{\mathscr{U}})+\unicode[STIX]{x1D64D}_{SE}^{nr}:\unicode[STIX]{x1D640}_{\infty },\end{eqnarray}$$
where
 $\unicode[STIX]{x1D64E}^{r}$
corresponds to the resolved stresslet explicitly computed by the numerical method. The non-resolved resistance matrices
 $\unicode[STIX]{x1D64D}_{SU}^{nr}$
and
 $\unicode[STIX]{x1D64D}_{SE}^{nr}$
are obtained as described previously, and theoretical expressions are found in Kim & Karrila (Reference Kim and Karrila1991). Finally, a similar correction procedure is also applied to the trace of
 $\unicode[STIX]{x1D64E}^{h}$
– which represents the hydrodynamic contribution to particle pressure
 ${\it\Pi}$
– using the theoretical resistance functions from Jeffrey, Morris & Brady (Reference Jeffrey, Morris and Brady1993) and similarly reads
 $$\begin{eqnarray}{\it\Pi}={\it\Pi}^{r}+\unicode[STIX]{x1D64D}_{{\it\Pi}U}^{nr}\boldsymbol{\cdot }(\mathbf{\mathscr{U}}_{\infty }-\mathbf{\mathscr{U}})+\unicode[STIX]{x1D64D}_{{\it\Pi}E}^{nr}:\unicode[STIX]{x1D640}_{\infty }.\end{eqnarray}$$
2.3 Lubrication near a wall
Lubrication for wall–particle interactions is actually taken into account using a similar strategy. The non-resolved lubrication interactions are identified by subtracting the resolved interactions (obtained on particle–wall configurations with different gaps) from the theoretical interactions. Because the latter are addressed scarcely and incompletely in the literature, they are here described in more detail. The theoretical resistance expressions for the hydrodynamic force, torque, stresslet and particle pressure for a single particle close to a wall read
 $$\begin{eqnarray}\left[\begin{array}{@{}c@{}}\boldsymbol{F}\\ \boldsymbol{ T}\\ \unicode[STIX]{x1D64E}\\ {\it\Pi}\end{array}\right]={\it\eta}\left[\begin{array}{@{}ccc@{}}\unicode[STIX]{x1D63C} & \unicode[STIX]{x1D63D}^{\dagger } & \unicode[STIX]{x1D642}^{\dagger }\\ \unicode[STIX]{x1D63D} & \unicode[STIX]{x1D63E} & \unicode[STIX]{x1D643}^{\dagger }\\ \unicode[STIX]{x1D642} & \unicode[STIX]{x1D643} & \unicode[STIX]{x1D648}\\ \unicode[STIX]{x1D64B} & 0 & \unicode[STIX]{x1D64C}\\ \end{array}\right]\left[\begin{array}{@{}c@{}}\boldsymbol{U}_{\infty }(\boldsymbol{x})-\boldsymbol{U}\\ {\it\bf\Omega}_{\infty }(\boldsymbol{x})-{\it\bf\Omega}\\ \unicode[STIX]{x1D640}_{\infty }.\end{array}\right]\end{eqnarray}$$
Following the notations in Kim & Karrila (Reference Kim and Karrila1991), the resistance tensors are
 $$\begin{eqnarray}\displaystyle & \displaystyle \unicode[STIX]{x1D608}_{ij}=X^{A}d_{i}d_{j}+Y^{A}({\it\delta}_{ij}-d_{i}d_{j}), & \displaystyle\end{eqnarray}$$
 $$\begin{eqnarray}\displaystyle & \displaystyle \unicode[STIX]{x1D609}_{ij}=Y^{B}{\it\epsilon}_{ijk}d_{k}, & \displaystyle\end{eqnarray}$$
 $$\begin{eqnarray}\displaystyle & \displaystyle \unicode[STIX]{x1D60A}_{ij}=X^{C}d_{i}d_{j}+Y^{C}({\it\delta}_{ij}-d_{i}d_{j}), & \displaystyle\end{eqnarray}$$
 $$\begin{eqnarray}\displaystyle & \displaystyle \unicode[STIX]{x1D60E}_{ijk}=X^{G}\left(d_{i}d_{j}-{\textstyle \frac{1}{3}}{\it\delta}_{ij}\right)d_{k}+Y^{G}(d_{i}{\it\delta}_{jk}+d_{j}{\it\delta}_{ik}-2d_{i}d_{j}d_{k}), & \displaystyle\end{eqnarray}$$
 $$\begin{eqnarray}\displaystyle & \displaystyle \unicode[STIX]{x1D60F}_{ijk}=Y^{H}({\it\epsilon}_{ikl}d_{l}d_{j}+{\it\epsilon}_{jkl}d_{l}d_{i}), & \displaystyle\end{eqnarray}$$
 $$\begin{eqnarray}\displaystyle & \displaystyle \unicode[STIX]{x1D614}_{ijkl}=X^{M}d_{ijkl}^{(0)}+Y^{M}d_{ijkl}^{(1)}+Z^{M}d_{ijkl}^{(2)}, & \displaystyle\end{eqnarray}$$
 $$\begin{eqnarray}\displaystyle & \displaystyle \unicode[STIX]{x1D617}_{i}=X^{P}d_{i}, & \displaystyle\end{eqnarray}$$
 $$\begin{eqnarray}\displaystyle & \displaystyle \unicode[STIX]{x1D618}_{ij}=X^{Q}\left(d_{i}d_{j}-{\textstyle \frac{1}{3}}{\it\delta}_{ij}\right), & \displaystyle\end{eqnarray}$$
in which
 $\boldsymbol{d}$
is the unit vector from the particle centre to the wall. The fourth-rank tensors
 $d_{ijkl}^{(0)}$
,
 $d_{ijkl}^{(1)}$
and
 $d_{ijkl}^{(2)}$
can be found in Kim & Karrila (Reference Kim and Karrila1991). The third-rank transpose in (2.11) is such that
 $\unicode[STIX]{x1D60E}_{ijk}^{\dagger }=\unicode[STIX]{x1D60E}_{kij}^{\phantom{\dagger }}$
.
For plane walls and a shear flow (which will be the case in this study), the functions
 $X^{M}$
,
 $Z^{M}$
and
 $X^{Q}$
are actually not needed because the associated terms
 $d_{ijkl}^{(0)}E_{kl}$
,
 $d_{ijkl}^{(2)}E_{kl}$
and
 $(d_{i}d_{j}-1/3{\it\delta}_{ij})E_{ij}$
are zero in that case. The required resistance functions are therefore
 $X^{A}$
,
 $Y^{A}$
,
 $Y^{B}$
,
 $X^{C}$
,
 $Y^{C}$
,
 $X^{G}$
,
 $Y^{G}$
,
 $Y^{H}$
,
 $Y^{M}$
and
 $X^{P}$
. Some asymptotic near-wall developments are available only for
 $X^{A}$
,
 $Y^{A}$
,
 $Y^{B}$
,
 $X^{C}$
,
 $Y^{C}$
,
 $Y^{G}$
and
 $Y^{H}$
(see Yeo & Maxey (Reference Yeo and Maxey2010b
) for a compiled set of expressions), so that
 $X^{G}$
,
 $Y^{M}$
and
 $X^{P}$
seem to be missing in the literature. Since these functions are primarily connected with stresslet and particle pressure, this may confirm that the role of walls on rheology has not received much attention. In appendix A, we report the near-wall asymptotic expressions used in this work. They are taken from the literature, except for
 $X^{G}$
,
 $Y^{M}$
and
 $X^{P}$
, for which we propose new expressions.
2.4 Contact model
Contact interactions are modelled using Hertzian soft spheres. For a pair of spherical particles
 $i$
and
 $j$
(radius
 $a$
) undergoing contact, the contact force
 $\boldsymbol{F}^{c}$
is classically decomposed into its normal
 $\boldsymbol{F}_{n}^{c}$
and tangential
 $\boldsymbol{F}_{t}^{c}$
components:
 $\boldsymbol{F}^{c}=\boldsymbol{F}_{n}^{c}+\boldsymbol{F}_{t}^{c}$
. The normal contact force is modelled using a Hertz law
 $$\begin{eqnarray}\boldsymbol{F}_{n}^{c}=-k_{n}|{\it\delta}|^{3/2}\boldsymbol{n}\end{eqnarray}$$
in which
 ${\it\delta}=\Vert \boldsymbol{r}\Vert -2a$
is the overlap distance with
 $\boldsymbol{r}=\boldsymbol{x}_{j}-\boldsymbol{x}_{i}$
, and
 $\boldsymbol{n}$
is the normal vector
 $\boldsymbol{n}=\boldsymbol{r}/\Vert \boldsymbol{r}\Vert$
. Surface roughness is accounted for in the model by assuming sparse asperities of size
 $h_{r}$
. Contact is therefore supposed to take place whenever
 $\Vert \boldsymbol{r}\Vert \leqslant 2a+h_{r}$
, which corresponds to define a modified overlap distance
 ${\it\delta}^{^{\prime }}={\it\delta}-h_{r}$
. Hence, contact occurs if
 ${\it\delta}^{^{\prime }}\leqslant 0$
. Note that lubrication forces are, however, still evaluated with the actual distance
 ${\it\delta}={\it\delta}^{^{\prime }}+h_{r}$
, since the fluid is assumed to flow freely between asperities. In this work, the roughness size will be fixed to
 $h_{r}/a=5\times 10^{-3}$
, which is a typical roughness measured for suspension particles (Smart & Leighton Reference Smart and Leighton1989; Blanc, Peters & Lemaire Reference Blanc, Peters and Lemaire2011). Walls are assumed to be perfectly smooth. The normal stiffness
 $k_{n}$
in (2.20) is chosen sufficiently high so as to mimic rigid particles and the non-dimensional stiffness
 $k_{n}/{\it\eta}\dot{{\it\gamma}}a^{2}h_{r}^{-3/2}$
is approximately
 $2\times 10^{3}$
. This involves an average roughness deformation
 $|{\it\delta}^{^{\prime }}|/h_{r}$
lower than 0.1. The exact value of stiffness has been shown to induce negligible effects on rheology if it is sufficiently large (Gallier et al.
Reference Gallier, Lemaire, Peters and Lobry2014b
). For dense regimes, however, roughness can occasionally be deformed completely, leading to
 ${\it\delta}=0$
. This is not numerically tractable, since lubrication functions diverge at
 ${\it\delta}=0$
. To circumvent this problem, a threshold value of
 $10^{-6}a$
is prescribed when evaluating lubrication functions. This means that when lubrication functions are being computed, any normalized distance
 ${\it\delta}/a$
lower than
 $10^{-6}$
is fixed to
 $10^{-6}$
. This choice is similar to Sierou & Brady (Reference Sierou and Brady2001). Note that this threshold is useless and not considered when computing contact forces through (2.20).
The tangential force is given by
 $$\begin{eqnarray}\boldsymbol{F}_{t}^{c}=-k_{t}{\it\bf\Upsilon}\end{eqnarray}$$
in which
 ${\it\bf\Upsilon}$
is defined by integrating the slip velocity
 $\boldsymbol{U}^{s}$
during the contact duration
 $t_{c}$
 $$\begin{eqnarray}{\it\bf\Upsilon}=\int _{0}^{t_{c}}\boldsymbol{U}^{s}\,\text{d}t,\end{eqnarray}$$
where the slip velocity is
 $$\begin{eqnarray}\boldsymbol{U}^{s}=\boldsymbol{U}_{i}-\boldsymbol{U}_{j}-[(\boldsymbol{U}_{i}-\boldsymbol{U}_{j})\boldsymbol{\cdot }\boldsymbol{n}]\boldsymbol{\cdot }\boldsymbol{n}+(a{\it\bf\Omega}_{i}+a{\it\bf\Omega}_{j})\times \boldsymbol{n}.\end{eqnarray}$$
Using the classical Amontons–Coulomb law of friction, the actual tangential force magnitude is limited by the friction limit
 ${\it\mu}_{d}|\boldsymbol{F}_{n}^{c}|$
, where
 ${\it\mu}_{d}$
is the dynamic friction coefficient. The tangential stiffness
 $k_{t}$
is linked to the normal stiffness
 $k_{n}$
by
 $k_{t}/k_{n}=2|{\it\delta}^{^{\prime }}|^{1/2}/7$
(Shäfer, Dippel & Wolf Reference Shäfer, Dippel and Wolf1996; Silbert et al.
Reference Silbert, Ertaş, Grest, Halsey, Levine and Plimpton2001). Finally, the corresponding contact torque is
 $$\begin{eqnarray}\boldsymbol{T}^{c}=a\boldsymbol{n}\times \boldsymbol{F}^{c}.\end{eqnarray}$$
Contact forces also induce an additional contact stresslet and contact particle pressure that are given for a particle as
 $$\begin{eqnarray}\displaystyle & \displaystyle \unicode[STIX]{x1D64E}^{c}={\textstyle \frac{1}{2}}(\boldsymbol{F}^{c}\otimes a\boldsymbol{n}+a\boldsymbol{n}\otimes \boldsymbol{F}^{c}) & \displaystyle\end{eqnarray}$$
 $$\begin{eqnarray}\displaystyle & \displaystyle {\it\Pi}^{c}=-{\textstyle \frac{1}{3}}(\boldsymbol{F}^{c}\boldsymbol{\cdot }a\boldsymbol{n}). & \displaystyle\end{eqnarray}$$
Contact forces with walls are handled similarly. Particle–wall interactions are frictionless if particles are themselves frictionless. Conversely, the particle–wall interaction is frictional if particle–particle friction is considered. The wall is assumed to be perfectly smooth, but since particles are rough, they can experience an actual contact with the wall through particle roughness: particle–wall contacts therefore occur whenever
 ${\it\delta}\leqslant h_{r}$
.
2.5 Validation: single sphere near a wall
A validation for the wall–particle hydrodynamic interactions is proposed for a single force-free torque-free spherical particle in the vicinity of a wall in a shear flow. When a particle is close to a wall, wall–particle interactions alter the particle velocity and stresslet. In particular, the wall tends to impose its own velocity to the particle and this must be accurately predicted so as to model wall-bounded suspensions. The present case considers a single particle (radius
 $a$
) freely suspended in a linear shear flow of magnitude
 $\dot{{\it\gamma}}=2U_{w}/L_{y}$
, where
 $L_{y}=10a$
is the channel width and
 $U_{w}$
(resp.,
 $-U_{w}$
) is the velocity prescribed at the upper wall (resp., lower wall) in the
 $x$
-direction. The domain sizes in the velocity and vorticity directions are respectively
 $L_{x}=20a$
and
 $L_{z}=20a$
. The grid spacing is
 ${\it\Delta}=a/5$
and the time step is
 ${\rm\Delta}t=10^{-3}\dot{{\it\gamma}}^{-1}$
. Simulations are conducted for different particle vertical positions
 $Y$
in the channel, and we denote
 ${\it\xi}=(Y-a)/a$
the non-dimensional gap between particle surface and lower wall. The lubrication correction is activated for a non-dimensional gap lower than 0.2.
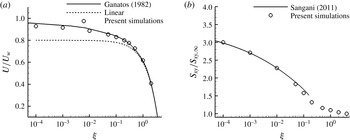
Figure 1(a) presents the particle translational velocity
 $U$
rescaled by the wall velocity
 $U_{w}$
. Reference simulations by Ganatos, Weinbaum & Pfeffer (Reference Ganatos, Weinbaum and Pfeffer1982) using a boundary collocation method are also reported. Results show that the effects of wall can be observed as soon as
 ${\it\xi}\lessapprox 0.5$
, since a deviation is noted from the expected linear profile (dotted line). Our simulations accurately match those from Ganatos et al. (Reference Ganatos, Weinbaum and Pfeffer1982), even in the very near-wall region. Wall effects grow as the particle comes closer to the wall and particle velocity rapidly departs from the linear profile, and asymptotes to the wall velocity
 $U_{w}$
.
Wall interactions also result in a significant increase in the particle stresslet, as seen in figure 1(b), which presents the non-dimensional hydrodynamic stresslet
 $S_{xy}/S_{xy,\infty }$
, where
 $S_{xy,\infty }$
is the stresslet of a unique particle in an unbounded domain
 $S_{xy,\infty }=10/3{\rm\pi}{\it\eta}a^{3}\dot{{\it\gamma}}$
. Similarly to the particle velocity, the particle stresslet increases rapidly in the near-wall region. Predictions are in good agreement with theoretical works by Sangani et al. (Reference Sangani, Acrivos and Peyla2011) (solid line in figure 1
b). This curve is given by the following asymptotic development, valid for
 ${\it\xi}<$
0.15
 $$\begin{eqnarray}\frac{S_{xy}}{S_{xy,\infty }}=\frac{0.847\ln {\it\xi}^{-1}-0.41+1.44{\it\xi}\ln {\it\xi}^{-1}-0.3{\it\xi}}{0.2\ln {\it\xi}^{-1}+0.6376}.\end{eqnarray}$$
This relation suggests that the stresslet
 $S_{xy}$
remains finite at contact and can reach
 $0.847/0.2\approx 4.2$
. This means that the stresslet
 $S_{xy}$
of a particle in contact with a wall is 4.2 times larger than the stresslet this particle would have in an unbounded domain.
Translational particle velocity
 $U/U_{w}$
(a) and particle stresslet
 $S_{xy}/S_{xy,\infty }$
(b) in a shear flow as a function of particle non-dimensional distance to wall
 ${\it\xi}=(Y-a)/a$
. Channel width is
 $L_{y}=10a$
. Solid lines in (a) simulations by Ganatos et al. (Reference Ganatos, Weinbaum and Pfeffer1982). Solid lines in (b) asymptotic expression by Sangani et al. (Reference Sangani, Acrivos and Peyla2011).

3 Effect of confinement: results and discussion
The objective of this study is to investigate the role of walls on suspensions, especially on rheology. Numerical simulations of suspensions are performed for different volume fractions in the range
 $0.1\leqslant {\it\phi}\leqslant 0.55$
. The computational domain is a cell of size
 $L_{x}$
,
 $L_{y}$
,
 $L_{z}$
in the direction of velocity, velocity gradient and vorticity, respectively. The channel width
 $L_{y}$
will be varied, whereas
 $L_{x}=20a$
and
 $L_{z}=20a$
. For
 $L_{y}=20a$
(the most investigated case) and
 ${\it\phi}=0.5$
, the total number of particles is approximately 1000. We recall that the magnitude of confinement is described by the parameter
 ${\it\kappa}$
, which is the ratio between channel width
 $L_{y}$
and particle radius
 ${\it\kappa}=L_{y}/a$
. An unbounded suspension has
 ${\it\kappa}\rightarrow \infty$
, whereas the minimum value
 ${\it\kappa}=2$
is reached for a gap having the same size as the particle. A shear flow of magnitude
 $\dot{{\it\gamma}}$
is imposed by moving upper and lower walls with opposite velocities. Periodic boundary conditions are used in
 $x$
(velocity direction) and
 $z$
(vorticity direction). The numerical parameters are a grid spacing
 ${\it\Delta}=a/5$
and a time step
 $5\times 10^{-4}\dot{{\it\gamma}}^{-1}$
. All runs are started using random hard-sphere equilibrium configurations obtained from a Monte Carlo procedure. For steady results, the initial strain (
 $\dot{{\it\gamma}}t<50$
) is discarded and the computation is continued for another 100–150
 $\dot{{\it\gamma}}t$
. Rheological properties are based upon the computation of the Batchelor particle stress
 ${\it\Sigma}_{ij}^{p}$
(Batchelor & Green Reference Batchelor and Green1972), which is the contribution of particles to the bulk suspension stress. It is further decomposed as
 $$\begin{eqnarray}{\it\Sigma}_{ij}^{p}={\it\Sigma}_{ij}^{h}+{\it\Sigma}_{ij}^{c},\end{eqnarray}$$
with
 $$\begin{eqnarray}\displaystyle & {\it\Sigma}_{ij}^{h}=n\langle S_{ij}^{h}\rangle & \displaystyle\end{eqnarray}$$
 $$\begin{eqnarray}\displaystyle & {\it\Sigma}_{ij}^{c}=n\langle S_{ij}^{c}\rangle , & \displaystyle\end{eqnarray}$$
where
 $S_{ij}^{h}$
and
 $S_{ij}^{c}$
are the hydrodynamic and contact stresslets, respectively,
 $n$
is the number density of particles and brackets
 $\langle \cdot \rangle$
indicate an ensemble average. For a linear shear flow, the relative viscosity
 ${\it\eta}_{r}={\it\eta}_{s}/{\it\eta}$
(where
 ${\it\eta}_{s}$
is the suspension viscosity) reads
 $$\begin{eqnarray}{\it\eta}_{r}=1+\frac{{\it\Sigma}_{xy}^{p}}{{\it\eta}\dot{{\it\gamma}}}.\end{eqnarray}$$
The normal stress differences are given by
 $$\begin{eqnarray}\displaystyle & N_{1}={\it\Sigma}_{xx}^{p}-{\it\Sigma}_{yy}^{p} & \displaystyle\end{eqnarray}$$
 $$\begin{eqnarray}\displaystyle & N_{2}={\it\Sigma}_{yy}^{p}-{\it\Sigma}_{zz}^{p}. & \displaystyle\end{eqnarray}$$
3.1 Wall-induced structuring
The onset of specific structures in the suspension can be monitored using orientational order metrics such as
 $Q_{6}$
and
 $C_{6}$
. The metric
 $Q_{6}$
is based on the spherical harmonics
 $Y_{lm}({\it\theta},{\it\varphi})$
of the orientational bond angles (
 ${\it\theta}$
,
 ${\it\varphi}$
) between particles, and is defined as (Rintoul & Torquato Reference Rintoul and Torquato1996)
 $$\begin{eqnarray}Q_{6}=\sqrt{\frac{4{\rm\pi}}{13}\mathop{\sum }_{m=-6}^{6}\overline{Y_{6m}}^{2}},\end{eqnarray}$$
where
 $\overline{Y_{6m}}$
represents the average
 $Y_{6m}({\it\theta},{\it\varphi})$
over the neighbouring particles. For a completely disordered system,
 $Q_{6}=0$
, whereas the maximal value
 $Q_{6}^{FCC}\approx 0.575$
is reached for a face-centred cubic structure. Another metric,
 $C_{6}$
, has been introduced by Kulkarni & Morris (Reference Kulkarni and Morris2009) to specifically track hexagonal structures. It is based on the three-dimensional pair-correlation function
 $g(r,{\it\theta},{\it\varphi})$
and given as
 $$\begin{eqnarray}C_{6}=\max _{{\it\psi}}\frac{\displaystyle \int _{0}^{2{\rm\pi}}g(2a,{\rm\pi}/2,{\it\varphi})\cos [6({\it\varphi}-{\it\psi})]\,\text{d}{\it\varphi}}{\displaystyle \int _{0}^{2{\rm\pi}}g(2a,{\rm\pi}/2,{\it\varphi})\,\text{d}{\it\varphi}}.\end{eqnarray}$$
The angle
 ${\it\psi}$
accounts for a possible tilt of the structure around the
 $x$
-axis. In our computations, however, we have always found
 ${\it\psi}=0$
, meaning that the obtained hexagonal structure is untilted.
 $C_{6}$
is 0 for a disorder random system and reaches 1 for a perfect hexagonal lattice. Note that, since particles are rough, they experience actual contact and, in (3.8), the pair-correlation function is therefore computed for
 $r\leqslant 2a+h_{r}$
.
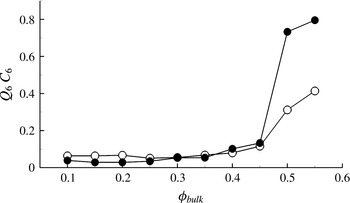
Figure 2 plots the evolution of
 $C_{6}$
and
 $Q_{6}$
with respect to the suspension volume fraction
 ${\it\phi}_{bulk}$
. Computations are performed for frictionless particles (
 ${\it\mu}_{d}=0$
) and confinement
 ${\it\kappa}$
=20. Both parameters have a similar profile, with very small values in dilute regimes and an abrupt increase for a volume fraction in the range 0.45–0.5. For this confinement (
 ${\it\kappa}=20$
), this marks the transition between disordered and ordered states. High
 $C_{6}$
values show that the system preferentially crystallizes into a hexagonal structure, in accordance with previous studies (Kulkarni & Morris Reference Kulkarni and Morris2009; Yeo & Maxey Reference Yeo and Maxey2010c
). Friction has a weak effect on this structuring, as will be seen later.
Order parameters
 $Q_{6}$
(○) and
 $C_{6}$
(●) as a function of volume fraction (
 ${\it\kappa}=20$
;
 ${\it\mu}_{d}=0$
).

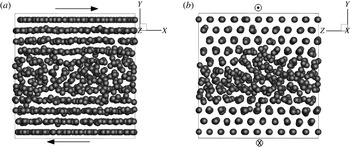
This structuring is easily noticed on particle snapshots, as illustrated in figure 3. This figure plots an instantaneous particle configuration at volume fraction
 ${\it\phi}_{bulk}=0.5$
and
 ${\it\kappa}=20$
in the shear plane
 $x$
–
 $y$
(side view, (a)) and in the velocity gradient–vorticity plane
 $y$
–
 $z$
(end view, (b)). For the sake of clarity, particles are represented at half their actual size. Particles are seen to form layers in the vicinity of the walls, whereas the core of the suspension remains disordered. The end view (plane
 $y$
–
 $z$
) in figure 3(b) clearly shows a hexagonal structure close to walls, with a given particle being at the centre of a hexagon formed by six neighbours.
Particle snapshots (
 ${\it\phi}_{bulk}=0.5$
;
 ${\it\kappa}=20$
;
 ${\it\mu}_{d}=0$
): (a) side view; (b) end view. For visualization, particle radius is half the actual size.

3.2 Wall effects on volume fraction
Since we are concerned with wall-bounded flows with periodicity imposed in the
 $x$
and
 $z$
directions, the average quantities depend on the vertical position
 $y$
. As proposed by Yeo & Maxey (Reference Yeo and Maxey2010b
), an average volume fraction
 $\langle {\it\phi}(y)\rangle$
can be defined as
 $$\begin{eqnarray}\langle {\it\phi}(y)\rangle =\frac{1}{L_{x}L_{z}}\left\langle \iint {\it\chi}(x,y,z)\,\text{d}x\,\text{d}z\right\rangle ,\end{eqnarray}$$
where
 ${\it\chi}$
is the particle indicator function, which is 1 in the particle and 0 elsewhere. Note that
 $\langle {\it\phi}(y)\rangle$
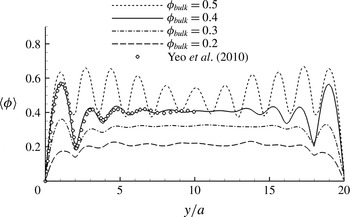
is rather an areal fraction, but it is known from stereology theory to be equal to the volume fraction (Delesse principle). Figure 4 presents this local volume fraction
 $\langle {\it\phi}(y)\rangle$
for four different bulk fractions
 ${\it\phi}_{bulk}$
in the case
 ${\it\kappa}=20$
and frictionless particles. Some simulation results by Yeo & Maxey (Reference Yeo and Maxey2010b
) at
 ${\it\phi}_{bulk}=0.4$
(
 ${\it\mu}_{d}=0$
) are also plotted. Local peaks in the wall region indicate the presence of a stable particle layering, which is also attested in other computations (Kromkamp et al.
Reference Kromkamp, van den Ende, Kandhai, van der Sman and Boom2006; Yeo & Maxey Reference Yeo and Maxey2010b
) or experiments (Cheng et al.
Reference Cheng, McCoy, Israelachvili and Cohen2011; Blanc et al.
Reference Blanc, Lemaire, Meunier and Peters2013; Snook et al.
Reference Snook, Butler and Guazzelli2015; Pieper & Schmid Reference Pieper and Schmid2016). This layering exists irrespective of the bulk volume fraction
 ${\it\phi}_{bulk}$
. However, for moderate fractions such as
 ${\it\phi}_{bulk}=0.2$
, it is much less pronounced and is noted only for the first two layers (
 $y/a<4$
). In present case (
 ${\it\kappa}=20$
), and for
 ${\it\phi}_{bulk}$
below 0.5, there is still a flat profile in the core. In this core region, the suspension is devoid of wall effects, and is therefore expected to behave like an unbounded suspension. In contrast, for
 ${\it\phi}_{bulk}=0.5$
, wall effects are dominant across the whole channel. This value is consistent with the rapid increase in order parameters, as seen in figure 2. The size of the wall-structured region
 $e_{wall}$
can be estimated from the spatial variations of
 $\langle {\it\phi}(y)\rangle$
. A rough criterion used here is to define
 $e_{wall}$
such that
 $a|\text{d}\langle {\it\phi}(y)\rangle /\text{d}y|/{\it\phi}_{bulk}>0.1$
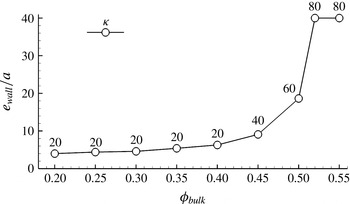
. To address dense suspensions, it is necessary to consider large domains so as to allow this wall structuring to freely develop. Results are compiled in figure 5 for frictionless particles, with the chosen confinement
 ${\it\kappa}$
specified for each volume fraction. For
 ${\it\phi}_{bulk}<0.4$
, the size of the wall structuring grows mildly with
 ${\it\phi}_{bulk}$
, from 3
 $a$
to 6
 $a$
. However, it increases abruptly for
 ${\it\phi}_{bulk}\gtrsim 0.4$
, even though larger domains are considered. For
 ${\it\phi}_{bulk}\geqslant 0.52$
, there is a marked organized structure across the whole domain despite the wide channel investigated
 $L_{y}=80a$
. In that case,
 $e_{wall}$
is set to
 $L_{y}/2=40a$
. This is not the physical value, but indicates only that the size could not be determined, since the whole suspension is ordered. Simulations in larger domains were not performed. This result is reminiscent of simulations from Kulkarni & Morris (Reference Kulkarni and Morris2009) and Sierou & Brady (Reference Sierou and Brady2002), who showed that, even in unbounded suspensions, there is a crystallization of the system for
 ${\it\phi}_{bulk}$
between 0.5 and 0.55 (although for
 ${\it\phi}\geqslant 0.6$
, the system could become disordered again; we have yet not considered such high fractions). This behaviour is close to a system of hard spheres with a freezing point at
 ${\it\phi}_{f}\approx 0.49$
. Since it can occur in infinite domains, the complete ordering noted in our simulations at
 ${\it\phi}_{bulk}=0.52$
and
 ${\it\phi}_{bulk}=0.55$
in large domains may not be due solely to walls. Monte Carlo simulations have showed that the crystallization of hard-sphere systems is faster when walls are present (Volkov et al.
Reference Volkov, Cieplak, Koplik and Banavar2002). It can therefore be considered as a wall-induced crystallization, since it is promoted by an existing local ordering. This crystallization is not experimentally attested in suspensions, which might be due to the present use of monodisperse particles, while experiments always consider slightly polydisperse particles.
Local volume fraction
 $\langle {\it\phi}(y)\rangle$
in the channel width for
 ${\it\kappa}=20$
and bulk fractions
 ${\it\phi}_{bulk}=(0.2,0.3,0.4,0.5)$
. Open symbols are computations by Yeo & Maxey (Reference Yeo and Maxey2010b
).

Size of the wall-structured region
 $e_{wall}$
as a function of bulk volume fraction
 ${\it\phi}_{bulk}$
(
 ${\it\mu}_{d}=0$
). The confinement
 ${\it\kappa}$
considered is provided as the numbers labelling the circles. For the last two points at
 $e_{wall}/a=40$
, the whole suspension is ordered.

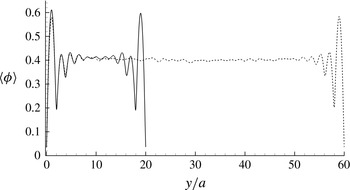
When the wall-induced ordering can develop freely, it does not seem to depend much on the channel height. Simulations at
 ${\it\phi}_{bulk}=0.4$
were conducted in a moderately confined suspension (
 ${\it\kappa}=20$
) and a weakly confined suspension (
 ${\it\kappa}=60$
). Results are presented in figure 6 and show very similar structure near walls (peak heights and positions). This absence of domain size influence was also reported by other simulations (Yeo & Maxey Reference Yeo and Maxey2010b
) and experiments (Eral et al.
Reference Eral, van den Ende, Mugele and Duits2009).
Volume fraction profile
 $\langle {\it\phi}(y)\rangle$
for
 ${\it\kappa}=20$
(solid lines) and
 ${\it\kappa}=60$
(dotted lines). Simulations at
 ${\it\phi}_{bulk}=0.4$
and
 ${\it\mu}_{d}=0$
.

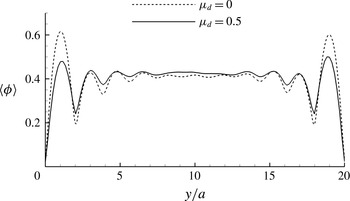
Let us conclude this section on volume fraction by investigating the role of friction. The same suspension at
 ${\it\kappa}=20$
and
 ${\it\phi}_{bulk}=0.4$
is computed for frictionless (
 ${\it\mu}_{d}=0$
) and frictional (
 ${\it\mu}_{d}=0.5$
) particles. The obtained volume fraction profiles are provided in figure 7 and globally share similar characteristics. However, frictional particles result in less marked peaks in the wall region, indicating a slightly weakened structuring. This is much clearer on the first particle layer, where the local volume fraction is lower in the case of friction. Intuitively, tangential contact forces between particles promote a more active momentum exchange between adjacent layers, which may contribute to destabilizing well-ordered layers. This may also be in connection with a higher diffusion noted for frictional particles (Gallier Reference Gallier2014).
Volume fraction profile
 $\langle {\it\phi}(y)\rangle$
for
 ${\it\mu}_{d}=0$
(dotted lines) and
 ${\it\mu}_{d}=0.5$
(solid lines). Simulations at
 ${\it\phi}_{bulk}=0.4$
and
 ${\it\kappa}=20$
.

3.3 Wall effects on particle velocity
The effects of walls on axial particle velocity
 $U$
can similarly be investigated using the following particle-phase average velocity
 $\langle U(y)\rangle$
(Yeo & Maxey Reference Yeo and Maxey2010b
)
 $$\begin{eqnarray}\langle U(y)\rangle =\frac{\displaystyle \left\langle \iint {\it\chi}(x,y,z)U^{(k)}\,\text{d}x\,\text{d}z\right\rangle }{\displaystyle \left\langle \iint {\it\chi}(x,y,z)\,\text{d}x\,\text{d}z\right\rangle },\end{eqnarray}$$
with
 $U^{(k)}$
the translational velocity at the centre of particle
 $k$
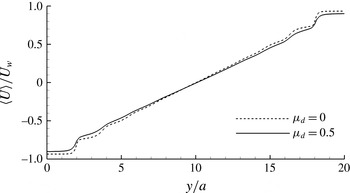
. Figure 8 presents this velocity profile, normalized by the wall velocity
 $U_{w}$
, for a suspension at
 ${\it\kappa}=20$
and
 ${\it\phi}_{bulk}=0.4$
for frictionless (
 ${\it\mu}_{d}=0$
) and frictional particles (
 ${\it\mu}_{d}=0.5$
). Both profiles are similar, with a linear evolution in the core of the suspension and a strong effect of walls on the velocity. The role of friction is limited, and tends to smooth velocity variations, in accordance with the previous effects on volume fraction. Because of significant wall-induced layering, the velocity is quasi-constant within a layer, and this forms plateaus in the velocity profile close to the walls. This is particularly noted for the first layer and is then progressively damped farther in the flow, until the expected linear profile is found in the centre of the suspension. In the first layer (
 $0<y<2a$
), the particle velocity is close to the wall velocity
 $U_{w}$
because of lubrication forces. It is still not exactly equal to wall velocity, mostly because of roughness. Since lubrication tangential forces scale as
 $\log {\it\xi}$
, they are bounded by
 $\log {\it\xi}_{r}$
, where
 ${\it\xi}_{r}=h_{r}/a$
is the non-dimensional roughness.
Particle-phase axial velocity
 $\langle U(y)\rangle /U_{w}$
for frictionless particles
 ${\it\mu}_{d}=0$
(dotted lines) and frictional particles
 ${\it\mu}_{d}=0.5$
(solid lines). Simulations at
 ${\it\phi}_{bulk}=0.4$
and
 ${\it\kappa}=20$
.

In their work, Jana et al. (Reference Jana, Kapoor and Acrivos1995) studied wall slip in suspensions and proposed an experimental correlation for the slip velocity
 $u_{e}$
as
 $$\begin{eqnarray}u_{e}=\frac{{\it\eta}_{r}}{8}\dot{{\it\gamma}}a,\end{eqnarray}$$
where
 $\dot{{\it\gamma}}$
here represents the local shear rate and
 ${\it\eta}_{r}$
is the overall suspension viscosity. This wall slip leads to a shear rate that is smaller than the macroscopic prescribed shear rate
 $\dot{{\it\gamma}}_{bulk}=2U_{w}/L_{y}$
. This shear rate
 $\dot{{\it\gamma}}_{Jana}$
reads
 $2(U_{w}-u_{e})/L_{y}$
and, accounting for (3.11), can be expressed as
 $\dot{{\it\gamma}}_{Jana}=\dot{{\it\gamma}}_{bulk}-\dot{{\it\gamma}}_{Jana}{\it\eta}_{r}/4{\it\kappa}$
. This eventually gives
 $\dot{{\it\gamma}}_{Jana}=\dot{{\it\gamma}}_{bulk}/(1+{\it\eta}_{r}/4{\it\kappa})\approx \dot{{\it\gamma}}_{bulk}(1-{\it\eta}_{r}/4{\it\kappa})$
. From the viscosity
 ${\it\eta}_{r}$
taken from our simulations at
 ${\it\phi}_{bulk}=0.4$
and
 ${\it\kappa}=20$
, Jana’s model gives
 $\dot{{\it\gamma}}_{Jana}/\dot{{\it\gamma}}_{bulk}\approx$
0.93 in the frictionless case (
 ${\it\eta}_{r}=6.0$
) and 0.89 in the frictional case (
 ${\it\eta}_{r}=9.1$
). These values can be compared to the numerical shear rate obtained by a linear regression of
 $\langle U(y)\rangle$
in the suspension homogeneous core
 $\dot{{\it\gamma}}_{core}=(\text{d}\langle U(y)\rangle /\text{d}y)_{5\leqslant y/a\leqslant 15}$
. From the profiles of figure 8, this regression yields
 $\dot{{\it\gamma}}_{core}/\dot{{\it\gamma}}_{bulk}\approx$
0.96 in the frictionless case and
 $\dot{{\it\gamma}}_{core}/\dot{{\it\gamma}}_{bulk}\approx$
0.89 in the frictional case, in good agreement with
 $\dot{{\it\gamma}}_{Jana}$
from Jana’s model.
Close to the walls, we have mentioned that the particle velocity is not exactly equal to the wall velocity
 $U_{w}$
. The scaled slip velocity
 $|-U_{w}-\langle U_{y=0}\rangle |/\dot{{\it\gamma}}a$
at the lower wall
 $y=0$
is approximately 0.6 and 1.0 in the frictionless and frictional case, respectively. It is not zero – meaning that particles are not stuck on walls – nor 0.5, which would be the expected velocity of a particle rolling without slip on the wall (assuming
 ${\it\Omega}_{z}=-\dot{{\it\gamma}}/2$
). This occurs mostly because the lubrication tangential force is bounded by
 $\log {\it\xi}_{r}$
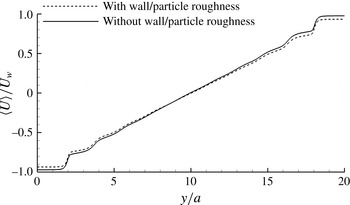
. This can be checked by investigating the case where particle roughness is discarded for interactions with the walls (however, roughness is still kept for particle–particle interactions). Particles can thus come arbitrarily close to the walls, with the possibility of vanishing distance between particles and walls. As seen in figure 9 (frictionless case), the velocity of the first particle layer is now much closer to the wall velocity. The slip velocity
 $|-U_{w}-\langle U_{y=0}\rangle |/\dot{{\it\gamma}}a$
is reduced irrespective of friction, and is approximately 0.3 (frictionless particles) and 0.4 (frictional particles), which is lower than in the case of wall–particle roughness (0.6 and 1.0 in the frictionless and frictional case, respectively). Because the wall–particle gap
 ${\it\xi}$
is reduced, lubrication tangential forces are higher and increase particle entrainment by the moving walls. In the case
 ${\it\xi}=0$
(actual contact), theoretical studies by Chaoui & Feuillebois (Reference Chaoui and Feuillebois2003) show that particles would indeed be stuck to the wall with translational velocity
 $U=U_{w}$
and zero rotational velocity. A linear regression of particle velocity in the core region gives that
 $\dot{{\it\gamma}}_{core}/\dot{{\it\gamma}}_{bulk}\approx 1$
in the frictionless case and 0.96 in the frictional case, suggesting a reduction of apparent wall slip.
Particle-phase axial velocity
 $\langle U(y)\rangle /U_{w}$
with and without wall–particle roughness. Simulations at
 ${\it\phi}_{bulk}=0.4$
,
 ${\it\kappa}=20$
and
 ${\it\mu}_{d}=0$
.

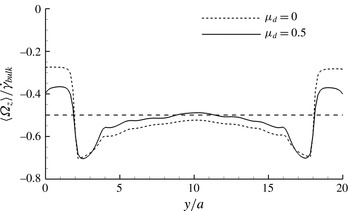
Finally, we investigate the effects of walls on particle rotation rate. Figure 10 presents the particle-phase angular velocity
 $\langle {\it\Omega}_{z}(y)\rangle$
scaled by
 $\dot{{\it\gamma}}_{bulk}$
for frictionless and frictional particles. In the suspension homogeneous core, a value close to the expected
 $-\dot{{\it\gamma}}_{bulk}/2$
is found. The noted effect of friction can be explained by the different core shear rate because of wall slip. Indeed, scaling by the core shear rate
 $\dot{{\it\gamma}}_{core}$
leads to the same value
 $\langle {\it\Omega}_{z}(y)\rangle /\dot{{\it\gamma}}_{core}\approx -0.54$
, irrespective of friction. Note that, unlike volume fraction, the profile shows no plateau, even in the suspension core, suggesting that the domain might be too small here to obtain a local homogeneity of the rotational velocity. A plateau is indeed found, but for larger channel height. Walls are found to play a significant role because tangential lubrication interactions hinder particle rotation. In the frictionless case, the rotation rate is roughly divided by two compared to the suspension core. In the theoretical case of a single smooth sphere at non-dimensional distance
 ${\it\xi}={\it\xi}_{r}=5\times 10^{-3}$
, the expected rotation rate (scaled by shear rate) is 0.249 (Chaoui & Feuillebois Reference Chaoui and Feuillebois2003), which is close to the average rotation rate in the first layer, approximately 0.275. In the frictional case, the additional tangential contact force imposes a torque on particles and increases rotation. On the walls, particles roll with partial slip, since the ratio
 $|a\langle {\it\Omega}_{z}\rangle /(\langle U_{y=0}\rangle +U_{w})|$
is less than 1. Interestingly, this ratio is approximately 0.4 for both frictionless and frictional particles. This value is consistent with the theoretical case of a single smooth sphere at wall distance
 ${\it\xi}_{r}$
, where this ratio is approximately 0.52 (Chaoui & Feuillebois Reference Chaoui and Feuillebois2003). Maximal rotation rate is reached between the first and second layers (
 $y\approx 2.5a$
) with
 $\langle {\it\Omega}_{z}\rangle \approx -0.7\dot{{\it\gamma}}_{bulk}$
.
Particle-phase angular velocity
 $\langle {\it\Omega}_{z}(y)\rangle /\dot{{\it\gamma}}_{bulk}$
for frictionless particles
 ${\it\mu}_{d}=0$
(dotted line) and frictional particles
 ${\it\mu}_{d}=0.5$
(solid line). Simulations at
 ${\it\phi}_{bulk}=0.4$
and
 ${\it\kappa}=20$
. Dashed line is
 $-\dot{{\it\gamma}}_{bulk}/2$
.

3.4 Wall effects on viscosity
Wall-induced structuring involves some suspension thixotropy, with significant transients until a steady regime is reached. This unsteady behaviour is noticed during strains of approximately 10 or more. Figure 11 simultaneously plots the evolution of the relative viscosity
 ${\it\eta}_{r}$
and the order parameter
 $Q_{6}$
with strain for a suspension at
 ${\it\phi}_{bulk}=0.5$
and
 ${\it\kappa}=20$
. The initial configuration (at
 ${\it\gamma}=0$
) is a random hard-sphere configuration in equilibrium. At the very beginning, the viscosity suddenly increases from
 ${\it\eta}_{r}\approx 7$
(the viscosity of a random configuration) to approximately 13 before decreasing to a steady value. The evolution of
 $Q_{6}$
mirrors the viscosity, which hints at a strong link between viscosity and suspension ordering. The average steady state is reached after a strain of approximately 40. This is close to the value of approximately 30 found in a similar simulation by Yeo & Maxey (Reference Yeo and Maxey2010c
). This characteristic strain is, however, significantly larger than the typical strain of approximately 1 needed for the deformation of the suspension microstructure due to the imposed shear. The latter basically corresponds to the rapid initial transient between the starting isotropic microstructure and a deformed anisotropic microstructure.
Relative viscosity
 ${\it\eta}_{r}$
(a) and parameter
 $Q_{6}$
(b) as a function of strain
 ${\it\gamma}=\dot{{\it\gamma}}_{bulk}t$
. Simulations at
 ${\it\phi}_{bulk}=0.5$
,
 ${\it\kappa}=20$
and
 ${\it\mu}_{d}=0$
.

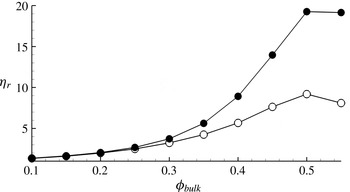
When a steady regime is eventually reached, confinement alters the suspension viscosity, depending on the bulk volume fraction
 ${\it\phi}_{bulk}$
. Results presented in figure 12 show the suspension relative viscosity
 ${\it\eta}_{r}$
for
 ${\it\kappa}=20$
and two friction coefficients
 ${\it\mu}_{d}=0$
and
 ${\it\mu}_{d}=0.5$
. As noted previously for this confinement (
 ${\it\kappa}=20$
), the wall structuring spreads across the whole suspension as soon as
 ${\it\phi}_{bulk}=0.45{-}0.5$
. In figure 12, this basically corresponds to the point where the viscosity curve
 ${\it\eta}_{r}({\it\phi}_{bulk})$
shows an inflexion point. For very concentrated suspension (
 ${\it\phi}_{bulk}=0.55$
), the suspension viscosity decreases irrespective of friction. This decrease in the viscosity is also reported in other simulations (Kulkarni & Morris Reference Kulkarni and Morris2009; Yeo & Maxey Reference Yeo and Maxey2010c
), and is a consequence of particle layering. For the highest volume fractions – where the suspension is strongly ordered – results are expected to depend strongly on confinement as well as how channel size and particle size commensurate (Yeo & Maxey Reference Yeo and Maxey2010c
; Bian et al.
Reference Bian, Litvinov, Ellero and Wagner2014). Such commensurability effects will be discussed in § 3.7.
Relative viscosity
 ${\it\eta}_{r}$
as a function of volume fraction (
 ${\it\kappa}=20$
) for friction coefficients
 ${\it\mu}_{d}=0$
(○) and
 ${\it\mu}_{d}=0.5$
(●).

The spatial evolution of stresses in the suspension is studied using a particle-phase average stress defined as
 $$\begin{eqnarray}\langle {\it\Sigma}_{ij}(y)\rangle =n\frac{\displaystyle \left\langle \iint {\it\chi}(x,y,z)S_{ij}^{(k)}\,\text{d}x\,\text{d}z\right\rangle }{\displaystyle \left\langle \iint {\it\chi}(x,y,z)\,\text{d}x\,\text{d}z\right\rangle },\end{eqnarray}$$
where
 $S_{ij}^{(k)}$
is the stresslet (hydrodynamic, contact, or the sum thereof) of particle
 $k$
and
 $n$
the number density of particles in the whole domain. Note that this is not a real local stress, but rather a local stresslet having the dimension of a stress due to the particle density
 $n$
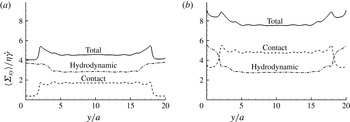
pre-factor. Figure 13 presents the local particle tangential stress
 $\langle {\it\Sigma}_{xy}^{p}(y)\rangle$
(referred to as total stress in the figure legend) as well as the hydrodynamic tangential stress
 $\langle {\it\Sigma}_{xy}^{h}(y)\rangle$
and contact tangential stress
 $\langle {\it\Sigma}_{xy}^{c}(y)\rangle$
. Stresses are scaled by the fluid stress
 ${\it\eta}\dot{{\it\gamma}}$
, and are computed here for a suspension at
 ${\it\phi}_{bulk}=0.4$
and
 ${\it\kappa}=20$
for frictionless (a) and frictional particles (b). We recall that the total particle stress
 ${\it\Sigma}_{xy}^{p}$
is split up into a hydrodynamic stress
 ${\it\Sigma}_{xy}^{h}$
and a contact stress
 ${\it\Sigma}_{xy}^{c}$
by virtue of (3.1). Let us first consider the frictionless case (figure 13
a). As expected, stresses are relatively constant in the homogeneous core. The maximum in the particle stress
 ${\it\Sigma}_{xy}^{p}$
(therefore,
 ${\it\eta}_{r}$
) is reached between the first and second layer, at
 $y\approx 2.5a$
. This results from a large contribution from both hydrodynamics and contact. In the first layer (
 $0\leqslant y\leqslant 2a$
), the hydrodynamic contribution remains important due to wall–particle lubrication interactions. The contact contribution here is negligible, since contact forces are mostly in the normal direction
 $y$
in the frictionless case, which results in a very small
 ${\it\Sigma}_{xy}^{c}$
. However, for
 $2a\leqslant y\leqslant 3a$
, this corresponds to some particles located somewhere between the first two layers. Such particles are expected to experience stronger contacts, which explains the increase in the contact stress. Friction (figure 13
b) does not profoundly modify those conclusions. Stress levels in the suspension core are larger, mostly because of contacts, as already detailed in Gallier et al. (Reference Gallier, Lemaire, Peters and Lobry2014b
). The stress peak between the first and second layers is less visible than in the frictionless case due to a higher level of hydrodynamic and contact stress at the wall. Because of frictional contact, the tangential contact force does involve an additional contact contribution on the
 $xy$
stress. It is important to recall that the chosen average (3.12) accounts for an average stress density, since the local stresslet is scaled by the local volume fraction (denominator in (3.12)). Because of the wall depleted zone, the local volume fraction is small in the near-wall region, so that the contribution of this wall region to the overall suspension stress is weak.
Particle-phase particle stress
 $\langle {\it\Sigma}_{xy}^{p}(y)\rangle /{\it\eta}\dot{{\it\gamma}}$
(solid lines), hydrodynamic stress
 $\langle {\it\Sigma}_{xy}^{h}(y)\rangle /{\it\eta}\dot{{\it\gamma}}$
(dash-dotted lines) and contact stress
 $\langle {\it\Sigma}_{xy}^{c}(y)\rangle /{\it\eta}\dot{{\it\gamma}}$
(dotted lines) in a suspension at
 ${\it\phi}_{bulk}=0.4$
and
 ${\it\kappa}=20$
for two friction coefficients:
 ${\it\mu}_{d}=0$
(a);
 ${\it\mu}_{d}=0.5$
(b).

By and large, the profiles of
 $\langle {\it\Sigma}_{xy}^{p}(y)\rangle$
are moderately affected by walls. Therefore, the viscosity
 ${\it\eta}_{r}^{{\it\kappa}}$
of a wall-bounded suspension (at confinement
 ${\it\kappa}$
) may not be that different from the viscosity
 ${\it\eta}_{r}^{\infty }$
expected for an unbounded homogeneous suspension. This unbounded viscosity
 ${\it\eta}_{r}^{\infty }$
is here computed in the homogeneous core of a suspension in a large domain. Note that
 ${\it\eta}_{r}^{{\it\kappa}}$
is calculated based on the prescribed macroscopic shear rate
 $\dot{{\it\gamma}}_{bulk}$
, whereas
 ${\it\eta}_{r}^{\infty }$
is computed using the local shear rate
 $\dot{{\it\gamma}}_{core}$
in the core of the suspension. This viscosity ratio is plotted in figure 14 for
 ${\it\kappa}=20$
as a function of volume fraction for frictionless (
 ${\it\mu}_{d}=0$
) and frictional (
 ${\it\mu}_{d}=0.5$
) particles. This ratio is always close to 1, regardless of the friction coefficient, except for
 ${\it\phi}_{bulk}=0.5$
, where a strong layering results in a viscosity decrease. Note that this viscosity ratio is slightly below 1 for dilute suspensions. Actually, the tangential stress ratio is indeed approximately 1, so that
 ${\it\eta}_{r}^{{\it\kappa}}/{\it\eta}_{r}^{\infty }\approx \dot{{\it\gamma}}_{core}/\dot{{\it\gamma}}_{bulk}$
. Because of wall slip, this shear rate ratio
 $\dot{{\it\gamma}}_{core}/\dot{{\it\gamma}}_{bulk}$
is lower than 1 and is approximately 0.98 for low volume fractions, which explains the values of viscosity ratio in figure 14.
Ratio of bounded to unbounded viscosity
 ${\it\eta}_{r}^{{\it\kappa}}/{\it\eta}_{r}^{\infty }$
as a function of volume fraction for
 ${\it\mu}_{d}=0$
(○) and
 ${\it\mu}_{d}=0.5$
(●) for
 ${\it\kappa}=20$
.

3.5 Wall effects on normal stress differences
A similar analysis is conducted for the normal stress differences
 $N_{1}$
and
 $N_{2}$
due to their importance in rheology. The local profiles of the particle-phase average
 $\langle N_{1}(y)\rangle$
and its contact contribution
 $\langle N_{1}^{c}(y)\rangle$
(scaled by the fluid stress
 ${\it\eta}\dot{{\it\gamma}}$
) are presented in figure 15 for a frictionless (a) and frictional case (b) for a suspension at
 ${\it\phi}_{bulk}=0.4$
confined at
 ${\it\kappa}=20$
. Unlike viscosity, a strong effect of walls is observed which can locally modify the sign of
 $\langle N_{1}\rangle$
. In the homogeneous core,
 $\langle N_{1}\rangle /{\it\eta}\dot{{\it\gamma}}$
is approximately
 $-1$
, but close to the walls it can increase to
 $+1$
, or even
 $+4$
in case of friction. Irrespective of friction, the contact contribution remains very small in the core (
 $\langle N_{1}^{c}\rangle \ll \langle N_{1}\rangle$
), but this is no longer the case in the vicinity of the walls, where it represents the major contribution, i.e.
 $\langle N_{1}\rangle \approx \langle N_{1}^{c}\rangle$
. Furthermore, near the walls,
 $\langle N_{1}^{c}\rangle$
changes its sign from negative to positive, while the hydrodynamic part
 $\langle N_{1}^{h}\rangle$
becomes close to zero.
Particle-phase average
 $\langle N_{1}(y)\rangle /{\it\eta}\dot{{\it\gamma}}$
(solid lines) and
 $\langle N_{1}^{c}(y)\rangle /{\it\eta}\dot{{\it\gamma}}$
(dotted lines) in a suspension at
 ${\it\phi}_{bulk}=0.4$
and
 ${\it\kappa}=20$
for two friction coefficients:
 ${\it\mu}_{d}=0$
(a);
 ${\it\mu}_{d}=0.5$
(b).

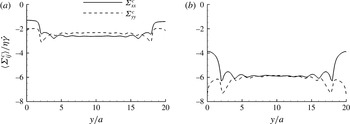
In order to gain further insight on this strong wall effect, figure 16 plots the contact stresses
 $\langle {\it\Sigma}_{xx}^{c}(y)\rangle$
and
 $\langle {\it\Sigma}_{yy}^{c}(y)\rangle$
for this case. Those results show that
 $\langle {\it\Sigma}_{xx}^{c}\rangle \approx \langle {\it\Sigma}_{yy}^{c}\rangle$
in the suspension core, from which
 $\langle N_{1}^{c}\rangle \approx$
0 is expected. This has been shown to arise from a uniform distribution of contacts in the compression region (Gallier et al.
Reference Gallier, Lemaire, Peters and Lobry2014b
). Conversely, simulations predict a substantial decrease of
 $|\langle {\it\Sigma}_{xx}^{c}\rangle |$
close to the walls, whereas
 $|\langle {\it\Sigma}_{yy}^{c}\rangle |$
remains similar (frictionless case) or even increases slightly (frictional case). Contact forces in the
 $y$
direction are only weakly affected, and walls mostly act to reduce contact forces in the velocity direction
 $x$
. This is related to a layered configuration: particles in the first layer have similar velocities, so that particles hardly interact in this direction. A decrease in
 $|\langle {\it\Sigma}_{xx}^{c}\rangle |$
is therefore expected. This induces high positive values of
 $\langle N_{1}^{c}\rangle$
which, in turn, involve the positive
 $\langle N_{1}\rangle$
observed in figure 15.
Particle-phase average contact stresses
 $\langle {\it\Sigma}_{xx}^{c}(y)\rangle /{\it\eta}\dot{{\it\gamma}}$
(solid lines) and
 $\langle {\it\Sigma}_{yy}^{c}(y)\rangle /{\it\eta}\dot{{\it\gamma}}$
(dotted lines) in a suspension at
 ${\it\phi}_{bulk}=0.4$
and
 ${\it\kappa}=20$
for two friction coefficients:
 ${\it\mu}_{d}=0$
(a);
 ${\it\mu}_{d}=0.5$
(b).

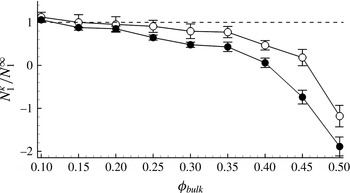
From the marked effect of walls on
 $N_{1}$
, we can expect the
 $N_{1}^{{\it\kappa}}$
obtained in a bounded suspension to be significantly different from its unbounded homogeneous counterpart
 $N_{1}^{\infty }$
. The ratio
 $N_{1}^{{\it\kappa}}/N_{1}^{\infty }$
is presented in figure 17 for a suspension at
 ${\it\kappa}=20$
. This ratio is always smaller than 1, meaning that
 $N_{1}$
in a bounded suspension is always lower than in an infinite suspension. This ratio decreases with friction as well as with volume fraction, mostly for
 ${\it\phi}>0.2$
. An important result is that this ratio is negative for dense suspensions, meaning that the overall suspension
 $N_{1}$
becomes positive due to confinement. It is therefore possible that the combined action of walls and friction is liable to explain some experimental results showing almost zero or positive values of
 $N_{1}$
(Couturier et al.
Reference Couturier, Boyer, Pouliquen and Guazzelli2011; Dbouk et al.
Reference Dbouk, Lobry and Lemaire2013; Gamonpilas et al.
Reference Gamonpilas, Morris and Denn2016). This point will be reconsidered hereinafter.
Ratio of bounded to unbounded
 $N_{1}^{{\it\kappa}}/N_{1}^{\infty }$
as a function of volume fraction for
 ${\it\mu}_{d}=0$
(○) and
 ${\it\mu}_{d}=0.5$
(●) for
 ${\it\kappa}=20$
.

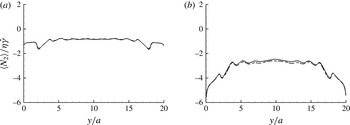
We now move to the second normal stress difference
 $N_{2}$
. The local
 $N_{2}$
profile in the suspension is presented similarly in figure 18, with both total and contact contributions. The contact
 $N_{2}^{c}$
(dotted lines in figure 18) can be hardly distinguished from the total
 $N_{2}$
, meaning that
 $N_{2}$
is entirely due to contacts (
 $N_{2}\approx N_{2}^{c}$
) and that the hydrodynamic contribution is negligible (
 $N_{2}^{h}\approx 0$
). Note that this stands for the whole suspension (Gallier et al.
Reference Gallier, Lemaire, Peters and Lobry2014b
) as well as locally everywhere in the flow. For frictionless particles (figure 18
a),
 $N_{2}$
is almost constant across the suspension, whereas in the frictional case (figure 18
b), a significant increase in
 $|N_{2}|$
is noticed close to the walls. This is due to the particle structuring in the vorticity direction (see figure 3), which decreases contact forces in this direction and
 $|{\it\Sigma}_{zz}^{c}|$
accordingly.
Particle-phase average
 $\langle N_{2}(y)\rangle /{\it\eta}\dot{{\it\gamma}}$
(solid lines) and
 $\langle N_{2}^{c}(y)\rangle /{\it\eta}\dot{{\it\gamma}}$
(dotted lines) in a suspension at
 ${\it\phi}_{bulk}=0.4$
and
 ${\it\kappa}=20$
for two friction coefficients:
 ${\it\mu}_{d}=0$
(a);
 ${\it\mu}_{d}=0.5$
(b).

Those results show that
 $N_{2}$
is moderately affected by walls, unlike
 $N_{1}$
. This is especially true in the frictionless case. For frictional particles, the variation of
 $N_{2}/{\it\eta}\dot{{\it\gamma}}$
in the wall region is significant (
 ${\approx}-3$
), and is almost of the same order of magnitude as for
 $N_{1}$
(
 ${\approx}+5$
). But because
 $N_{1}$
is small, its relative variation is much higher than for
 $N_{2}$
. Furthermore, there is no change in the sign of
 $N_{2}$
, as opposed to
 $N_{1}$
. Consequently, the overall
 $N_{2}^{{\it\kappa}}$
computed in a confined suspension might not significantly differ from its unbounded counterpart
 $N_{2}^{\infty }$
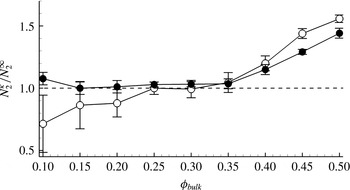
. This is confirmed in figure 19 for a suspension confined at
 ${\it\kappa}=20$
. The ratio
 $N_{2}^{{\it\kappa}}/N_{2}^{\infty }$
is approximately 1 for dilute and moderately dense suspensions. For frictionless particles and dilute suspensions (say,
 ${\it\phi}_{bulk}\leqslant 0.2$
), however, it can be lower than 1, but this possibly comes from large statistical errors – as shown by the error bars – primarily because values of
 $N_{2}$
are extremely small in that case. This statistical error is computed here as the standard deviation over statistically independent intervals of 20–30 strain units each. For volume fractions above 0.4, the
 $N_{2}$
for a confined suspension can be greater by up to 50 % compared to an homogeneous suspension, and with a weak effect of friction.
Ratio of bounded to unbounded
 $N_{2}^{{\it\kappa}}/N_{2}^{\infty }$
as a function of volume fraction for
 ${\it\mu}_{d}=0$
(○) and
 ${\it\mu}_{d}=0.5$
(●) for
 ${\it\kappa}=20$
.

3.6 Normal stress differences: comparison with experiments
One of the motivations of this work was to investigate to what extent the confinement of a suspension can explain discrepancies between experiments, especially on
 $N_{1}$
. A first study – described in a previous work (Gallier et al.
Reference Gallier, Lemaire, Peters and Lobry2014b
) – has shown that friction leads to a decrease in
 $|N_{1}|$
and can help match available experiments and simulations. However, it was concluded that friction itself can not result in positive
 $N_{1}$
, as measured in some experiments (Dbouk et al.
Reference Dbouk, Lobry and Lemaire2013). The present results, moreover, suggest a significant role of walls – even in moderately confined suspensions (
 ${\it\kappa}=20$
) – leading to positive values of
 $N_{1}$
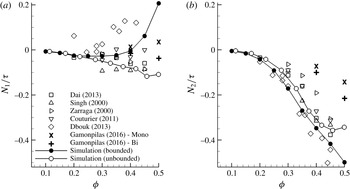
. Figure 20 compiles experimental results on normal stress differences (normalized by shear stress
 ${\it\tau}={\it\eta}_{r}{\it\eta}\dot{{\it\gamma}}$
) compared to our frictional (
 ${\it\mu}_{d}=0.5$
) simulations in a bounded (
 ${\it\kappa}=20$
) and unbounded suspension. The experiments are taken from six sources from the literature (Singh & Nott Reference Singh and Nott2000; Zarraga et al.
Reference Zarraga, Hill and Leighton2000; Couturier et al.
Reference Couturier, Boyer, Pouliquen and Guazzelli2011; Dai et al.
Reference Dai, Bertevas, Qi and Tanner2013; Dbouk et al.
Reference Dbouk, Lobry and Lemaire2013; Gamonpilas et al.
Reference Gamonpilas, Morris and Denn2016) using different techniques. These seem to be the major experiments simultaneously measuring
 $N_{1}$
and
 $N_{2}$
(other experiments are available, but for
 $N_{2}$
only, e.g. Garland et al. (Reference Garland, Gauthier, Martin and Morris2013)). Let us begin with
 $N_{2}$
(figure 20
b), since it deserves less attention. As expected, the effect of confinement is limited, and does not significantly change from unbounded suspension. In any case, simulation results are close to experiments, which moreover are relatively consistent among themselves. Concerning
 $N_{1}$
(figure 20
a), simulations show a change of sign for dense suspensions, typically for
 ${\it\phi}\gtrapprox 0.4$
, and
 $N_{1}$
becomes largely positive above. Confinement can be considered as a potential source for experimental discrepancy, since experiments are conducted in different geometries and confinements. However, it is still difficult to predict the experimental data from Dbouk et al. (Reference Dbouk, Lobry and Lemaire2013) that are visible in figure 20(a) as the most positive values (♢ symbols). Even at
 ${\it\phi}\approx 0.3{-}0.4$
, the measured
 $N_{1}/{\it\tau}$
is larger than 0.1, whereas simulations predict
 $N_{1}/{\it\tau}\approx 0$
for this range of volume fractions. Note that these latter experiments are performed at
 ${\it\kappa}\approx 27$
, which is not far from our simulations at
 ${\it\kappa}=20$
. A puzzling point is that their study proposed additional experiments in much less confined suspensions (
 ${\it\kappa}\approx 100$
) but found similar
 $N_{1}$
results. This suggests that measurements are weakly dependent on confinement, unlike our simulations, since for
 ${\it\kappa}\approx 100$
, we expect results close to our
 ${\it\kappa}=\infty$
results (see ○ symbols in figure 20). A possible explanation is that these experiments – which rely on a measurement of
 ${\it\Sigma}_{yy}$
on the rheometer walls – describe a flow configuration which is different from the overall suspension (in the sense of a volume average over the whole domain) but is rather characteristic of the near-wall ordered state. Since this local structuring is independent of confinement (see figure 6), this could explain why experiments from Dbouk et al. (Reference Dbouk, Lobry and Lemaire2013) are unaffected by confinement. The question of which stress is measured in experiments still seems open and deserves attention in future works. As a final remark, it is interesting to note that results by Gamonpilas et al. (Reference Gamonpilas, Morris and Denn2016) show a difference in the sign of
 $N_{1}$
depending whether the suspension is monodisperse (positive
 $N_{1}$
) or bidisperse (negative
 $N_{1}$
). Monodispersity is well known to promote ordering – as seen in present simulations – which is consistent with our conclusion that
 $N_{1}$
is positive because of wall-induced layering.
Normal stress differences
 $N_{1}$
(a) and
 $N_{2}$
(b) normalized by shear stress
 ${\it\tau}$
as a function of volume fraction for a frictional suspension
 ${\it\mu}_{d}=0.5$
: bounded suspension
 ${\it\kappa}=20$
(●) and unbounded suspension (○). Experiments (symbols) compile results from Singh & Nott (Reference Singh and Nott2000), Zarraga et al. (Reference Zarraga, Hill and Leighton2000), Dbouk et al. (Reference Dbouk, Lobry and Lemaire2013), Dai et al. (Reference Dai, Bertevas, Qi and Tanner2013), Couturier et al. (Reference Couturier, Boyer, Pouliquen and Guazzelli2011), Gamonpilas et al. (Reference Gamonpilas, Morris and Denn2016). Data from Gamonpilas et al. (Reference Gamonpilas, Morris and Denn2016) are for monomodal particles (Mono) and bimodal mixture (Bi).

3.7 Effect of confinement on rheology
Most of the above analysis is conducted with a moderate confinement (
 ${\it\kappa}=20$
) and here we intend to evaluate the effect of confinement
 ${\it\kappa}$
on rheology, namely viscosity and normal stress differences. The forthcoming computations are run only in the frictionless case (
 ${\it\mu}_{d}=0$
) and for a single volume fraction
 ${\it\phi}_{bulk}=0.4$
. As noted previously, the friction enhances wall effects, but does not seem to modify the underlying physics, which explains why only frictionless particles are addressed here.
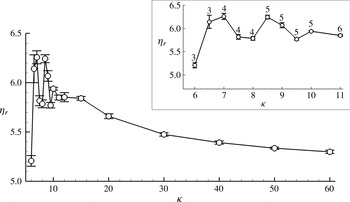
Effect of confinement
 ${\it\kappa}$
on viscosity
 ${\it\eta}_{r}$
at
 ${\it\phi}_{bulk}=0.4$
and
 ${\it\mu}_{d}=0$
in the range
 $6\leqslant {\it\kappa}\leqslant 60$
. (Inset: range
 $6\leqslant {\it\kappa}\leqslant 11$
; the numbers labelling the circles indicate the number of layers).

Figure 21 presents the effect of the confinement
 ${\it\kappa}$
on the computed viscosity
 ${\it\eta}_{r}$
in the range
 $6\leqslant {\it\kappa}\leqslant 60$
. Two different regimes are noted, with a transition at
 ${\it\kappa}_{c}$
approximately 12–15: an oscillating regime for
 ${\it\kappa}\lesssim {\it\kappa}_{c}$
and a monotonic regime for
 ${\it\kappa}\gtrsim {\it\kappa}_{c}$
. The value of
 ${\it\kappa}_{c}$
is expected to correspond to a wall-induced ordering that spans across the whole channel. For
 ${\it\phi}_{bulk}=0.4$
, the size of the wall-structured region
 $e_{wall}$
was found to be approximately 6
 $a$
(see figure 5). This would give
 ${\it\kappa}_{c}\approx 12$
, which is consistent with the present results.
In the very confined regime (
 ${\it\kappa}\lesssim {\it\kappa}_{c}$
), the viscosity exhibits an oscillatory behaviour (see also the inset in figure 21). This is related to commensurability effects, as already noted by Yeo & Maxey (Reference Yeo and Maxey2010c
). Their simulations show that the order parameter
 $C_{6}$
and particle pressure
 ${\it\Pi}$
are very sensitive to the commensurability of the ordered structures with the channel height. Unsurprisingly, our results reveal a similar behaviour in viscosity, which fluctuates depending on how the structure is frustrated by the narrow channel. The bold numbers in the inset indicate the number of particle layers across the channel height. The maximum in the viscosity seems to correspond to a situation when the number of layers has just increased by one. In that case, the distance between layers is smaller, making particles less mobile and the suspension more ordered.
For the monotonic regime (
 ${\it\kappa}\gtrsim {\it\kappa}_{c}$
), the viscosity decreases slightly monotonically towards an asymptotic value, which is obtained for
 ${\it\kappa}\gtrsim 50{-}60$
. This is consistent with experiments by Zarraga et al. (Reference Zarraga, Hill and Leighton2000), who have found that the asymptotic value is reached for
 ${\it\kappa}\gtrsim 40$
. The viscosity computed at
 ${\it\kappa}=30$
is only off by 3 % compared to
 ${\it\kappa}=60$
, suggesting that a confinement ratio
 ${\it\kappa}$
larger than 30 is suitable for reliable viscosity measurements. The fact that viscosity decreases when
 ${\it\kappa}$
increases is also found in simulations (Davit & Peyla Reference Davit and Peyla2008; Bian et al.
Reference Bian, Litvinov, Ellero and Wagner2014), as well as in the experiments from Peyla & Verdier (Reference Peyla and Verdier2011) and the theoretical expressions by Sangani et al. (Reference Sangani, Acrivos and Peyla2011). In contrast, simulations by Yeo & Maxey (Reference Yeo and Maxey2010b
) and experiments by Zarraga et al. (Reference Zarraga, Hill and Leighton2000) show an increase in viscosity with increasing channel height. There seems to be a predominant role of volume fraction, since the studies showing a viscosity decrease are for more dilute suspensions (range 0.05–0.4), whereas the viscosity increase is noticed in denser regimes (range 0.4–0.45). A definite conclusion would require simulations for a wide range of volume fractions, which were not done here. But it seems that the effects are quite complex, and possibly result from a subtle interplay between wall-enhanced hydrodynamic interactions, wall-induced structuring, and apparent wall slip.
Figure 22 similarly presents the effect of the confinement
 ${\it\kappa}$
on the normal stress differences
 $N_{1}$
and
 $N_{2}$
scaled by the fluid stress
 ${\it\eta}\dot{{\it\gamma}}$
. Analogously to viscosity, two regimes are clearly noticed. For
 ${\it\kappa}\gtrsim {\it\kappa}_{c}$
,
 $N_{1}/{\it\eta}\dot{{\it\gamma}}$
and
 $N_{2}/{\it\eta}\dot{{\it\gamma}}$
show a monotonic evolution towards an asymptotic value. The confined regime
 ${\it\kappa}\lesssim {\it\kappa}_{c}$
displays a non-monotonic behaviour in connection with commensurability effects. The fluctuations are large, and
 $N_{1}$
can be strongly positive while
 $N_{2}$
always remains negative. It is interesting to note that
 $N_{1}$
and
 $N_{2}$
have mirrored behaviours: an increase in
 $N_{1}$
is always related to a decrease in
 $N_{2}$
. This is expected from our previous conclusions about the effect of layering on normal stresses: particle layers result in an increase in
 ${\it\Sigma}_{xx}^{p}$
and
 ${\it\Sigma}_{zz}^{p}$
, and a relatively unchanged
 ${\it\Sigma}_{yy}^{p}$
. As a consequence,
 $N_{1}={\it\Sigma}_{xx}^{p}-{\it\Sigma}_{yy}^{p}$
is expected to increase, while
 $N_{2}={\it\Sigma}_{yy}^{p}-{\it\Sigma}_{zz}^{p}$
decreases concurrently.
Effect of confinement
 ${\it\kappa}$
on normal stress differences
 $N_{1}/{\it\eta}\dot{{\it\gamma}}$
(○) and
 $N_{2}/{\it\eta}\dot{{\it\gamma}}$
(●) at
 ${\it\phi}_{bulk}=0.4$
and
 ${\it\mu}_{d}=0$
in the range
 $6\leqslant {\it\kappa}\leqslant 60$
. (Inset: range
 $6\leqslant {\it\kappa}\leqslant 11$
; the numbers labelling the circles indicate the number of layers).

4 Conclusions
In this paper, we have presented three-dimensional numerical simulations of concentrated suspensions in a wall-bounded shear flow. Simulations rely on a fictitious domain method including long-range hydrodynamics, particle–particle and wall–particle lubrication forces, and contact frictional forces. Notably, wall-lubrication corrections are proposed on rheological quantities, which do not seem to be reported in previous similar computations.
Walls lead to a local hexagonal structuring of particles. The size of this layered zone depends on volume fraction, and is only weakly affected by friction. For a confinement
 ${\it\kappa}=20$
(ratio between channel width and particle radius), this region represents half of the suspension volume at
 ${\it\phi}_{bulk}=0.4$
, but the whole domain as soon as
 ${\it\phi}_{bulk}\gtrsim 0.5$
. For
 ${\it\phi}_{bulk}\gtrsim 0.52$
, the system completely crystallizes even in very large domains (
 $L_{y}=80a$
). This result is expected for monodisperse particles (the effect of polydispersity was not investigated). The wall structuring is relatively slow to develop with characteristic strains of
 $O(10)$
. It involves wall slip, leading to a reduced shear rate in the suspension core which seems consistent with the empirical model of Jana et al. (Reference Jana, Kapoor and Acrivos1995). For perfectly smooth walls, the wall slip is mostly due to particle roughness that limits the wall–particle gap and lubrication intensity accordingly.
Wall-induced ordering is shown to have a limited impact on viscosity and second normal stress difference
 $N_{2}$
, at least for moderately confined suspensions (
 ${\it\kappa}=20$
). Conversely, it significantly affects the first normal stress difference
 $N_{1}$
. Friction enhances this effect, which is shown to be due to a large decrease in the contact normal stress
 $|{\it\Sigma}_{xx}^{c}|$
because of particle layering in the wall region. Our simulations suggest that confinement and friction can promote positive values of
 $N_{1}$
. The obtained results seem in better agreement with recent
 $N_{1}$
measurements (Couturier et al.
Reference Couturier, Boyer, Pouliquen and Guazzelli2011; Dbouk et al.
Reference Dbouk, Lobry and Lemaire2013) and eventually highlight the importance of friction and confinement for quantitative predictions of actual suspensions.
Some future work will be required to address size polydispersity, since most experimental suspensions have finite polydispersity. This is needed to extend the relevance of our results beyond single-sized spheres, especially regarding experiments. Polydispersity is likely to reduce ordering, and may alter the balance between confinement effects per se and confinement effects through wall-induced layering. This could also help in understanding the results obtained by Gamonpilas et al. (Reference Gamonpilas, Morris and Denn2016), who found different normal stress differences between monodisperse and bidisperse systems.
Acknowledgements
This work has been funded by the French Defence Procurement Agency (DGA).
Appendix A. Wall resistance functions
Asymptotic expressions for particle–wall resistance functions
 $X^{A}$
,
 $Y^{A}$
,
 $Y^{B}$
,
 $X^{C}$
,
 $Y^{C}$
,
 $Y^{G}$
and
 $Y^{H}$
can be found in various sources of the literature and have been recently compiled by Yeo & Maxey (Reference Yeo and Maxey2010b
). Note that in their paper, there seems to be a typographical error for the
 $O(1)$
term in
 $Y^{H}$
, which is
 $0.0916$
instead of 0.923 (see Bossis, Meunier & Sherwood Reference Bossis, Meunier and Sherwood1991).
 $$\begin{eqnarray}\displaystyle & \displaystyle \frac{X^{A}}{6{\rm\pi}a~}={\it\xi}^{-1}+\frac{1}{5}\ln {\it\xi}^{-1}+\frac{1}{21}{\it\xi}\ln {\it\xi}^{-1}+0.8193, & \displaystyle\end{eqnarray}$$
 $$\begin{eqnarray}\displaystyle & \displaystyle \frac{Y^{A}}{6{\rm\pi}a~}=\frac{8}{15}\ln {\it\xi}^{-1}+\frac{64}{375}{\it\xi}\ln {\it\xi}^{-1}+0.9557, & \displaystyle\end{eqnarray}$$
 $$\begin{eqnarray}\displaystyle & \displaystyle \frac{Y^{B}}{4{\rm\pi}a^{2}}=-\frac{3}{15}\ln {\it\xi}^{-1}-\frac{43}{125}{\it\xi}\ln {\it\xi}^{-1}+0.3852, & \displaystyle\end{eqnarray}$$
 $$\begin{eqnarray}\displaystyle & \displaystyle \frac{X^{C}}{8{\rm\pi}a^{3}}=-\frac{1}{2}{\it\xi}\ln {\it\xi}^{-1}+1.2021, & \displaystyle\end{eqnarray}$$
 $$\begin{eqnarray}\displaystyle & \displaystyle \frac{Y^{C}}{8{\rm\pi}a^{3}}=\frac{2}{5}\ln {\it\xi}^{-1}+\frac{66}{125}{\it\xi}\ln {\it\xi}^{-1}+0.3720, & \displaystyle\end{eqnarray}$$
 $$\begin{eqnarray}\displaystyle & \displaystyle \frac{Y^{G}}{4{\rm\pi}a^{2}}=\frac{7}{10}\ln {\it\xi}^{-1}+\frac{221}{250}{\it\xi}\ln {\it\xi}^{-1}-0.9230, & \displaystyle\end{eqnarray}$$
 $$\begin{eqnarray}\displaystyle & \displaystyle \frac{Y^{H}}{8{\rm\pi}a^{3}}=-\frac{1}{10}\ln {\it\xi}^{-1}+\frac{2}{250}{\it\xi}\ln {\it\xi}^{-1}+0.0916, & \displaystyle\end{eqnarray}$$
where
 ${\it\xi}$
is the gap between particle surface and wall normalized by particle radius
 $a$
. In order to obtain the missing functions
 $X^{G}$
,
 $X^{P}$
and
 $Y^{M}$
, we start from their general expressions for two particles having different size (Kim & Karrila Reference Kim and Karrila1991; Jeffrey Reference Jeffrey1992) and we denote
 ${\it\beta}$
as the size ratio. A variable change is first needed, because in the theoretical two-sphere expressions, distance
 ${\it\xi}$
is non-dimensional using the average radius
 $a(1+{\it\beta})/2$
, while we want to keep
 $a$
for a wall–particle interaction. Then, the limit
 ${\it\beta}\rightarrow \infty$
is taken in the obtained expression. The
 $O(1)$
non-singular term is taken from Jeffrey (Reference Jeffrey1992) for
 ${\it\beta}=100$
, which is the highest value available. The final asymptotic expressions are
 $$\begin{eqnarray}\displaystyle & \displaystyle \frac{X^{G}}{4{\rm\pi}a^{2}}=\frac{3}{2}{\it\xi}^{-1}-\frac{6}{5}\ln {\it\xi}^{-1}+0.268, & \displaystyle\end{eqnarray}$$
 $$\begin{eqnarray}\displaystyle & \displaystyle \frac{X^{P}}{4{\rm\pi}a^{2}}=\frac{3}{2}{\it\xi}^{-1}-\frac{6}{5}\ln {\it\xi}^{-1}-0.552, & \displaystyle\end{eqnarray}$$
 $$\begin{eqnarray}\displaystyle & \displaystyle \frac{Y^{M}}{\frac{20}{3}{\rm\pi}a^{3}}=\frac{24}{25}\ln {\it\xi}^{-1}+\frac{1182}{625}{\it\xi}\ln {\it\xi}^{-1}-0.685. & \displaystyle\end{eqnarray}$$
Note that there seem to be no data available in the intermediate distance regime, so those asymptotic expressions are always used.