


1 Introduction
Mathematical models of flows of liquid in the Cassie state through microchannels patterned with longitudinal grooves containing a vacuum or vapour and/or inert gas, have been studied in detail. We briefly summarize some of them below and refer the reader to the recent review article by Lee, Choi & Kim (Reference Lee, Choi and Kim2016) for further details – experimental results are also discussed there. We note that as regularly pointed out in the literature (see, for example, Lee et al. (Reference Lee, Choi and Kim2016), Peaudecerf et al. (Reference Peaudecerf, Landel, Goldstein and Luzzatto-Fegiz2017), Song et al. (Reference Song, Song, Hu, Du, Du, Choi and Rothstein2018)), experimental measurements of drag reduction tend to be far below those predicted theoretically. Depending on the flow conditions, various (and often coupled) factors, such as gas-phase viscosity (see, e.g. Asmolov, Nizkaya & Vinogradova (Reference Asmolov, Nizkaya and Vinogradova2018)), edge effects (see, e.g. Game et al. (Reference Game, Hodes, Keaveny and Papageorgiou2017)), meniscus curvature (see, e.g. Sbragaglia & Prosperetti (Reference Sbragaglia and Prosperetti2007)) and thermocapillary stress (see, e.g. Hodes et al. (Reference Hodes, Kirk, Karamanis and MacLachlan2017)), may play a role in resolving the discrepancies. A phenomenon that is lately receiving increased attention due to the studies of Peaudecerf et al. (Reference Peaudecerf, Landel, Goldstein and Luzzatto-Fegiz2017) and Song et al. (Reference Song, Song, Hu, Du, Du, Choi and Rothstein2018), is the substantial or full immobilization of menisci due to Marangoni stresses along them arising from even trace amounts of surfactants in water. In this study we identify and quantify yet another mechanism, namely inertial effects due to slowly varying meniscus curvature, that must be considered to fully resolve the discrepancies between theory and experiment. As in the case of meniscus curvature, it can result in non-negligible reduction or enhancement of the flow rate for a fixed pressure difference across a superhydrophobic (SH) microchannel at realistic operating conditions. We note that until pressure-driven flow experiments are performed with water under sufficiently pristine conditions to eliminate surfactant effects, or with a liquid (perhaps a liquid metal) in the Cassie state not subject to Marangoni stresses on account of trace amounts of surfactants, we are unable to verify our own predictions against experimental data.
In a seminal study, Philip (Reference Philip1972a ,Reference Philip b ) analytically resolved the fully developed flow field and corresponding flow rate for various internal flow configurations with flat, shear-free menisci by using conformal maps to accommodate mixed boundary conditions. Lauga & Stone (Reference Lauga and Stone2003) used Philip’s analysis to find expressions for the (apparent) slip length in tubes with longitudinal grooves, and also obtained solutions for the case of transverse grooves using separation of variables. Teo & Khoo (Reference Teo and Khoo2009) formulated and solved dual-series equations to resolve the velocity field in cases not considered by Philip, involving grooves on the upper and lower boundaries of a parallel-plate channel. Sbragaglia & Prosperetti (Reference Sbragaglia and Prosperetti2007) and Teo & Khoo (Reference Teo and Khoo2010) captured the effects of meniscus curvature asymptotically and numerically, respectively, and more recently Marshall (Reference Marshall2017) found an exact solution for the slip length for small meniscus curvatures. Maynes et al. (Reference Maynes, Jeffs, Woolford and Webb2007) and Ng, Chu & Wang (Reference Ng, Chu and Wang2010) considered the effect of gas viscosity on the flow rate, while Game et al. (Reference Game, Hodes, Keaveny and Papageorgiou2017) considered this effect in combination with meniscus curvature and end-wall effects.
The foregoing studies and all others pertaining to longitudinal grooves, consider two-dimensional unidirectional flows in which only a cross-section of the microchannel is considered since the flow is independent of the streamwise variable. For those studies that assume a flat meniscus, this can be viewed as the limiting case where surface tension is infinite and thus the meniscus is flat throughout a microchannel. This limit tends to be invalid in practice, however, where the objective is often to maximize the flow rate of the liquid. As discussed in further detail by Game et al. (Reference Game, Hodes, Kirk and Papageorgiou2018), this objective may be met by additional texturing of the longitudinal ridges to cause them to be re-entrant surfaces as originally proposed by Ahuja et al. (Reference Ahuja, Taylor, Lifton, Sidorenko, Salamon, Lobaton, Kolodner and Krupenkin2008) and Tuteja et al. (Reference Tuteja, Choi, Mabry, McKinley and Cohen2008) in the context of droplets on SHs. Then, the (metastable) contact angle between a downward-protruding meniscus and the ridges may approach 90 degrees at the entrance of a microchannel and, at its outlet it may be flat or even upward protruding. This maximizes the pressure difference across a microchannel while preserving the Cassie state and thus the flow rate of the liquid. This is also relevant to the application of superhydrophobic microchannels to enhance microchannel cooling of microelectronics using a liquid metal such as Galinstan as discussed by Lam, Hodes & Enright (Reference Lam, Hodes and Enright2015). Here lubrication is essential as the thermal resistance of the microchannel is dominated by the sensible temperature rise of the liquid metal. Meniscus curvature in this context is especially important, even when the ridges are not textured with re-entrant structures, since the advancing contact angles of Galinstan on Teflon and silicon nitride, for example, are 161.2 and 147.0 degrees, respectively (equivalently, downward protrusion angles of 71.2 and 57.0 degrees respectively), as reported by the measurements of Liu, Sen & Kim (Reference Liu, Sen and Kim2012a ). Notably, since Galinstan has a negligible vapour pressure at near-atmospheric conditions (see Hodes et al. (Reference Hodes, Zhang, Lam, Wilcoxon and Lower2014) for a summary of its thermophysical properties) and is highly susceptible to oxidation, the space in the grooves is best kept under a high vacuum and thus the shear-free meniscus assumption, which we invoke below, is a valid one. In short, trying to maximize the flow rate of liquid through a SH microchannel, causes three-dimensional (3-D) inertial effects due to the decrease in liquid pressure along the channel. This in turn causes a gradient in meniscus curvature, thus varying the geometry of the cross-sections as a microchannel is traversed.
In the present study we make significant analytical progress by utilizing the physically relevant limit of slow streamwise variations in the meniscus curvature that in turn imply streamwise velocity variations and the introduction of a transverse flow field. We make use of this limit to resolve 3-D effects and show that they can cause significant changes to quantities of interest, such as the slip length. This limit (as applied to flow through microchannels) has been previously utilized at various points in the past, in the context of no-slip channels. We give an overview here of some significant studies that use such methodology.
As discussed by Tanner (Reference Tanner1966), Kotorynski (Reference Kotorynski1979) and Van Dyke (Reference Van Dyke1983), Blasius (Reference Blasius1910) first studied the asymptotic limit for flows through channels with slowly varying geometry. He found expressions for the first-order perturbation of the flow field (with the channel diameter to length ratio as the small parameter) in the case of axisymmetric or two-dimensional channels. This limit was seemingly studied very little since then, until Tanner (Reference Tanner1966) extended this analysis to find a closed form expression for the change in pressure drop (for a fixed flow rate) caused by these slow variations. Manton (Reference Manton1971) extended the work of Tanner (Reference Tanner1966) to allow radial variation in the pressure gradient, and hence find a higher-order expression for the pressure.
A fully 3-D problem was solved by Wild, Pedley & Riley (Reference Wild, Pedley and Riley1977) who used the slowly varying approximation to find an exact solution for the zeroth-order velocity field and pressure for a slowly varying channel with elliptical cross-sections. Remarkably, they were also able to find the zeroth-order transverse velocity, the first-order streamwise velocity and the first-order pressure fields analytically for an order one Reynolds number. They do this for the case when the properties of the ellipse vary as a function of the streamwise dimension. They also extend this to the case in which the cross-sectional geometry is a function of the liquid pressure. Elasticity conditions are imposed on the channel boundaries in order to model blood flow through veins. The final part of this analysis is completed by fitting the relationship between cross-sectional area and pressure to experimental data. Coupling of liquid pressure with channel geometry is central to the present study, making the work of Wild et al. (Reference Wild, Pedley and Riley1977) of particular interest.
General expressions for slowly varying 3-D channels were generated by Kotorynski (Reference Kotorynski1979) who provided expressions for each order that can, in theory, be solved iteratively. The formulation was also applied to the particular case of a spiralling circular pipe. He also studied the case in which the channel geometry varies slowly in two dimensions.
Van Dyke (Reference Van Dyke1983) studied small (as well as slow) variations in a meandering two-dimensional channel of constant width by using an intrinsic coordinate system. He found analytical expressions for the first four terms of the asymptotic expansion of the streamfunction. A 3-D analogue to this problem was solved by Chadwick (Reference Chadwick1985) in the case of Stokes flow, who found that a small amount of channel curvature can actually decrease flow resistance. Following this, a survey article was written by Van Dyke (Reference Van Dyke1987), covering progress made up to that point in this field of study.
The case of slowly varying axisymmetric channels is revisited by Kotorynski (Reference Kotorynski1995) who used the slowly varying approximation to find an analytical asymptotic solution for the flow field through slowly varying axisymmetric channels. In contrast to previous efforts, Kotorynski’s solutions are valid for arbitrary radial profiles. Their formulation can, in principle, find expressions for the velocity field to any required order of accuracy.
More recently, Lauga, Stroock & Stone (Reference Lauga, Stroock and Stone2004) showed that flows through channels constrained by two parallel plates with (non-trivially) varying geometry are fully three-dimensional and discuss the implications of this with regards to mixing applications. Akbari, Sinton & Bahrami (Reference Akbari, Sinton and Bahrami2011) used a heuristic approach to relate the slowly varying elliptic model of Wild et al. (Reference Wild, Pedley and Riley1977) to that of an arbitrary cross-section. They also provided comparisons to experimental data, and find good agreement, attributing this to inclusion of the inertial terms.
The previous studies exclusively examine channels with a no-slip boundary condition in which a slow geometric variation is usually imposed. There has been some work on slowly varying channels with more exotic boundary conditions (see, e.g. Ghosal (Reference Ghosal2002)). However, the slowly varying limit has seldom been applied to meniscus geometries in superhydrophobic microchannels. D. G. Crowdy (private communication, 2017) has used this limit, in combination with an asymptotic solution to the two-dimensional problem, to capture the leading-order effect of slowly varying meniscus geometry. This is also captured in the present study, which goes on to calculate the leading-order transverse velocity field, as well as the first-order correction to the streamwise velocity field (which arises from inertial effects).
This paper is organized as follows. We formulate our mathematical model in § 2, and include the construction of asymptotic expansions (as part of the slowly varying approximation) and the derivation of the resulting governing equations and boundary conditions. Our methodology for solving these equations is a hybrid of numerical and analytical methods. In § 3, we give the analytical component of this methodology. This is subdivided into three parts, the zeroth-order streamwise velocity problem, the zeroth-order transverse velocity problem and the first-order streamwise velocity problem. In § 4, we outline the numerical component of our methodology. In § 5, we give our results, primarily in terms of the flow rate perturbation due to inertia. In § 6, we conclude with a summary.
2 Mathematical model
2.1 Fully three-dimensional problem and boundary conditions
We wish to calculate the volumetric flow rate of liquid flowing over parallel ridges aligned with the flow direction, including inertial effects caused by the streamwise variation in meniscus geometry. Guided by applications we assume that between the ridges there is a groove of sufficient depth to allow meniscus protrusion. We also assume that the grooves contain gas of negligible viscosity or, equivalently for our purposes, are under vacuum. We illustrate a microchannel characterized by such grooves and ridges in figure 1. This figure also indicates a region under consideration which, by symmetry, is representative of the entire liquid domain.
A section of the lower half of a superhydrophobic microchannel. The region contained within the red dotted lines represents that in which we develop our mathematical formulation. This region is illustrated in more depth in figure 2. The microchannel is symmetrical in the horizontal centre plane. Hence, the upper half of the microchannel (not shown) is a reflection of the lower half, in this plane.

(a) Full 3-D liquid domain and its boundaries, indicating key dimensional geometric quantities and (b) Two-dimensional (2-D) cross-section of the full 3-D domain corresponding to an arbitrary value of
 $z$
, given with corresponding boundary labels and indicating dimensionless geometric parameters. Note that the former is not drawn to scale and does not show the curvature gradient along boundary
 $A$
.

The liquid motion is governed by the steady Navier–Stokes equations and driven by a pressure drop over the microchannel length. In dimensional form the equations read,
 $$\begin{eqnarray}\displaystyle & \displaystyle \unicode[STIX]{x1D70C}(\boldsymbol{u}\boldsymbol{\cdot }\unicode[STIX]{x1D735})\boldsymbol{u}=-\unicode[STIX]{x1D735}p+\unicode[STIX]{x1D707}\unicode[STIX]{x1D6FB}^{2}\boldsymbol{u}, & \displaystyle\end{eqnarray}$$
 $$\begin{eqnarray}\displaystyle & \displaystyle \unicode[STIX]{x1D735}\boldsymbol{\cdot }\boldsymbol{u}=0, & \displaystyle\end{eqnarray}$$
where
 $\boldsymbol{u}=(u,v,w)$
is the velocity field in the usual Cartesian coordinate system
 $(x,y,z)$
where
 $x,y$
are cross-sectional coordinates and
 $z$
denotes the streamwise coordinate;
 $p$
is the pressure,
 $\unicode[STIX]{x1D70C}$
is the liquid density and
 $\unicode[STIX]{x1D707}$
its viscosity. Gravity is unimportant in the applications we are considering and is excluded. We have also assumed that the liquid is Newtonian. However, confirmation of this in the case of Galinstan has not been obtained due to complications in measuring the viscosity of liquid gallium alloys due to formation of an elastic oxide skin (Xu et al.
Reference Xu, Oudalov, Guo, Jaeger and Brown2012). Figure 2(a) illustrates the three-dimensional liquid domain, showing the distinct types of boundaries where different boundary conditions need to be applied. On the solid ridge
 $\boldsymbol{D}$
at
 $y=-H$
,
 $\unicode[STIX]{x1D6FF}<x<P$
, we impose a no-slip condition. On the meniscus
 $\boldsymbol{E}$
at the unknown interface
 $y=-h(x,z)$
,
 $0<x<\unicode[STIX]{x1D6FF}$
, we impose zero normal velocity since we are at steady state, and a balance of normal and tangential stresses noting that the latter lead to zero shear stress conditions since the gas viscosity is negligible. At the inflow front face
 $\boldsymbol{A}$
of the microchannel at
 $z=0$
, and its back end
 $\boldsymbol{G}$
at
 $z=L$
, we prescribe pressure values (when it is well-defined to do so – see below). The other boundaries
 $\boldsymbol{C}$
,
 $\boldsymbol{F}$
,
 $\boldsymbol{G}$
represent planes of symmetry, with appropriate boundary conditions imposed there. In summary, the (dimensional) boundary conditions are
 $$\begin{eqnarray}\displaystyle & \displaystyle p=p^{(1)}\quad \text{on }\boldsymbol{A}, & \displaystyle\end{eqnarray}$$
 $$\begin{eqnarray}\displaystyle & \displaystyle \frac{\unicode[STIX]{x2202}u}{\unicode[STIX]{x2202}y}=v=\frac{\unicode[STIX]{x2202}w}{\unicode[STIX]{x2202}y}=0\quad \text{on }\boldsymbol{B}, & \displaystyle\end{eqnarray}$$
 $$\begin{eqnarray}\displaystyle & \displaystyle u=\frac{\unicode[STIX]{x2202}v}{\unicode[STIX]{x2202}x}=\frac{\unicode[STIX]{x2202}w}{\unicode[STIX]{x2202}x}=0\quad \text{on }\boldsymbol{C}, & \displaystyle\end{eqnarray}$$
 $$\begin{eqnarray}\displaystyle & \displaystyle \boldsymbol{u}=0\quad \text{on }\boldsymbol{D}, & \displaystyle\end{eqnarray}$$
 $$\begin{eqnarray}\displaystyle \boldsymbol{u}\boldsymbol{\cdot }\boldsymbol{n}=0,\quad \boldsymbol{t}_{i}^{T}\,\unicode[STIX]{x1D70E}\,\boldsymbol{n}=0,\quad \boldsymbol{n}^{T}\,\unicode[STIX]{x1D748}\,\boldsymbol{n}+p^{(0)}+\unicode[STIX]{x1D6FE}\unicode[STIX]{x1D705}=0,\quad \text{on }\boldsymbol{E}, & & \displaystyle\end{eqnarray}$$
 $$\begin{eqnarray}\displaystyle & \displaystyle u=\frac{\unicode[STIX]{x2202}v}{\unicode[STIX]{x2202}x}=\frac{\unicode[STIX]{x2202}w}{\unicode[STIX]{x2202}x}=0\quad \text{on }\boldsymbol{F}, & \displaystyle\end{eqnarray}$$
 $$\begin{eqnarray}\displaystyle & \displaystyle p=p^{(0)}\quad \text{on }\boldsymbol{G}, & \displaystyle\end{eqnarray}$$
where
 $\unicode[STIX]{x1D705}$
is the mean curvature of the gas–liquid interface defined by
 $y=-h(x,z)$
,
 $\boldsymbol{n}$
is an inward facing normal to this surface,
 $\boldsymbol{t}_{i}$
,
 $i=1,2$
are two linearly independent vectors in a tangent plane with normal
 $\boldsymbol{n}$
and are chosen to be in the spanwise and streamwise directions, respectively, and
 $\unicode[STIX]{x1D748}=-p\unicode[STIX]{x1D644}+\unicode[STIX]{x1D707}(\unicode[STIX]{x1D735}\boldsymbol{u}+\unicode[STIX]{x1D735}\boldsymbol{u}^{\text{T}})$
is the viscous stress tensor. Superscripts T denote the transpose of a vector.
2.2 Non-dimensionalization and asymptotic expansions for slowly varying microchannels
We make analytical progress by considering the important limit when the dimensions of the microchannel cross-section are much smaller than its length, i.e.
 $H,P\ll L$
. We non-dimensionalize lengths by (half of) the ridge pitch
 $P$
or microchannel length
 $L$
as appropriate, and use the prescribed inlet and outlet pressures (denoted by
 $p^{(1)}$
and
 $p^{(0)}$
, respectively) to re-scale the pressure as shown below. Defining
 $\unicode[STIX]{x1D700}=P/L\ll 1$
we note that the streamwise velocity has scale
 $W=\unicode[STIX]{x1D700}P(p^{(1)}-p^{(0)})/\unicode[STIX]{x1D707}$
and consequently the velocity in the cross-section is one order higher and scales with
 $U=\unicode[STIX]{x1D700}W$
. The following dimensionless variables are introduced (decorated with star superscripts that will be dropped later)
 $$\begin{eqnarray}\displaystyle (x,y,z)=(Px^{\ast },Py^{\ast },Lz^{\ast }),\quad \boldsymbol{u}=(u,v,w)=(Uu^{\ast },Uv^{\ast },Ww^{\ast }), & & \displaystyle\end{eqnarray}$$
 $$\begin{eqnarray}\displaystyle p=p^{(0)}+(p^{(1)}-p^{(0)})p^{\ast },\quad \unicode[STIX]{x1D6FF}=P\unicode[STIX]{x1D6FF}^{\ast },\quad H=PH^{\ast },\quad h(x,z)=Ph^{\ast }(x^{\ast },z^{\ast }). & & \displaystyle\end{eqnarray}$$
The slowly varying assumption is characterized by
 $\unicode[STIX]{x1D700}\ll 1$
. Substituting (2.10)–(2.11) into the Navier–Stokes and continuity equations, (2.1) and (2.2), respectively, and dropping the stars yields
 $$\begin{eqnarray}\displaystyle & \unicode[STIX]{x1D700}^{3}Re(uu_{x}+vu_{y}+wu_{z})=-p_{x}+\unicode[STIX]{x1D700}^{2}(u_{xx}+u_{yy}+\unicode[STIX]{x1D700}^{2}u_{zz}), & \displaystyle\end{eqnarray}$$
 $$\begin{eqnarray}\displaystyle & \unicode[STIX]{x1D700}^{3}Re(uv_{x}+vv_{y}+wv_{z})=-p_{y}+\unicode[STIX]{x1D700}^{2}(v_{xx}+v_{yy}+\unicode[STIX]{x1D700}^{2}v_{zz}), & \displaystyle\end{eqnarray}$$
 $$\begin{eqnarray}\displaystyle & \unicode[STIX]{x1D700}Re(uw_{x}+vw_{y}+ww_{z})=-p_{z}+w_{xx}+w_{yy}+\unicode[STIX]{x1D700}^{2}w_{zz}, & \displaystyle\end{eqnarray}$$
 $$\begin{eqnarray}\displaystyle & u_{x}+v_{y}+w_{z}=0, & \displaystyle\end{eqnarray}$$
 $Re=\unicode[STIX]{x1D70C}WP/\unicode[STIX]{x1D707}$
and is assumed to be an order one quantity. We proceed with an asymptotic expansion of dependent variables in powers of
 $\unicode[STIX]{x1D700}$
:
 $$\begin{eqnarray}\displaystyle & u=u_{0}+\unicode[STIX]{x1D700}u_{1}+\cdots \,,\quad v=v_{0}+\unicode[STIX]{x1D700}v_{1}+\cdots \,,\quad w=w_{0}+\unicode[STIX]{x1D700}w_{1}+\cdots \,, & \displaystyle\end{eqnarray}$$
 $$\begin{eqnarray}\displaystyle & p=p_{0}+\unicode[STIX]{x1D700}p_{1}+\cdots \,,\quad h=H+h_{0}+\unicode[STIX]{x1D700}h_{1}+\cdots & \displaystyle\end{eqnarray}$$
 $\unicode[STIX]{x1D700}^{0}$
,
 $$\begin{eqnarray}\displaystyle & p_{0x}=0,\quad p_{0y}=0,\quad \unicode[STIX]{x1D6FB}_{\bot }^{2}w_{0}-p_{0z}=0, & \displaystyle\end{eqnarray}$$
 $$\begin{eqnarray}\displaystyle & u_{0x}+v_{0y}=-w_{0z}, & \displaystyle\end{eqnarray}$$
 $$\begin{eqnarray}\displaystyle & p_{0}(x,y,0)=1,\quad p_{0}(x,y,1)=0. & \displaystyle\end{eqnarray}$$
 $$\begin{eqnarray}\displaystyle \unicode[STIX]{x1D6FB}_{\bot }^{2}=\frac{\unicode[STIX]{x2202}^{2}}{\unicode[STIX]{x2202}x^{2}}+\frac{\unicode[STIX]{x2202}^{2}}{\unicode[STIX]{x2202}y^{2}}, & & \displaystyle\end{eqnarray}$$
to denote the Laplacian in cross-sectional variables. In § 2.3, we derive the remaining zeroth-order boundary conditions that apply at each cross-section. As implied by (2.14a
), the zeroth-order pressure is constant in each cross-section, validating our original choice of pressure drop boundary conditions. At order
 $\unicode[STIX]{x1D700}$
we find the system,
 $$\begin{eqnarray}\displaystyle & p_{1x}=0,\quad p_{1y}=0, & \displaystyle\end{eqnarray}$$
 $$\begin{eqnarray}\displaystyle & \unicode[STIX]{x1D6FB}_{\bot }^{2}w_{1}-p_{1z}=Re\,(u_{0}w_{0x}+v_{0}w_{0y}+w_{0}w_{0z}), & \displaystyle\end{eqnarray}$$
 $$\begin{eqnarray}\displaystyle & p_{1}(x,y,0)=0,\quad p_{1}(x,y,1)=0. & \displaystyle\end{eqnarray}$$
 $O(\unicode[STIX]{x1D700})$
correction to the volumetric flow rate, and this does not require consideration of the first-order continuity equation which would only be useful in computing
 $u_{1}$
and
 $v_{1}$
, which are not needed here.
At
 $O(\unicode[STIX]{x1D700}^{2})$
the
 $x$
and
 $y$
momentum equations yield governing equations for
 $u_{0}$
and
 $v_{0}$
,
 $$\begin{eqnarray}\displaystyle \unicode[STIX]{x1D6FB}_{\bot }^{2}u_{0}=p_{2x},\quad \unicode[STIX]{x1D6FB}_{\bot }^{2}v_{0}=p_{2y}. & & \displaystyle\end{eqnarray}$$
Solving for
 $u_{0}$
and
 $v_{0}$
is central in the analysis since they appear as forcings in the governing equation (2.16b
) for
 $w_{1}$
. Note that
 $w_{0z}$
is also needed to accomplish this since it appears as a forcing in (2.14b
) which is coupled to (2.17a,b
).
2.3 Boundary conditions
After non-dimensionalization the zero- and first-order boundary conditions are largely identical in appearance to the boundary conditions given in (2.3)–(2.9) with the exception of the stress balances treated next. Asymptotically, these are applied at the leading-order meniscus location,
 $y=-H-h_{0}(x,z)$
, with
 $0<x<\unicode[STIX]{x1D6FF}$
(where
 $\unicode[STIX]{x1D6FF}$
is the groove or cavity fraction on the textured surface) and where necessary Taylor expansions are performed around this value of
 $y$
to account for the higher-order terms in
 $h$
. In dimensional terms, points on the liquid–gas interface are parametrized as
 $(x,-h(x,z),z)$
, and two linearly independent unit tangent vectors
 $\boldsymbol{t}_{1}$
and
 $\boldsymbol{t}_{2}$
, and the inwards pointing unit normal vector
 $\boldsymbol{n}$
can be expressed by
 $$\begin{eqnarray}\displaystyle \boldsymbol{t}_{1}=\frac{(1,-h_{x},0)^{T}}{\sqrt{1+h_{x}^{2}}},\quad \boldsymbol{t}_{2}=\frac{(0,-h_{z},1)^{T}}{\sqrt{1+h_{z}^{2}}},\quad \boldsymbol{n}=\frac{\unicode[STIX]{x1D735}(y+h(x,z))}{|\unicode[STIX]{x1D735}(y+h(x,z))|}=\frac{(h_{x},1,h_{z})^{T}}{\sqrt{1+h_{x}^{2}+h_{z}^{2}}}. & & \displaystyle \nonumber\\ \displaystyle & & \displaystyle\end{eqnarray}$$
Hence the impermeability condition (2.7a ) reads
 $$\begin{eqnarray}\displaystyle 0=\boldsymbol{u}\boldsymbol{\cdot }\boldsymbol{n}=\frac{1}{\sqrt{1+h_{x}^{2}+h_{z}^{2}}}(uh_{x}+v+wh_{z}), & & \displaystyle\end{eqnarray}$$
which gives, to leading order (after non-dimensionalization and dropping stars)
 $$\begin{eqnarray}\displaystyle u_{0}h_{0x}+v_{0}=-w_{0}h_{0z}. & & \displaystyle\end{eqnarray}$$
This is needed to determine the cross-flow and does not enter into the first-order analysis. The remaining conditions are the tangential and normal stress balances (2.7), namely
 $\boldsymbol{t}_{1}^{T}\unicode[STIX]{x1D748}\boldsymbol{n}=0$
,
 $\boldsymbol{t}_{2}^{T}\unicode[STIX]{x1D748}\boldsymbol{n}=0$
and
 $\boldsymbol{n}^{T}\unicode[STIX]{x1D748}\boldsymbol{n}+p^{(0)}=\unicode[STIX]{x1D6FE}\unicode[STIX]{x1D705}$
. We provide the detailed derivations of the zeroth- and (where necessary) first-order approximations of these boundary conditions in appendix A, and list the results here. The condition
 $\boldsymbol{t}_{1}^{T}\unicode[STIX]{x1D748}\boldsymbol{n}=0$
, at zeroth order, gives
 $$\begin{eqnarray}\displaystyle 2h_{0x}(u_{0x}-v_{0y})+(u_{0y}+v_{0x})(1-h_{0x}^{2})=h_{0z}h_{0x}w_{0y}-h_{0z}w_{0x},\quad \text{on}~y=-H-h_{0}(x,z). & & \displaystyle \nonumber\\ \displaystyle & & \displaystyle\end{eqnarray}$$
Once again, this condition determines the cross-flow only and is not needed to first order. The condition
 $\boldsymbol{t}_{2}^{T}\unicode[STIX]{x1D748}\boldsymbol{n}=0$
, at zeroth order, gives
 $$\begin{eqnarray}\displaystyle w_{0x}h_{0x}+w_{0y}=0,\quad \text{on}~y=-H-h_{0}(x,z), & & \displaystyle\end{eqnarray}$$
which recovers the no-shear condition for the two-dimensional streamwise field
 $w_{0}$
. At first order, this tangential stress balance yields
 $$\begin{eqnarray}\displaystyle w_{1x}h_{0x}+w_{1y}=h_{1}w_{0yy}+h_{1}w_{0xy}h_{0x}-w_{0x}h_{1x},\quad \text{on}~y=-H-h_{0}(x,z). & & \displaystyle\end{eqnarray}$$
The dimensionless normal stress balance (2.7c ) or (A 8) fully written out, becomes at leading order,
 $$\begin{eqnarray}\displaystyle p_{0}=-\unicode[STIX]{x1D6E4}\frac{h_{0xx}}{(1+h_{0x}^{2})^{3/2}},\quad \text{on}~y=-H-h_{0}(x,z), & & \displaystyle\end{eqnarray}$$
where
 $\unicode[STIX]{x1D6E4}=\unicode[STIX]{x1D6FE}/(P(p^{(1)}-p^{(0)}))$
. Condition (2.24) is identical to the pressure condition used in the two-dimensional parallel flow problem, and is only used to determine the coupling between the pressure and the geometry of the meniscus. As in the 2-D problem, at every
 $z$
, we have that
 $h_{0}(x,z)$
represents the circular arc of radius
 $\unicode[STIX]{x1D6E4}/p_{0}(z)$
with
 $h_{0x}=0$
at
 $x=0$
and
 $h_{0}=0$
at
 $x=\unicode[STIX]{x1D6FF}$
. Equivalently,
 $$\begin{eqnarray}\displaystyle h_{0}(x,z)=\left[\left(\frac{\unicode[STIX]{x1D6E4}}{p_{0}(z)}\right)^{2}-x^{2}\right]^{1/2}-\left[\left(\frac{\unicode[STIX]{x1D6E4}}{p_{0}(z)}\right)^{2}-\unicode[STIX]{x1D6FF}^{2}\right]^{1/2}. & & \displaystyle\end{eqnarray}$$
Since
 $h_{0}$
is determined by
 $p_{0}$
which is a monotonic function of
 $z$
, we can instead consider it as a function of
 $p_{0}$
itself. Henceforth we will write
 $h_{0}(x,p_{0})$
as a shorthand for
 $h_{0}(x,z(p_{0}))$
and likewise for other functions of
 $z$
. Continuing to first order in the normal stress balance provides, on
 $y=-H-h_{0}(x,z)$
,
 $$\begin{eqnarray}\displaystyle p_{1}=-\unicode[STIX]{x1D6E4}\left(\frac{h_{1xx}}{(1+h_{0x}^{2})^{3/2}}-\frac{3h_{0x}h_{0xx}h_{1x}}{(1+h_{0x}^{2})^{5/2}}\right)=-\frac{\text{d}}{\text{d}x}\frac{\unicode[STIX]{x1D6E4}h_{1x}}{(1+h_{0x}^{2})^{3/2}}. & & \displaystyle\end{eqnarray}$$
Recalling that
 $p_{1}$
is independent of
 $x$
and
 $y$
(see (2.16a
)), and integrating (2.26) in
 $x$
gives
 $$\begin{eqnarray}\displaystyle xp_{1}=-\frac{\unicode[STIX]{x1D6E4}h_{1x}}{(1+h_{0x}^{2})^{3/2}}, & & \displaystyle\end{eqnarray}$$
since, by symmetry, we require
 $h_{1x}(0)=0$
. Using (2.24) in (2.27) casts the latter into
 $$\begin{eqnarray}\displaystyle h_{1x}=\frac{p_{1}}{p_{0}}xh_{0xx}. & & \displaystyle\end{eqnarray}$$
Integrating by parts gives
 $$\begin{eqnarray}\displaystyle h_{1}(x,p_{0})=p_{1}(p_{0})g_{1}(x,p_{0}), & & \displaystyle\end{eqnarray}$$
where
 $$\begin{eqnarray}\displaystyle g_{1}(x,p_{0})=\frac{1}{p_{0}}(xh_{0x}-h_{0}-\unicode[STIX]{x1D6FF}h_{0x}(\unicode[STIX]{x1D6FF})). & & \displaystyle\end{eqnarray}$$
The conditions
 $h_{0}(\unicode[STIX]{x1D6FF})=h_{1}(\unicode[STIX]{x1D6FF})=0$
have been used to fix the integration constant. Note that
 $g_{1}$
is well defined. In particular, we can evaluate
 $g_{1}(x,p_{0})$
at
 $p_{0}=0$
, as revealed by an asymptotic expansion of (2.25) for small
 $p_{0}$
which gives
 $$\begin{eqnarray}\displaystyle h_{0}\sim \frac{p_{0}}{2\unicode[STIX]{x1D6E4}}(\unicode[STIX]{x1D6FF}^{2}-x^{2})+O(p_{0}^{3})\quad \text{as }p_{0}\rightarrow 0. & & \displaystyle\end{eqnarray}$$
3 Semi-analytical solution and calculation of the volumetric flow rate
One of the central objectives of the present work is the calculation of the volumetric flow rate due to the effect of slow variations in the meniscus curvature. Recall that applications seek to maximize the pressure drop and hence the inlet meniscus curvature – the meniscus then relaxes to a flat interface at the microchannel exit assuming the pressure reaches its ambient value. We derive expressions for
 $Q_{0}$
and
 $Q_{1}$
, say, the first two terms of the asymptotic expansion of the volumetric flow rate through the microchannel. As we show below,
 $Q_{0}$
depends on the leading-order streamwise velocity
 $w_{0}(x,y,z)$
and leading-order meniscus shape
 $h_{0}(x,z)$
which need to be determined together since the leading-order pressure gradient
 $\text{d}p_{0}/\text{d}z$
is not known at a given cross-section – we show below how we can solve this problem. The correction
 $Q_{1}$
in turn depends on the streamwise velocity correction
 $w_{1}$
, the correction
 $p_{1}$
to the pressure and the associated correction
 $h_{1}$
to the interfacial shape. To accomplish this calculation we need to solve for the cross-flow velocities and in addition need to retain inertial effects as we see below.
3.1 Volumetric flow rate
We begin by formally deriving the expansion for the volumetric flow rate in the form
 $$\begin{eqnarray}\displaystyle Q=Q_{0}+\unicode[STIX]{x1D700}Q_{1}+\cdots \,. & & \displaystyle\end{eqnarray}$$
Integrating the continuity equation (2.12d
) over an interval
 $z_{1}\leqslant z\leqslant z_{2}$
and applying the divergence theorem leads to
 $$\begin{eqnarray}\displaystyle \int \int _{D(z_{1})}w(x,y,z_{1})\,\text{d}x\,\text{d}y=\int \int _{D(z_{2})}w(x,y,z_{2})\,\text{d}x\,\text{d}y=Q, & & \displaystyle\end{eqnarray}$$
where
 $Q$
is the constant flow rate (we are at steady state),
 $0\leqslant z_{1}<z_{2}\leqslant 1$
are arbitrary and
 $D(z)$
is the cross-section (normal to the streamwise direction) of the 3-D domain at the streamwise station
 $z$
. Due to the arbitrary nature of
 $z_{1}$
and
 $z_{2}$
, it follows that for every
 $0\leqslant z\leqslant 1$
 $$\begin{eqnarray}\displaystyle \int \int _{D(z)}w(x,y,z)\,\text{d}x\,\text{d}y=Q. & & \displaystyle\end{eqnarray}$$
Firstly note that
 $$\begin{eqnarray}\displaystyle \int \int _{D(z)}w(x,y,z)\,\text{d}x\,\text{d}y=\int _{0}^{\unicode[STIX]{x1D6FF}}\underbrace{\int _{-h(x,z)}^{0}w(x,y,z)\,\text{d}y}_{I(x,z)}\,\text{d}x+\int _{\unicode[STIX]{x1D6FF}}^{1}\int _{-H}^{0}w(x,y,z)\,\text{d}y\,\text{d}x, & & \displaystyle\end{eqnarray}$$
where we have defined
 $I(x,z)=\int _{-h(x,z)}^{0}w(x,y,z)\,\text{d}y$
as indicated. Note also that the interface is defined to be at
 $y=-h(x,z)=-(H+h_{0}(x,z)+\unicode[STIX]{x1D700}h_{1}(x,z)+\cdots \,)$
. In order to find the expansion for
 $Q$
, we first find that for
 $I(x,z)$
. We start by splitting the range of integration,
 $$\begin{eqnarray}\displaystyle I(x,z) & = & \displaystyle \left(\int _{-H-h_{0}(x,z)}^{0}+\int _{-H-h_{0}(x,z)-\unicode[STIX]{x1D700}h_{1}(x,z)}^{-H-h_{0}(x,z)}\right.\nonumber\\ \displaystyle & & \displaystyle +\left.\int _{-H-h_{0}(x,z)-\unicode[STIX]{x1D700}h_{1}(x,z)-\unicode[STIX]{x1D700}^{2}h_{2}(x,z)}^{-H-h_{0}(x,z)-\unicode[STIX]{x1D700}h_{1}(x,z)}+\cdots \!\right)w(x,y,z)\,\text{d}y.\end{eqnarray}$$
The third integral has size
 $O(\unicode[STIX]{x1D700}^{2})$
since its range is of
 $O(\unicode[STIX]{x1D700}^{2})$
and the integrand is bounded; hence it is not retained in the analysis. Next, by Taylor expanding the second integrand in (3.5) about
 $y=-H-h_{0}(x,z)$
and using the asymptotic series (2.13a
) for
 $w$
, we obtain
 $$\begin{eqnarray}\displaystyle I(x,z) & = & \displaystyle \int _{-H-h_{0}(x,z)}^{0}w_{0}(x,y,z)\,\text{d}y\nonumber\\ \displaystyle & & \displaystyle +\,\unicode[STIX]{x1D700}\left(h_{1}(x,z)w_{0}(x,-H-h_{0}(x,z))+\int _{-H-h_{0}(x,z)}^{0}w_{1}(x,y,z)\,\text{d}y\right)+O(\unicode[STIX]{x1D700}^{2}).\nonumber\\ \displaystyle & & \displaystyle\end{eqnarray}$$
Furnished with (3.6), the expressions for
 $Q_{0}$
and
 $Q_{1}$
follow readily:
 $$\begin{eqnarray}\displaystyle & \displaystyle Q_{0}=\int \int _{D_{0}(z)}w_{0}(x,y,z)\,\text{d}x\,\text{d}y, & \displaystyle\end{eqnarray}$$
 $$\begin{eqnarray}\displaystyle & \displaystyle Q_{1}=p_{1}\int _{0}^{\unicode[STIX]{x1D6FF}}g_{1}(x,z)w_{0}(x,-H-h_{0}(x,z),z)\,\text{d}x+\int \int _{D_{0}(z)}w_{1}(x,y,z)\,\text{d}x\,\text{d}y, & \displaystyle\end{eqnarray}$$
where
 $D_{0}(z)$
is the leading-order cross-section whose only difference from
 $D(z)$
is that the former has a liquid–gas meniscus boundary given by the leading-order expression
 $y=-H-h_{0}(x,z)$
. To compute
 $Q_{0}$
and
 $Q_{1}$
we need to solve for the leading-order streamwise velocity, the cross-flow problem and the first-order streamwise problem. These are addressed next.
3.2 Zeroth-order streamwise velocity problem
As mentioned in § 2.3 we find it convenient to work with
 $p_{0}$
as the streamwise independent variable rather than
 $z$
. In what follows we provide a method for finding
 $z(p_{0})$
,
 $w_{0}(x,y,p_{0})$
and hence
 $Q_{0}$
from (3.7). The difficulty is that, at each cross-section, the forcing
 $\text{d}p_{0}/\text{d}z$
is unknown and
 $p_{0}$
also determines its geometry. Hence, we solve a complimentary problem that allows us to apply the numerical method without knowledge of
 $z(p_{0})$
, and use the acquired numerical results to then solve the fully coupled problem.
Note from (2.14a
) that since
 $p_{0}$
is constant in each cross-section, it follows that
 $\text{d}p_{0}/\text{d}z$
is also constant in each cross-section. This is the only forcing in equation (2.14a
) for
 $w_{0}$
, hence at a fixed streamwise location,
 $w_{0}$
is proportional to the leading-order pressure gradient. Substituting
 $$\begin{eqnarray}\displaystyle w_{0}=-\frac{\text{d}p_{0}}{\text{d}z}\,W_{0}, & & \displaystyle\end{eqnarray}$$
into (2.14a
) yields the following Poisson equation at each cross-section (geometrically characterized by a fixed value of
 $p_{0}$
)
 $$\begin{eqnarray}\displaystyle \unicode[STIX]{x1D6FB}_{\bot }^{2}W_{0}=-1. & & \displaystyle\end{eqnarray}$$
The leading-order boundary conditions to be satisfied by solutions of (3.10) are (see § 2.3 and in particular the tangential stress balance condition (2.22) at the meniscus)
 $$\begin{eqnarray}\displaystyle & \displaystyle W_{0x}h_{0x}+W_{0y}=0\quad \text{on }y=-h_{0}(x,p_{0}),0<x<\unicode[STIX]{x1D6FF}, & \displaystyle\end{eqnarray}$$
 $$\begin{eqnarray}\displaystyle & \displaystyle W_{0}=0\quad \text{on }y=-H,\unicode[STIX]{x1D6FF}<x<1, & \displaystyle\end{eqnarray}$$
 $$\begin{eqnarray}\displaystyle & \displaystyle W_{0x}=0\quad \text{on }x=0,1, & \displaystyle\end{eqnarray}$$
 $$\begin{eqnarray}\displaystyle & \displaystyle W_{0y}=0\quad \text{on }y=0. & \displaystyle\end{eqnarray}$$
This can be solved numerically using the method outlined in § 4. We define
 $\widetilde{Q}_{0}$
to be the integral of
 $W_{0}$
over the leading-order cross-section
 $D_{0}$
,
 $$\begin{eqnarray}\displaystyle \widetilde{Q}_{0}(p_{0})=\int \int _{D_{0}(p_{0})}W_{0}(x,y,p_{0})\,\text{d}x\,\text{d}y. & & \displaystyle\end{eqnarray}$$
This quantity can be found numerically at discrete values
 $p_{0}^{(n)}$
as defined in (4.1). Substituting the definition (3.9) into (3.15) and making use of (3.7) gives
 $$\begin{eqnarray}\displaystyle -\widetilde{Q}_{0}(p_{0})\frac{\text{d}p_{0}}{\text{d}z}=Q_{0}. & & \displaystyle\end{eqnarray}$$
Equation (3.16) relates the auxiliary quantity
 $\widetilde{Q}_{0}$
that we can calculate at any cross-section, to the physically relevant constant flow rate
 $Q_{0}$
that we are seeking. Rearranging (3.16) and integrating both sides with respect to
 $p_{0}$
(first an integration between 0 and 1 to calculate
 $Q_{0}$
followed by an indefinite integral between
 $0$
and
 $p_{0}$
) gives the following expressions for
 $Q_{0}$
and
 $z(p_{0})$
 $$\begin{eqnarray}\displaystyle & \displaystyle Q_{0}=\int _{0}^{1}\widetilde{Q}_{0}(p^{\prime })\,\text{d}p^{\prime }, & \displaystyle\end{eqnarray}$$
 $$\begin{eqnarray}\displaystyle & \displaystyle z(p_{0})=1-\frac{\displaystyle \int _{0}^{p_{0}}\widetilde{Q}_{0}(p^{\prime })\,\text{d}p^{\prime }}{\displaystyle \int _{0}^{1}\widetilde{Q}_{0}(p^{\prime })\,\text{d}p^{\prime }}. & \displaystyle\end{eqnarray}$$
Having calculated the values of
 $\widetilde{Q}_{0}(p_{0})$
at the Chebyshev points
 $p_{0}^{(n)}$
as defined in (4.1), we compute integrals (3.17)–(3.18) in turn using Chebyshev collocation methods. We then recover
 $\text{d}p_{0}/\text{d}z$
from (3.16), and obtain
 $w_{0}$
from the definition (3.9).
3.3 Cross-flow problem
In order to find
 $u_{0}$
and
 $v_{0}$
which automatically satisfy the continuity equation (2.14b
) and to eliminate
 $p_{2}$
from (2.17), we define a modified streamfunction
 $\unicode[STIX]{x1D713}$
such that
 $$\begin{eqnarray}\displaystyle u_{0}(x,y,z)=\unicode[STIX]{x1D713}_{y}(x,y,z),\quad v_{0}(x,y,z)=-\unicode[STIX]{x1D713}_{x}(x,y,z)+\int _{y}^{0}w_{0z}(x,y^{\prime },z)\,\text{d}y^{\prime }. & & \displaystyle\end{eqnarray}$$
Cross-differentiating (2.17) to eliminate
 $p_{2}$
, and substituting (3.19) provides the following equation for
 $\unicode[STIX]{x1D713}$
 $$\begin{eqnarray}\displaystyle \unicode[STIX]{x1D713}_{xxxx}+2\unicode[STIX]{x1D713}_{xxyy}+\unicode[STIX]{x1D713}_{yyyy}=\left(\int _{y}^{0}w_{0z}\,\text{d}y^{\prime }\right)_{xxx}+\left(\int _{y}^{0}w_{0z}\,\text{d}y^{\prime }\right)_{xyy}. & & \displaystyle\end{eqnarray}$$
The right-hand side of (3.20) is identically zero as we show next. Using the leading-order streamwise momentum equation (2.14a
) we have
 $w_{0xx}=p_{0z}-w_{0yy}$
and so
 $$\begin{eqnarray}\displaystyle \left(\int _{y}^{0}w_{0z}\,\text{d}y^{\prime }\right)_{xxx}+\left(\int _{y}^{0}w_{0z}\,\text{d}y^{\prime }\right)_{xyy}=\int _{y}^{0}(p_{0xzz}-w_{0xyyz})\,\text{d}y^{\prime }-w_{0xyz}=0, & & \displaystyle\end{eqnarray}$$
since
 $p_{0x}=0$
from (2.14a
). Hence, in order to obtain the cross-flow we need to solve a biharmonic equation in the cross-plane,
 $$\begin{eqnarray}\displaystyle \unicode[STIX]{x1D6FB}_{\bot }^{4}\unicode[STIX]{x1D713}=0. & & \displaystyle\end{eqnarray}$$
This is to be solved subject to the meniscus boundary conditions (2.20) and (2.21) which in terms of
 $\unicode[STIX]{x1D713}$
read
 $$\begin{eqnarray}\displaystyle h_{0x}\unicode[STIX]{x1D713}_{y}-\unicode[STIX]{x1D713}_{x}=-h_{0z}w_{0}-\int _{-H-h_{0}(x)}^{0}w_{0z}\text{d}y, & & \displaystyle\end{eqnarray}$$
 $$\begin{eqnarray}\displaystyle 4h_{0x}\unicode[STIX]{x1D713}_{xy}+(\unicode[STIX]{x1D713}_{yy}-\unicode[STIX]{x1D713}_{xx})(1-h_{0x}^{2}) & = & \displaystyle h_{0z}h_{0x}w_{0y}-h_{0z}w_{0x}-2h_{0x}w_{0z}\nonumber\\ \displaystyle & & \displaystyle -\,\int _{-H-h_{0}(x)}^{0}w_{0xz}\,\text{d}y(1-h_{0x}^{2}).\end{eqnarray}$$
Substitution of (3.19) into the remaining boundary conditions for
 $u_{0}$
and
 $v_{0}$
, and then integration of the resultant tangential derivative conditions to produce equivalent Dirichlet conditions (choosing
 $\unicode[STIX]{x1D713}=0$
on
 $y=0$
without loss of generality), gives the remaining boundary conditions for
 $\unicode[STIX]{x1D713}$
. Firstly,
 $$\begin{eqnarray}\displaystyle \unicode[STIX]{x1D713}_{y}=0,\quad \unicode[STIX]{x1D713}=-\int _{x}^{1}\int _{-H}^{0}w_{0z}\,\text{d}y\,\text{d}x\quad \text{on }y=-H,x>\unicode[STIX]{x1D6FF}, & & \displaystyle\end{eqnarray}$$
from the no-slip and impermeability conditions on the solid ridge, respectively. Secondly,
 $$\begin{eqnarray}\displaystyle \unicode[STIX]{x1D713}=0,\quad \unicode[STIX]{x1D713}_{xx}=\int _{y}^{0}w_{0xz}\,\text{d}y=0\quad \text{on }x=0,1, & & \displaystyle\end{eqnarray}$$
from impermeability at the vertical planes of symmetry and the symmetry condition on
 $v_{0}$
, respectively. Thirdly,
 $$\begin{eqnarray}\displaystyle \unicode[STIX]{x1D713}=0,\quad \unicode[STIX]{x1D713}_{yy}=0\quad \text{on }y=0, & & \displaystyle\end{eqnarray}$$
from impermeability at the horizontal plane of symmetry and the symmetry condition on
 $u_{0}$
, respectively. It can also be shown by integrating the tangential derivative of
 $\unicode[STIX]{x1D713}$
over a section of the meniscus and applying the gradient theorem, that (3.23) is equivalent to:
 $$\begin{eqnarray}\displaystyle \unicode[STIX]{x1D713}=-\int _{\unicode[STIX]{x1D6FF}}^{1}\int _{-H}^{0}w_{0z}\,\text{d}y\,\text{d}x-\int _{x}^{\unicode[STIX]{x1D6FF}}\int _{-H-h_{0}(x)}^{0}w_{0z}\,\text{d}y\,\text{d}x-\int _{x}^{\unicode[STIX]{x1D6FF}}w_{0}(x,-H-h_{0}(x))h_{0z}\,\text{d}x. & & \displaystyle \nonumber\\ \displaystyle & & \displaystyle\end{eqnarray}$$
Note that, at
 $x=0$
, the right-hand side of (3.28) is equal to
 $-\text{d}Q_{0}/\text{d}z$
(by the Leibniz integral rule), which is equal to zero, since
 $Q_{0}$
is constant. Hence, it can be verified that the preceding boundary conditions for
 $\unicode[STIX]{x1D713}$
preserve continuity around the boundary.
This system for
 $\unicode[STIX]{x1D713}$
is solved at each required cross-section (according to our discretization in the
 $p_{0}$
direction) using the method outlined in § 4 below.
3.4 First-order streamwise velocity problem
We address equations (2.16a
)–(2.16c
) and obtain the solutions for
 $p_{1}(p_{0})$
,
 $h_{1}(p_{0})$
,
 $w_{1}$
and hence
 $Q_{1}$
from the expression (3.8). The first-order boundary conditions to be satisfied at the curved meniscus and the solid ridge, together with symmetry conditions at
 $x=0,1$
and
 $y=0$
, and zero conditions for the inlet and outlet perturbation pressure read
 $$\begin{eqnarray}\displaystyle & \displaystyle w_{1x}h_{0x}+w_{1y}=p_{1}(g_{1}h_{0x}w_{0xy}+g_{1}w_{0yy}-g_{1x}w_{0x})\quad \text{on }y=-H-h_{0}(x), & \displaystyle\end{eqnarray}$$
 $$\begin{eqnarray}\displaystyle & \displaystyle w_{1}=0\quad \text{on }y=-H,x>\unicode[STIX]{x1D6FF}, & \displaystyle\end{eqnarray}$$
 $$\begin{eqnarray}\displaystyle & \displaystyle w_{1x}=0\quad \text{on }x=0,1, & \displaystyle\end{eqnarray}$$
 $$\begin{eqnarray}\displaystyle & \displaystyle w_{1y}=0\quad \text{on }y=0, & \displaystyle\end{eqnarray}$$
 $$\begin{eqnarray}\displaystyle & \displaystyle p_{1}=0\quad \text{on }z=0,1. & \displaystyle\end{eqnarray}$$
The tangential stress condition (3.29) follows from (2.23) after use of (2.29) and (2.30) for
 $h_{1}$
. An apparent complexity in the above system is the fact that
 $p_{1}$
is unknown and depends on
 $p_{0}$
which in turn determines the geometry of the domain. This is resolved by utilizing the linearity of the problem and identifying three
 $p_{1}$
-independent auxiliary problems whose solutions are superimposed with
 $p_{1}$
as a multiplicative function. The auxiliary problems need to be addressed numerically but are either similar to or identical to the solution for
 $w_{0}$
described in § 3.2, so that our existing numerical algorithms can be used. Once the functional form of the solutions is found, we address the fully coupled problem as described next. To motivate the decomposition consider (2.16b
) written in the form
 $$\begin{eqnarray}\displaystyle w_{1xx}+w_{1yy}=\frac{\text{d}p_{1}}{\text{d}p_{0}}\,p_{0z}+Re\,(u_{0}w_{0x}+v_{0}w_{0y}+w_{0}w_{0z}), & & \displaystyle\end{eqnarray}$$
with the first term on the right-hand side followed by the chain rule and the fact that
 $p_{1x}=p_{1y}=0$
– see (2.16a
). Comparison of (3.34) and the boundary conditions (3.29)–(3.33) with the leading-order streamwise problem (2.14a
) and its boundary conditions (in particular the tangential stress balance (2.22) since the other symmetry and no-slip conditions are homogeneous), shows that we must deal with three inhomogeneous terms to solve the problem. These are the right-hand side of (3.29) where the only unknown is the function multiplying
 $p_{1}$
, along with the pressure gradient and inertial terms on the right-hand side of (3.34). Hence, looking for a solution of the form
 $$\begin{eqnarray}\displaystyle w_{1}=p_{1}w_{A}+\frac{\text{d}p_{1}}{\text{d}p_{0}}w_{B}+Re\,w_{C}, & & \displaystyle\end{eqnarray}$$
we have
 $$\begin{eqnarray}\displaystyle & \displaystyle \unicode[STIX]{x1D6FB}_{\bot }^{2}w_{A}=0, & \displaystyle\end{eqnarray}$$
 $$\begin{eqnarray}\displaystyle & \displaystyle \unicode[STIX]{x1D6FB}_{\bot }^{2}w_{B}=\frac{\text{d}p_{0}}{\text{d}z}, & \displaystyle\end{eqnarray}$$
 $$\begin{eqnarray}\displaystyle & \displaystyle \unicode[STIX]{x1D6FB}_{\bot }^{2}w_{C}=u_{0}w_{0x}+v_{0}w_{0y}+w_{0}w_{0z}, & \displaystyle\end{eqnarray}$$
subject to the boundary conditions
 $$\begin{eqnarray}\displaystyle & \displaystyle w_{Ax}h_{0x}+w_{Ay}=g_{1}h_{0x}w_{0xy}+g_{1}w_{0yy}-g_{1x}w_{0x}, & \displaystyle\end{eqnarray}$$
 $$\begin{eqnarray}\displaystyle & \displaystyle w_{Bx}h_{0x}+w_{By}=w_{Cx}h_{0x}+w_{Cy}=0\quad \text{on }y=-H-h_{0}(x), & \displaystyle\end{eqnarray}$$
 $$\begin{eqnarray}\displaystyle & \displaystyle w_{A}=w_{B}=w_{C}=0\quad \text{on }y=-H,x>\unicode[STIX]{x1D6FF}, & \displaystyle\end{eqnarray}$$
 $$\begin{eqnarray}\displaystyle & \displaystyle w_{Ax}=w_{Bx}=w_{Cx}=0\quad \text{on }x=0,1, & \displaystyle\end{eqnarray}$$
 $$\begin{eqnarray}\displaystyle & \displaystyle w_{Ay}=w_{By}=w_{Cy}=0\quad \text{on }y=0. & \displaystyle\end{eqnarray}$$
Note that the solution
 $w_{B}$
is identical to
 $w_{0}$
which is already known –
 $w_{B}=-(\text{d}p_{0}/\text{d}z)W_{0}$
with
 $W_{0}$
already found from (3.10)–(3.14). The remaining solutions
 $w_{A}$
and
 $w_{C}$
can be found at each required cross section by discretization in
 $p_{0}$
using the methods of § 4.
To obtain the correction
 $Q_{1}$
to the flux given by (3.8), we integrate the solution (3.35) over any cross-sectional area
 $D_{0}(p_{0})$
as defined earlier in § 3.1. Since
 $p_{1}$
is a function of
 $p_{0}$
alone, this integration can be easily accomplished to yield
 $$\begin{eqnarray}\displaystyle Q_{1}=p_{1}Q_{A}(p_{0})+\frac{\text{d}p_{1}}{\text{d}p_{0}}\,Q_{B}(p_{0})+Re\,Q_{C}(p_{0}), & & \displaystyle\end{eqnarray}$$
where
 $$\begin{eqnarray}\displaystyle & \displaystyle Q_{A}(p_{0})=\int \int _{D_{0}(p_{0})}w_{A}\,\text{d}x\,\text{d}y+\int _{0}^{\unicode[STIX]{x1D6FF}}g_{1}(x)w_{0}(x,-H-h_{0}(x))\,\text{d}x, & \displaystyle\end{eqnarray}$$
 $$\begin{eqnarray}\displaystyle & \displaystyle Q_{B}(p_{0})=\int \int _{D_{0}(p_{0})}w_{B}\,\text{d}x\,\text{d}y, & \displaystyle\end{eqnarray}$$
 $$\begin{eqnarray}\displaystyle & \displaystyle Q_{C}(p_{0})=\int \int _{D_{0}(p_{0})}w_{C}\,\text{d}x\,\text{d}y. & \displaystyle\end{eqnarray}$$
Since
 $w_{B}=w_{0}$
, this implies that
 $Q_{B}(p_{0})=Q_{0}=\text{const.}$
, and so (3.44) can be rearranged to give
 $$\begin{eqnarray}\displaystyle \frac{\text{d}p_{1}}{\text{d}p_{0}}+\frac{Q_{A}(p_{0})}{Q_{0}}p_{1}=\frac{Q_{1}}{Q_{0}}-Re\frac{Q_{C}(p_{0})}{Q_{0}}, & & \displaystyle\end{eqnarray}$$
which in turn can be cast into
 $$\begin{eqnarray}\displaystyle \frac{\text{d}}{\text{d}p_{0}}(p_{1}\unicode[STIX]{x1D6EC}(p_{0}))=\frac{\unicode[STIX]{x1D6EC}(p_{0})}{Q_{0}}(Q_{1}-ReQ_{C}), & & \displaystyle\end{eqnarray}$$
where
 $$\begin{eqnarray}\displaystyle \unicode[STIX]{x1D6EC}=\text{exp}\left(\frac{1}{Q_{0}}\int _{0}^{p_{0}}Q_{A}(p_{0}^{\prime })\,\text{d}p_{0}^{\prime }\right). & & \displaystyle\end{eqnarray}$$
Integrating (3.49) with respect to
 $p_{0}$
yields
 $$\begin{eqnarray}\displaystyle p_{1}=\frac{1}{Q_{0}\unicode[STIX]{x1D6EC}(p_{0})}\int _{0}^{p_{0}}\unicode[STIX]{x1D6EC}(p_{0}^{\prime })(Q_{1}-Re\,Q_{C}(p_{0}^{\prime }))\,\text{d}p_{0}^{\prime }, & & \displaystyle\end{eqnarray}$$
where the lower limit is chosen to satisfy the outlet pressure condition
 $p_{1}=0$
at
 $p_{0}=0$
. The inlet condition for
 $p_{1}$
translates into
 $p_{1}=0$
at
 $p_{0}=1$
, and applying this to (3.51) provides an expression for the flux correction
 $Q_{1}$
,
 $$\begin{eqnarray}\displaystyle Q_{1}=Re\,\overline{Q}_{C},\quad \text{where}~\overline{Q}_{C}=\frac{\displaystyle \int _{0}^{1}\unicode[STIX]{x1D6EC}(p_{0}^{\prime })Q_{C}(p_{0}^{\prime })\,\text{d}p_{0}^{\prime }}{\displaystyle \int _{0}^{1}\unicode[STIX]{x1D6EC}(p_{0}^{\prime })\,\text{d}p_{0}^{\prime }}. & & \displaystyle\end{eqnarray}$$
An expression for
 $p_{1}$
in terms of known computable quantities follows, namely,
 $$\begin{eqnarray}\displaystyle p_{1}(p_{0})=\frac{Re}{Q_{0}\unicode[STIX]{x1D6EC}(p_{0})}\int _{0}^{p_{0}}\unicode[STIX]{x1D6EC}(p_{0}^{\prime })(\overline{Q}_{C}-Q_{C}(p_{0}^{\prime }))\,\text{d}p_{0}^{\prime }. & & \displaystyle\end{eqnarray}$$
With (3.53) available we readily obtain the correction
 $h_{1}(x,p_{0})$
to the interface as given by (2.29) and (2.30). In addition, substituting (3.53) into expression (3.35) determines the leading-order streamwise velocity
 $w_{1}(x,y,p_{0})$
where it is understood that
 $p_{0}$
and
 $z$
are interchangeable as explained above.
We emphasize that the analysis presented here must be augmented with a series of elliptic two-dimensional cross-sectional problems solved at a discretized set of streamwise nodes. The computational work is described next, and is carried out using domain decomposition and Chebyshev methods that preserve spectral accuracy. An additional complication is the presence of stress singularities at the liquid–gas–solid triple point, and we provide details of our algorithms for treating such points analytically and maintaining spectral accuracy.
4 Numerical methods
As part of our semi-analytical study, several second- and fourth-order two-dimensional partial differential equations (PDEs) are solved numerically at different cross-sections along the three-dimensional microchannel and our general computational approach is described next. The 2-D cross-sectional domain is decomposed into two subdomains separated by a vertical line which passes through the triple contact point, as indicated in figure 3. Likewise, the entire 3-D domain is separated into two subdomains by the vertical plane
 $x=\unicode[STIX]{x1D6FF}$
that passes through the triple contact line.
Diagram indicating how the cross-sectional domain is decomposed into two distinct subdomains.

To facilitate the implementation of spectral Chebyshev discretizations for second-order problems, each subdomain with cross-section 1 and 2 as indicated in figure 3 is transformed to the cubes
 $[-1,1]^{3}$
. The required transformations are denoted by A and B and are detailed in appendix B. They transform the
 $(x,y,z)$
coordinates to
 $(\unicode[STIX]{x1D709}_{i,2},\unicode[STIX]{x1D702}_{i,2},p_{0})$
coordinates (where
 $i$
corresponds to the subdomain and the subscript
 $2$
denotes second-order problems). In each coordinate, we sample
 $N+1$
Chebyshev points to create a three-dimensional grid given by
 $$\begin{eqnarray}\displaystyle (\unicode[STIX]{x1D709}_{i,2}^{(l)},\unicode[STIX]{x1D702}_{i,2}^{(m)},p_{0}^{(n)})=\left[\cos \left(\frac{l\unicode[STIX]{x03C0}}{N}\right),\cos \left(\frac{m\unicode[STIX]{x03C0}}{N}\right),\cos \left(\frac{n\unicode[STIX]{x03C0}}{N}\right)\right]. & & \displaystyle\end{eqnarray}$$
To solve fourth-order problems such as (3.22), we divide the domain as before and use transformations C and D as detailed in appendix B transforming the
 $(x,y)$
coordinates into
 $(\unicode[STIX]{x1D709}_{i,4},\unicode[STIX]{x1D702}_{i,4})$
, adopting the notation introduced above. Note that we do not consider the
 $z$
mapping here, because it is not necessary to take
 $z$
derivatives of the solution of any fourth-order problems. Each subdomain (in 2-D space) is therefore transformed to the square
 $[-\cos (\unicode[STIX]{x03C0}/N),\cos (\unicode[STIX]{x03C0}/N)]\times [-\cos (\unicode[STIX]{x03C0}/N),\cos (\unicode[STIX]{x03C0}/N)]$
. Hence the boundaries of the original domains have been mapped to
 $\unicode[STIX]{x1D709}_{i,4},\unicode[STIX]{x1D702}_{i,4}=\pm \cos (\unicode[STIX]{x03C0}/N)$
, including the division line between subdomains. We then solve the resultant PDEs in
 $[-1,1]\times [-1,1]$
, slightly extending the domain of definition of the solution function. This gives an extra row/column on each side of the Chebyshev grids at which the function value is not important. We use the extra degrees of freedom to impose a second boundary condition on each of the boundaries, without over-determining the discrete problem. As before, we sample
 $N+1$
Chebyshev points in each coordinate in
 $[-1,1]\times [-1,1]$
via
 $$\begin{eqnarray}\displaystyle (\unicode[STIX]{x1D709}_{i,4}^{(l)},\unicode[STIX]{x1D702}_{i,4}^{(m)})=\left[\cos \left(\frac{l\unicode[STIX]{x03C0}}{N}\right),\cos \left(\frac{m\unicode[STIX]{x03C0}}{N}\right)\right]. & & \displaystyle\end{eqnarray}$$
The procedure for solving the PDEs (at a fixed value of
 $p_{0}^{(n)}$
) is as follows. First, we transform the governing equations and boundary conditions (including continuity between subdomains) from
 $(x,y,z)$
coordinates into
 $(\unicode[STIX]{x1D709}_{i,j},\unicode[STIX]{x1D702}_{i,j},p_{0})$
coordinates, where
 $j=2$
or 4. Next we express the discrete approximations to these equations at the Chebyshev grid points, using standard Chebyshev differentiation matrices – see Trefethen (Reference Trefethen2000) for example. The finite set of equations is cast into a matrix problem that was solved using MATLAB’s backslash function. More details of this approach can be found in Game et al. (Reference Game, Hodes, Keaveny and Papageorgiou2017). Throughout this process, we remove stress singularities at the solid–liquid–gas triple point from the numerical problems, and this is found to greatly enhance the numerical convergence of the resulting problems. Such singularity removal has been discussed in the literature for superhydrophobic problems by Nizkaya, Asmolov & Vinogradova (Reference Nizkaya, Asmolov and Vinogradova2014), for example, and also much earlier by Peyret & Taylor (Reference Peyret and Taylor1983) in computational aspects of the Motz problem. To achieve this we require analytical asymptotic expressions for the singular parts of the solutions, and these are derived in appendix C. The method of decomposing the solution into a singular plus a regular part is identical to that described by Game et al. (Reference Game, Hodes, Kirk and Papageorgiou2018), in which the unknown strength of the singularity form is calculated as part of the numerical problem. We make a slight addition to this method where derivatives or integrals of a previously found solution are required (e.g. the computation of
 $w_{0z}$
). In particular, we calculate the derivative or integral of the singular and regular parts of the solution function separately. This is due to accuracy being lost when taking, for instance, the spectral derivative of a function with infinite derivatives. In this way, we require expressions for not only the singularities, but also all of the relevant integrals and derivatives of the singularities as well. All these are also detailed in appendix C.
Hence, after finding solutions to a PDE at each
 $p_{0}^{(n)}$
, relevant quantities such as
 $z$
derivatives of
 $w_{0}$
for example, can be calculated to be used as inhomogeneous terms for later problems (note that this typically requires polynomial interpolation between different coordinate systems). For this particular example we use Chebyshev differentiation matrices in the
 $p_{0}$
direction on the regular part of
 $w_{0}$
according to the transformations detailed in appendix B. Following this, the
 $z$
derivative of the singular part is calculated analytically and added to the numerical derivative of the regular part. Other quantities were calculated in a similar manner.
5 Numerical results
5.1 Three-dimensional flow field, pressure distribution and meniscus shape
We initially provide a sample solution to the full problem, for the chosen parameter values of
 $H=0.5$
,
 $\unicode[STIX]{x1D6E4}=1$
and
 $\unicode[STIX]{x1D6FF}=0.8$
– recall that
 $H$
is the dimensionless microchannel height,
 $\unicode[STIX]{x1D6E4}$
the surface tension parameter (see (2.24) for the definition) and
 $1-\unicode[STIX]{x1D6FF}$
the the solid fraction. The relatively small height and small solid fraction were chosen to make the 3-D effects more pronounced visually. The surface tension parameter
 $\unicode[STIX]{x1D6FE}$
was selected so that the inlet meniscus protrusion angle (in this case
 $53^{\circ }$
) would be physically realizable when using a liquid metal such as Galinstan. Liu et al. (Reference Liu, Sen and Kim2012a
) find that Galinstan has an advancing contact angle
 $\unicode[STIX]{x1D703}_{A}=147^{\circ }$
on silicon nitride, corresponding to a protrusion angle of
 $57^{\circ }$
. Hence our chosen value of
 $\unicode[STIX]{x1D6E4}$
is consistent with maintaining the Cassie state under physically relevant conditions.
In figures 4 and 5 we show the streamwise velocity profiles at zeroth and first orders,
 $w_{0}$
and
 $w_{1}/Re$
, respectively, in the cross-sectional region
 $0<x<\unicode[STIX]{x1D6FF}$
,
 $-H-h_{0}(x,z)<y<0$
and
 $\unicode[STIX]{x1D6FF}<x<1$
,
 $-H<y<0$
, at four streamwise locations
 $z=0$
,
 $1/3$
,
 $2/3$
and
 $1$
. Animated videos of these solutions (as the microchannel is traversed at a constant rate) are provided as supplementary Movie 1 for
 $w_{0}$
available at https://doi.org/10.1017/jfm.2019.366, and supplementary Movie 2 for
 $w_{1}$
. As can be seen from these results, the flow-field structures of
 $w_{0}$
and
 $w_{1}$
are quite similar comprising of a slow flowing region in the vicinity of the solid boundary and a faster moving central core over the meniscus and away from solid boundaries. The reason for this is the fact that the in the solution (3.35) for
 $w_{1}$
, the main contribution comes from
 $w_{C}$
which satisfies a Poisson equation and shares the same boundary conditions as
 $w_{0}$
(compare (3.38)–(3.39) for
 $w_{C}$
with (3.10)–(3.11)). In addition, in contrast to
 $w_{0}$
,
 $w_{1}$
is usually negative because its governing equation has
 $w_{0}w_{0z}$
as its primary forcing, and
 $w_{0z}$
is also usually positive, i.e. the leading-order flow speeds up as we move downstream. In both cases the velocity magnitudes are typically larger towards the end of the microchannel. This is a consequence of a constant flow rate being driven through a smaller channel cross-section as we move downstream and the meniscus becomes flatter and explains why
 $w_{0z}$
is usually positive. We provide results for large ranges of microchannel heights
 $H$
later, but we emphasize that for moderate heights the trends outlined in results presented above are fairly typical in that inertia causes a slowing down of the total streamwise flow and hence a reduction in the total flux (see figure 12 and the discussion pertaining to it).
Contour plots of
 $w_{0}$
for
 $\unicode[STIX]{x1D6E4}=1$
,
 $H=0.5$
,
 $\unicode[STIX]{x1D6FF}=0.8$
, at
 $z=0$
,
 $1/3$
,
 $2/3$
and 1 (from a to d).

Contour plots of the normalized first-order correction
 $w_{1}/Re$
to the streamwise velocity. Other parameters are
 $\unicode[STIX]{x1D6E4}=1$
,
 $H=0.5$
,
 $\unicode[STIX]{x1D6FF}=0.8$
, at
 $z=0$
(a),
 $1/3$
(b),
 $2/3$
(c) and
 $1$
(d).

Contour plots of the spanwise velocity
 $u_{0}$
for
 $\unicode[STIX]{x1D6E4}=1$
,
 $H=0.5$
,
 $\unicode[STIX]{x1D6FF}=0.8$
, at
 $z=0$
(a),
 $1/3$
(b),
 $2/3$
(c) and 1 (d).

Contour plots of the vertical velocity
 $v_{0}$
for
 $\unicode[STIX]{x1D6E4}=1$
,
 $H=0.5$
,
 $\unicode[STIX]{x1D6FF}=0.8$
, at
 $z=0$
(a),
 $1/3$
(b),
 $2/3$
(c) and 1 (d).

Next we consider the behaviour of the spanwise (
 $x$
-direction) and vertical (
 $y$
-direction) velocities,
 $u_{0}$
and
 $v_{0}$
, respectively, for the transverse flow problem in the cross-section. Results are provided in figures 6 and 7 for
 $u_{0}$
and
 $v_{0}$
respectively, for the same geometry and parameters as those in figures 4 and 5. These results are captured for all streamwise locations in supplementary Movie 3 for
 $u_{0}$
, and supplementary Movie 4 for
 $v_{0}$
. Additionally, Figure 8 provides contour plots of the transverse flow field, where the colour map indicates the transverse flow speed
 $\sqrt{u_{0}^{2}+v_{0}^{2}}$
, whereas the contours indicate the transverse flow direction, that is the tangents of the contours are in the direction of the vector
 $(u_{0},v_{0})$
. Note that the contours are not streamlines in the sense that they are not lines of constant
 $\unicode[STIX]{x1D713}$
as defined in (3.19). In all 3 figures’ results are, again, given at streamwise locations
 $z=0$
,
 $1/3$
,
 $2/3$
and
 $1$
. It can be observed that larger transverse velocities are attained towards the end of the microchannel – for example the maximum values roughly double as we move from
 $z=1/3$
to
 $z=1$
, as can be seen from figures 6 and 7. This increase is due to the larger values of
 $w_{0}$
and
 $w_{0z}$
that force the system for
 $\unicode[STIX]{x1D713}$
– see (3.19) for the definition of the transverse velocities in terms of the modified streamfunction
 $\unicode[STIX]{x1D713}$
, and (3.22)–(3.23) for the equation and boundary conditions it satisfies. The results can also be used to identify where in the 3-D geometry the transverse velocities attain maximum values. Inspection of figure 7 indicates that the maximum value of
 $v_{0}$
is achieved on the meniscus at
 $x=0$
and for all streamwise values
 $z$
. This is due to kinematic boundary condition (2.20). Since
 $h_{0x}=0$
at
 $x=0$
and
 $-h_{0z}$
and
 $w_{0}$
are at local maxima at
 $x=0$
, the maximum value of
 $v_{0}$
on the meniscus must also be here. Turning next to the streamwise velocity
 $u_{0}$
and the results of figure 6, it can be seen that a maximum value of
 $u_{0}$
is achieved close to the middle (
 $x\approx 0.5$
) of the microchannel centreline (
 $y=0$
). This is largely due to transverse velocities induced at the meniscus being forced in the positive
 $x$
direction by the centreline and the symmetry line conditions at
 $x=0$
. The point in the middle of the centreline is furthest (in
 $y$
) from the solid ridge that provides the source of friction, and furthest (in
 $x$
) from the symmetry lines
 $x=0,1$
which force
 $u_{0}$
to become zero by symmetry.
Contour plots illustrating the transverse flow field
 $(u_{0},v_{0})$
. The colour map indicates the transverse flow speed,
 $\sqrt{u_{0}^{2}+v_{0}^{2}}$
, whereas the contours indicate the transverse flow direction, i.e. tangents to the contours are in the direction of the vector
 $(u_{0},v_{0})$
. Note that the contours are not streamlines – they are not lines of constant
 $\unicode[STIX]{x1D713}$
, as defined in equation (3.19). Results are depicted at streamwise locations
 $z=0$
(a),
 $z=1/3$
(b),
 $z=2/3$
(c) and
 $z=1$
(d) for
 $\unicode[STIX]{x1D6E4}=1$
,
 $H=0.5$
and
 $\unicode[STIX]{x1D6FF}=0.8$
.

Plots of (a)
 $p_{0}(z)$
and (b)
 $p_{1}(z)/Re$
for
 $\unicode[STIX]{x1D6E4}=1$
,
 $H=0.5$
,
 $\unicode[STIX]{x1D6FF}=0.8$
. In (a) we also plot
 $(1-z)$
against
 $z$
as a dotted line to facilitate comparison with a constant pressure gradient.

Figure 9 gives the calculated pressure at zeroth and first orders as a function of the streamwise position
 $z$
for the parameters used earlier, namely a microchannel of height
 $H=0.5$
,
 $\unicode[STIX]{x1D6FF}=0.8$
and
 $\unicode[STIX]{x1D6E4}=1$
. Note that since
 $p_{0}$
and
 $p_{1}$
are independent of the cross-sectional coordinates
 $x$
and
 $y$
, they can be represented as curves of a single variable
 $z$
as shown. In figure 9(a), we also superimpose the dotted line
 $(1-z)$
which represents a linear pressure variation for a unit pressure drop. As this figure shows, even for a case in which three-dimensional effects are inflated (small
 $H$
and
 $\unicode[STIX]{x1D6FF}$
approaching 1), we see very little deviation in
 $p_{0}$
from the linear pressure field case. This is a result of the limited variation in the quantity
 $\widetilde{Q}_{0}$
(see (3.15)) along the microchannel, which itself is a result of the relatively minor influence of meniscus curvature on the 2-D problem with a constant pressure gradient. We find that the deviation in
 $p_{0}$
is even smaller as
 $H$
increases, but as discussed later in the context of figure 12(b), this is the scenario when we see the largest correction in flow rate. Hence, the deflection (or lack thereof) of the zeroth-order pressure field from linear is not predictive of the overall significance of three-dimensional effects. Correspondingly, figure 9(b) shows that the values of the perturbation pressure
 $p_{1}$
we achieve for
 $H=0.5$
are numerically small and of maximum magnitude
 ${<}10^{-2}$
. This does not imply small values of
 $w_{1}$
, however. Inspection of (2.16b
) (equivalently (3.34)) indicates that
 $w_{1}$
is driven by the first-order pressure gradient
 $p_{1z}$
and the inertial terms involving leading-order velocities. The main inertial contribution comes from
 $w_{0}w_{0z}$
. The reason for this is that we find computationally that
 $u_{0}(x,y,z)\approx 0$
and
 $v_{0}(x,y,z)\approx \int _{y}^{0}w_{0z}(x,y^{\prime },z)dy^{\prime }$
are excellent approximations (see (5.2)), and consequently even when the term
 $v_{0}w_{0y}$
is not small relative to
 $w_{0}w_{0z}$
, its sign follows that of
 $w_{0}w_{0z}$
(note that
 $w_{0y}$
is non-negative). We conclude, therefore, that if
 $w_{0}w_{0z}$
is positive/negative it acts like a adverse/favourable pressure gradient thus decreasing or increasing
 $w_{1}$
. If at the same time
 $p_{1z}$
is small even though it can be adverse over more than 70 % of the microchannel length as is the case in figure 9, then since
 $w_{0}$
is non-negative it is the sign of
 $w_{0z}$
that controls whether the correction
 $Q_{1}$
to the flux is positive or negative. This physical reasoning helps explain our computational findings, namely for small and moderate heights
 $H$
we obtain
 $Q_{1}<0$
and hence a reduction in the overall flow rate – fluxes are discussed in detail later, but see figure 12(b) for cases having
 $Q_{1}<0$
when
 $H\lessapprox 7$
. It remains to explain physically the origin of positive values of
 $w_{0z}>0$
, the leading-order streamwise velocity gradient, generally implying an increase in
 $w_{0}$
along the microchannel leading to an inertia-induced reduction of the overall flow rate when
 $H$
is sufficiently small. The increase in
 $w_{0}$
can be seen from figure 4 as we move down the microchannel, but also more explicitly in figure 13(b), discussed in detail later, that shows
 $w_{0z}$
at different streamwise locations for
 $H=6$
. As we move down the microchannel the meniscus becomes flatter and hence the cross-sectional area decreases. If we were dealing with no-slip boundaries then the conclusion that the velocity increases is immediate. In the presence of slip, however, there is a competition between the decrease in cross-sectional area and the effect of apparent slip as the meniscus flattens towards the end of the microchannel. For sufficiently small
 $H$
the former mechanism dominates and the streamwise velocity increases due to cross-sectional area decrease – see also the 2-D computations by Game et al. (Reference Game, Hodes, Keaveny and Papageorgiou2017) and the asymptotic study for small meniscus curvatures by Kirk, Hodes & Papageorgiou (Reference Kirk, Hodes and Papageorgiou2017). We also note that one can achieve significant values of
 $p_{1}$
at the larger values of
 $H$
in the regime discussed here, as shown in figure 10 for
 $\unicode[STIX]{x1D6FF}=0.8$
and
 $H=6$
or
 $H=10$
. In contrast to the pressure correction
 $p_{1}$
corresponding to the smaller
 $H=0.5$
case shown in figure 9(b), we note that in addition to larger values, the pressure gradient
 $p_{1z}$
is now favourable over about
 $0.4$
units from entry before becoming adverse over the latter section of the microchannel. However, the inertial terms also see a corresponding increase in magnitude;
 $w_{0z}$
decreases as
 $H$
increases, but this is more than offset by the increase in
 $w_{0}$
. Hence, the relative significance of inertia and
 $p_{1}$
on
 $w_{1}$
is left unchanged as compared to smaller
 $H$
microchannels, and the overall effect is for
 $Q_{1}$
to remain negative for
 $H$
less than 8 approximately, as seen in figure 12(b). At larger
 $H$
we find that
 $Q_{1}$
becomes positive and the physical mechanism behind this is discussed and explained later in § 5.2 where the flow field is also interrogated in more detail.
Plots of
 $p_{1}(z)/Re$
for larger microchannel heights:
 $H=6$
(solid), and
 $H=10$
(dotted). Other parameters are
 $\unicode[STIX]{x1D6E4}=1$
,
 $\unicode[STIX]{x1D6FF}=0.8$
.

Next we turn to the shape of the meniscus as we traverse the microchannel. As explained in § 2.2, the position of the meniscus, defined by
 $y=-H-h(x,z)=-H-h_{0}(x,z)-\unicode[STIX]{x1D716}h_{1}(x,z)+\cdots \!,$
is found as part of the asymptotic solution procedure. The leading-order term
 $h_{0}(x,z)$
is given by the expression (2.25) which is a circular arc of changing radius
 $\unicode[STIX]{x1D6E4}/p_{0}(z)$
. Hence, furnished with
 $p_{0}(z)$
computed numerically as described earlier, the leading-order shape is completely determined. In figure 11 we provide the first-order correction
 $h_{1}(x,z)$
to
 $h$
in order to identify any significant deviations from the leading-order form – the solution for
 $h_{1}$
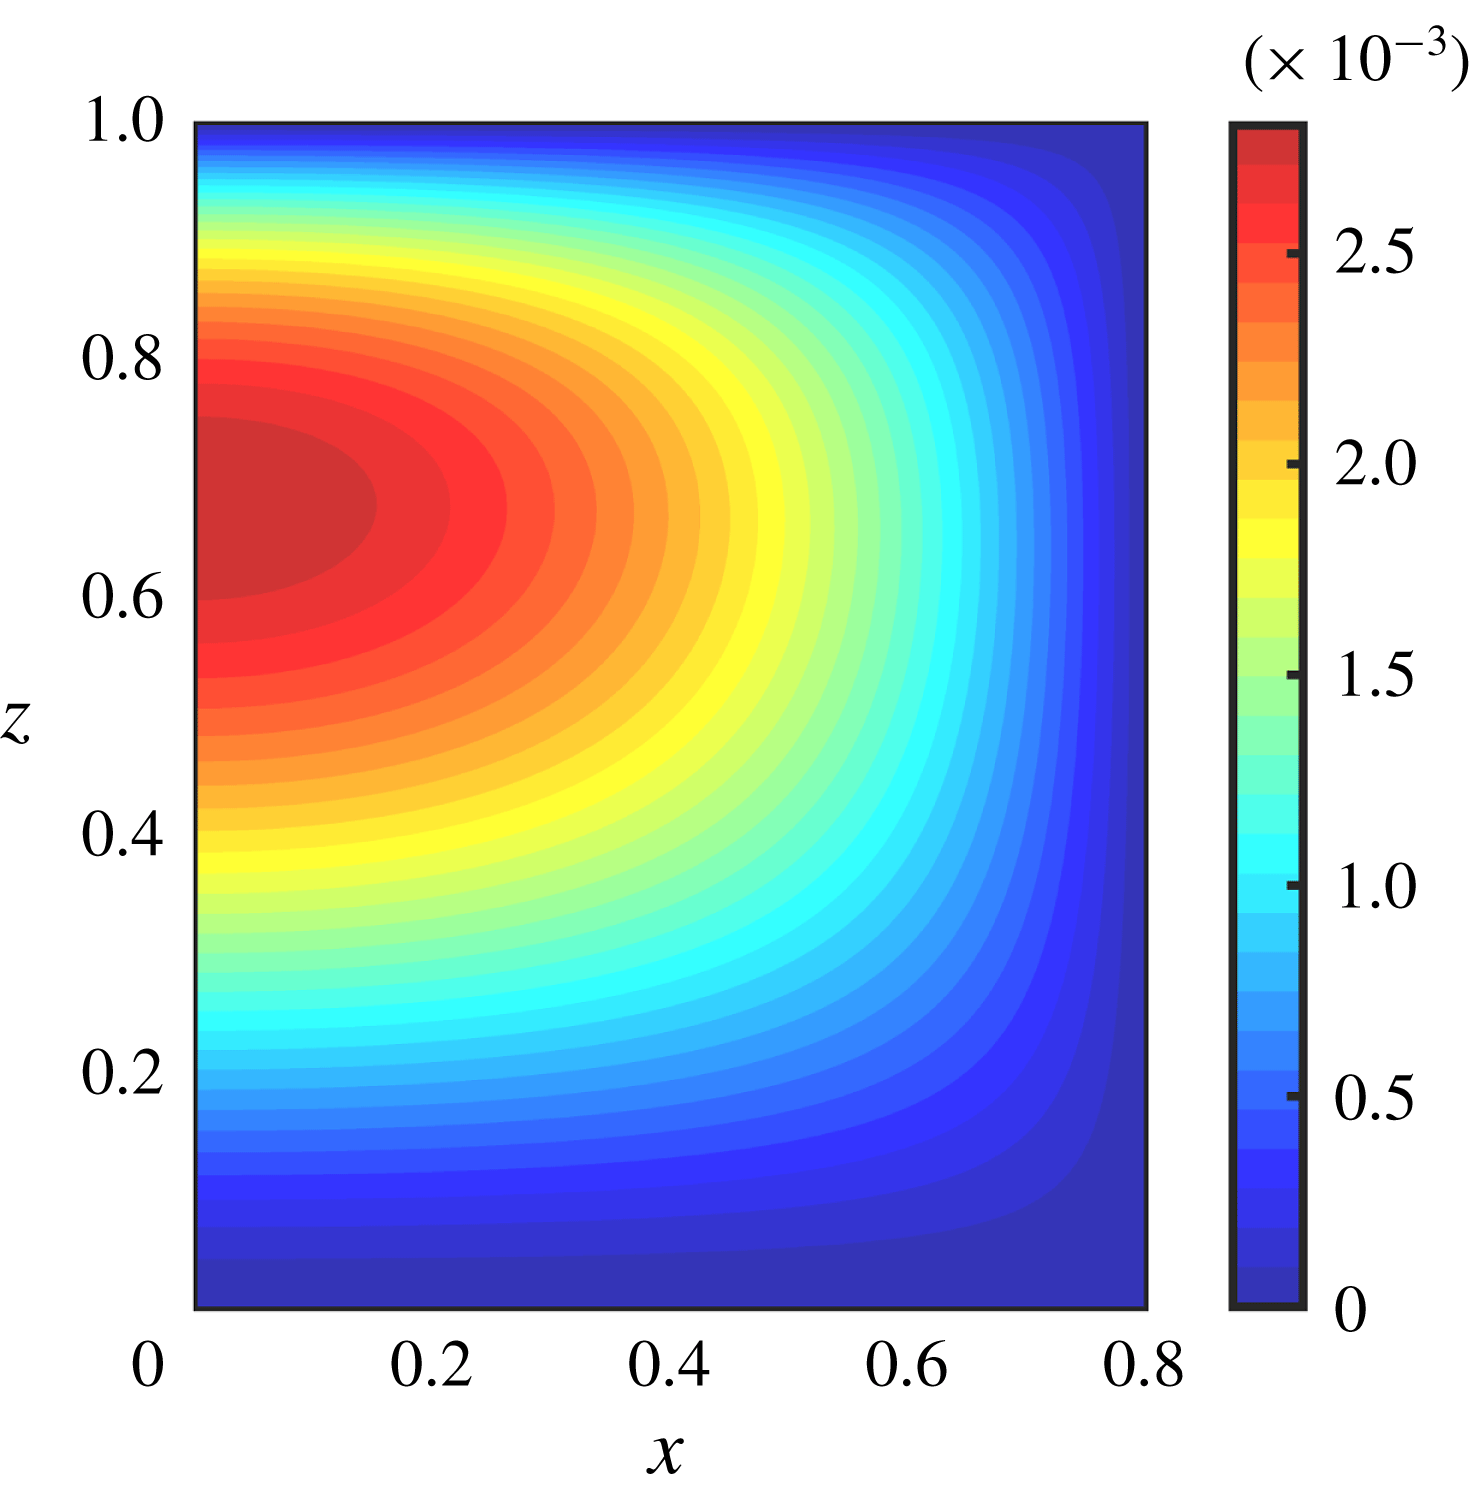
is given by equations (2.29)–(2.30). Since the meniscus shape is a quantity that varies only in the intervals
 $0<x<\unicode[STIX]{x1D6FF}$
and
 $0<z<1$
, we can display
 $h_{1}(x,z)$
as a two-dimensional contour plot as seen in figure 11. The relatively small values achieved (less than
 $3\times 10^{-3}$
) are a direct consequence of the relatively small values of
 $p_{1}$
observed in figure 9(b) – see solution (2.29) which tells us that
 $h_{1}$
depends linearly on
 $p_{1}$
. It is of note that the perturbations to
 $h$
are such that both
 $h_{0}$
and
 $h_{0}+\unicode[STIX]{x1D716}h_{1}$
represent circular arcs (up to an error of
 $O(\unicode[STIX]{x1D716}^{2})$
). This is a consequence of the application of the Young–Laplace equation with constant (in each cross-section) pressure fields
 $p_{0}$
and
 $p_{0}+\unicode[STIX]{x1D716}p_{1}$
, respectively. Further inspection of figure 11 shows that the largest values of
 $h_{1}$
are in the vicinity of
 $x\sim 0$
, i.e. the meniscus centre, which might be expected as larger values of
 $h_{0}$
are achieved here. The overall maximum of
 $h_{1}$
is seen at a streamwise location of around
 $z=0.7$
, which corresponds to the maximum in
 $p_{1}$
found in figure 9(b). Physically, then, the correction
 $h_{1}$
will cause a local depression in the vicinity of
 $x\approx 0$
,
 $z\approx 0.7$
, something that could be of interest to experimentalists.
Contour plot of the first-order correction
 $h_{1}(x,z)$
to the meniscus shape for
 $\unicode[STIX]{x1D6E4}=1$
,
 $H=0.5$
,
 $\unicode[STIX]{x1D6FF}=0.8$
.
5.2 Overall flow rates and the effects of inertia
The results of § 5.1 provided details of the flow-field, pressure distribution and meniscus shape up to two terms in the asymptotic expansion, hence yielding results correct to
 $O(\unicode[STIX]{x1D716}^{2})$
. To illustrate matters attention was focussed on one microchannel geometry having
 $H=0.5$
,
 $\unicode[STIX]{x1D6FF}=0.8$
and dimensionless surface tension
 $\unicode[STIX]{x1D6E4}=1$
. In this section we consider large ranges of
 $H$
,
 $\unicode[STIX]{x1D6FF}$
and
 $\unicode[STIX]{x1D6E4}$
and calculate their effect on the leading-order flow rate
 $Q_{0}$
and the scaled first-order correction
 $Q_{1}/(Re\,Q_{0})$
that introduces the effects of inertia. Recall that
 $Q=Q_{0}+\unicode[STIX]{x1D716}Q_{1}+\cdots \,$
, and expressions for
 $Q_{0}$
and
 $Q_{1}$
have been derived in (3.7) (equivalently (3.17)) and (3.8) (equivalently (3.52)), respectively, and calculated using quadratures once the leading-order and first-order quantities are determined. The Reynolds number
 $Re$
is included on the denominator of the quantity
 $Q_{1}/(Re\,Q_{0})$
because
 $Q_{1}$
is proportional to
 $Re$
– see (3.52). We can multiply with a given value of
 $Re$
to obtain the appropriate first-order flow rate as needed.
Before presenting results from the computations, we introduce two approximations to
 $Q_{0}$
and
 $Q_{1}$
denoted by
 $Q_{0}^{(approx)}$
and
 $Q_{1}^{(approx)}$
, respectively. Our motivation stems from the question of whether the flow rates constructed using 3-D effects (albeit for the slowly varying case) can be approximated well using computations of 2-D equations, i.e. Poisson solvers that avoid the need for computing transverse flow quantities as for example
 $u_{0}$
and
 $v_{0}$
. Mathematically this simplification avoids solving biharmonic equations for the modified streamfunction
 $\unicode[STIX]{x1D713}$
– see (3.19) and (3.22) – allied with singularity removal techniques for fourth-order problems as described in § C.3.
We begin with the approximation of
 $Q_{0}$
defined by
 $$\begin{eqnarray}\displaystyle Q_{0}^{(approx)}=\widetilde{Q}_{0}(p_{0}=1/2), & & \displaystyle\end{eqnarray}$$
where
 $Q_{0}$
is given as a function of
 $p_{0}$
in (3.15). Instead of the exact form (3.17) for
 $Q_{0}$
, we approximate the integrand
 $\widetilde{Q}_{0}$
by its value in the middle of the
 $p_{0}$
-domain, i.e. at
 $p_{0}=1/2$
, leading to the (5.1). Note that this is exactly the two-dimensional approximation that assumes a constant pressure gradient, with the meniscus protrusion angle chosen to be that corresponding to the pressure midway between inlet and outlet pressures. Next, we define
 $Q_{1}^{(approx)}$
in the same way as
 $Q_{1}$
given by (3.8) or equivalently by (3.52), except that during the calculation process of
 $w_{C}$
via (3.38) we use the following approximations for the transverse velocities
 $u_{0}$
and
 $v_{0}$
 $$\begin{eqnarray}\displaystyle u_{0}(x,y,z)\approx u_{0}^{(approx)}(x,y,z)=0,\quad v_{0}(x,y,z)\approx v_{0}^{(approx)}(x,y,z)=\int _{y}^{0}w_{0z}(x,y^{\prime },z)\,\text{d}y^{\prime }. & & \displaystyle \nonumber\\ \displaystyle & & \displaystyle\end{eqnarray}$$
Specifically, to calculate
 $w_{C}$
we substitute (5.2) for
 $u_{0}$
and
 $v_{0}$
into (3.38) and use the result to calculate
 $Q_{1}$
(now named
 $Q_{1}^{(approx)}$
) as before. We anticipate this to be a good approximation as we expect
 $\unicode[STIX]{x1D713}$
to be numerically small globally (as indeed confirmed a posteriori from the full computations). The reason for this is that
 $\unicode[STIX]{x1D713}$
, as defined by (3.19) and satisfying the biharmonic equation (3.22) and relevant boundary conditions given in § 3.3, has
 $\unicode[STIX]{x1D713}=0$
imposed by boundary conditions on three sides of the domain.
(a) The zeroth-order flow rate
 $Q_{0}$
and (b) the first-order flow-rate correction metric
 $Q_{1}/(ReQ_{0})$
plotted against
 $H$
for the indicated values of the liquid fraction
 $\unicode[STIX]{x1D6FF}$
and
 $\unicode[STIX]{x1D6FE}=1.2$
. In both cases dotted lines represent the corresponding approximate values
 $Q_{0}^{(approx)}$
and
 $Q_{1}^{(approx)}$
. Note that in both cases, but particularly in (a), the dotted lines are not easily visible due to very good agreement.

We begin by presenting results for
 $Q_{0}$
and
 $Q_{1}/(ReQ_{0})$
for a wide range of dimensionless microchannel heights
 $H$
describing narrow microchannels all the way to relatively high microchannels having
 $H=10$
. The results given in figure 12 were computed for
 $\unicode[STIX]{x1D6FF}=0.7,0.8,0.9$
, i.e. half-ridge lengths of 0.3, 0.2 and 0.1, respectively. The surface tension parameter is
 $\unicode[STIX]{x1D6E4}=1.2$
. The leading-order flow rate
 $Q_{0}$
is given in figure 12(a) and the correction
 $Q_{1}/(ReQ_{0})$
is included in figure 12(b). For each value of
 $\unicode[STIX]{x1D6FF}$
we also superimpose with dotted curves, the approximations
 $Q_{0}^{approx}$
and
 $Q_{1}^{approx}$
given above. The accuracy of such approximations is remarkable for the given range of
 $H$
, and this finding can have implications for practitioners. Firstly, the success of
 $Q_{0}^{(approx)}$
implies that for problems where inertial effects do not need to be considered, the technical details of the slowly varying approximation results do not need to be accounted for. A practitioner can simply take the midpoint of the inlet and outlet pressures, and compute the two-dimensional problem at this pressure. Secondly, the success of
 $Q_{1}^{(approx)}$
indicates that the most difficult and time-consuming part of the implementation of the methodology (solving the cross-flow problem) is often unnecessary for good accuracy. In fact, the implementation of this approximation will only require the solutions to a sequence of second-order problems. It also means that significant progress may be made in finding analytical solutions, as the fourth-order problem would have been the most significant barrier to this. We expect there to be a formal way to quantify the strength of these approximations using asymptotic analysis (with
 $H$
as a large parameter) as carried out in related problems, see Crowdy (Reference Crowdy2016), D. G. Crowdy (private communication, 2017), Kirk et al. (Reference Kirk, Hodes and Papageorgiou2017), Kirk (Reference Kirk2018).
The overall trends of the results for the leading-order flow rate
 $Q_{0}$
shown in figure 12(a) are as expected, namely smaller width ridges produce larger flow rates due to reduced flow resistance. The results also show that this is valid for all values of
 $H$
with the curve for
 $\unicode[STIX]{x1D6FF}=0.9$
yielding the highest values and
 $\unicode[STIX]{x1D6FF}=0.7$
the lowest ones. In addition, as expected
 $Q_{0}$
is monotonically increasing with
 $H$
for all values of
 $\unicode[STIX]{x1D6FF}$
computed.
(a) The first-order velocity
 $w_{1}$
and (b) the leading-order velocity gradient
 $w_{0z}$
, plotted at
 $z=0,1/4,1/2,1$
(left to right). Other parameters are
 $\unicode[STIX]{x1D6FF}=0.8$
,
 $H=6$
.

Figure 12(b) also illustrates that
 $Q_{1}$
is more sensitive to
 $\unicode[STIX]{x1D6FF}$
as compared to
 $Q_{0}$
. The results also show that the behaviour of
 $Q_{1}$
with
 $H$
is non-monotonic with a negative minimum being attained at
 $H\approx 6$
. As explained in § 5.1, the correction
 $Q_{1}$
is negative for small and moderate values of
 $H$
mainly due to inertial terms and in particular
 $w_{0}w_{0z}$
being relatively large and positive compared to the other inertial terms and the correction
 $p_{1z}$
of the pressure gradient. Figure 12(b) also shows that at large values of
 $H$
it is possible to obtain positive values of
 $Q_{1}$
, implying flow-rate enhancement due to inertial effects. For example,
 $Q_{1}$
becomes positive for
 $H$
larger than approximately
 $7.7$
,
 $8.6$
or
 $9.5$
, for ridges characterized by
 $\unicode[STIX]{x1D6FF}=0.7$
,
 $0.8$
and
 $0.9$
, respectively. A physical explanation can be given both for the sign of
 $Q_{1}$
in this regime as well as the requirement of larger
 $H$
as
 $\unicode[STIX]{x1D6FF}$
increases and the ridge width decreases. For large
 $H$
the decrease in area towards the end of the microchannel becomes insignificant compared to the enhancement in slip length due to the flattening meniscus – see Game et al. (Reference Game, Hodes, Keaveny and Papageorgiou2017), Kirk et al. (Reference Kirk, Hodes and Papageorgiou2017), for example. This slip enhancement in turn enables the leading-order flow
 $w_{0}$
to decrease towards the centre of the microchannel to maintain a constant flow rate. This causes
 $w_{0z}$
to be negative in the centre of the microchannel away from boundaries, and hence the main inertial contribution
 $w_{0}w_{0z}$
is negative over a large region of the cross-section and acts as a favourable pressure gradient – see (3.34) and the relevant discussion in § 5.1. This then causes
 $w_{1}$
to become positive towards the centreline and once
 $w_{1}$
is positive over a sufficiently large part of the microchannel, the quantity
 $Q_{1}$
also becomes positive. For completeness, and to quantify the physical explanation given above, we provide numerical results of the streamwise velocity correction
 $w_{1}$
and the key quantity
 $w_{0z}$
, for a value of
 $\unicode[STIX]{x1D6FF}=0.8$
and two values of
 $H=6$
and
 $H=10$
– these results correspond to the middle curve in figure 12(b) with
 $H=6$
predicting a flow-rate decrease since
 $Q_{1}<0$
then, and
 $H=10$
corresponding to an increase in flow rate since
 $Q_{1}>0$
. Results for
 $H=6$
are depicted in figure 13 at the streamwise locations
 $z=0,1/4,1/2,1$
, with
 $w_{1}$
and
 $w_{0z}$
shown in figures 13(a) and 13(b), respectively. The results show that
 $w_{1}$
is mostly negative and
 $w_{0z}$
is mostly positive in the different cross-sections, explaining the negative value of
 $Q_{1}$
and hence the decrease in overall flow rate. The situation is the opposite when
 $H=10$
as shown in figure 14, with
 $w_{1}$
having large positive velocities in the majority of the microchannel driven by negative values of
 $w_{0z}$
.
(a) The first-order velocity
 $w_{1}$
and (b) the leading-order velocity gradient
 $w_{0z}$
, plotted at
 $z=0,1/4,1/2,1$
(left to right). Other parameters are
 $\unicode[STIX]{x1D6FF}=0.8$
,
 $H=10$
.

Finally, in figure 15, we provide a more complete exploration of the parameter space, giving
 $Q_{1}/(ReQ_{0})$
as all three parameters
 $\unicode[STIX]{x1D6FF},H$
and
 $\unicode[STIX]{x1D6E4}$
vary in the ranges
 $0.5\leqslant \unicode[STIX]{x1D6FF}\leqslant 0.9$
,
 $0.5\leqslant H\leqslant 4$
and
 $1\leqslant \unicode[STIX]{x1D6E4}\leqslant 2$
. It is noteworthy that
 $Q_{1}$
becomes more negative for smaller
 $\unicode[STIX]{x1D6E4}$
, as can be seen by fixing
 $\unicode[STIX]{x1D6FF}$
in any of the figures and reducing the value of
 $\unicode[STIX]{x1D6E4}$
. This is quite intuitive since smaller
 $\unicode[STIX]{x1D6E4}$
leads to a larger inlet meniscus curvature and therefore enhanced three-dimensional effects. Similarly, increasing
 $\unicode[STIX]{x1D6FF}$
for a fixed
 $\unicode[STIX]{x1D6E4}$
also enhances the three-dimensional effects, which in turn causes
 $Q_{1}$
to become more negative.
Contour plots of
 $Q_{1}/(ReQ_{0})$
against
 $\unicode[STIX]{x1D6E4}$
and
 $\unicode[STIX]{x1D6FF}$
for the indicated values of
 $H$
.

6 Conclusions
We have developed a hybrid asymptotic/numerical method to accurately compute the velocity field through a microchannel textured with periodic longitudinal grooves that support a slowly varying meniscus protrusion when the flow is driven by a given pressure drop across the microchannel. We assume that the pressure at the microchannel outlet is the ambient one, hence the meniscus is highly curved at entry and flat at the end of the microchannel. No assumptions are made on the size of the meniscus curvature. Using the ratio of the groove pitch to groove length as a small parameter
 $\unicode[STIX]{x1D716}=P/L$
, and assuming order-one Reynolds numbers, we developed systematic asymptotic expansions that enable us to calculate the leading-order streamwise and transverse velocity fields along with the first-order streamwise field. Our hybrid asymptotic/numerical methodology represents a useful alternative approach to solving the full 3-D Navier–Stokes equations in an evolving geometry where the liquid–gas interface that is in the Cassie state needs to be found as part of the solution by satisfying nonlinear interfacial conditions arising from stress balances.
The resulting flow rate
 $Q$
at steady laminar conditions is considered in detail and our asymptotic solution yields
 $Q=Q_{0}+\unicode[STIX]{x1D716}Q_{1}+\cdots \,$
, where
 $Q_{0}$
and
 $Q_{1}$
are functions of the cavity fraction
 $\unicode[STIX]{x1D6FF}$
, the dimensionless surface tension
 $\unicode[STIX]{x1D6E4}$
and the dimensionless microchannel height
 $H$
(non-dimensionalization sets the pitch to unity). The first-order flow rate
 $Q_{0}$
is the result of the leading-order, slowly varying streamwise velocity and pressure, whereas the correction
 $Q_{1}$
has contributions due to inertia and the secondary flow in the slowly varying microchannel cross-section. Typical computed flow fields are given for different microchannel heights ranging from small,
 $H=0.5$
, to large
 $H=10$
, and ranges of cavity fractions
 $\unicode[STIX]{x1D6FF}$
and surface tension parameter
 $\unicode[STIX]{x1D6E4}$
of practical relevance. In addition, the flow rates
 $Q_{0}$
and
 $Q_{1}$
are calculated and presented for a wide range of flow conditions. We note that while the pressure field does not deviate much from the standard linear profile, the slowly varying geometry is of fundamental importance to the transverse flow and first-order velocity field. As expected
 $Q_{0}$
is always positive with larger values, for all
 $H$
, as
 $\unicode[STIX]{x1D6FF}$
increases so that the ridge size gets smaller – see figure 12(a). In contrast, we find that the first-order correction
 $Q_{1}$
is negative for small to moderate heights implying that inertial effects reduce the overall flow rate. For microchannel heights above a critical value,
 $H_{c}$
say,
 $Q_{1}$
is positive hence inducing inertia-induced enhancement of the overall flow rate. The value of
 $H_{c}$
depends on the cavity fraction
 $\unicode[STIX]{x1D6FF}$
as well as the surface tension
 $\unicode[STIX]{x1D6E4}$
, and for fixed
 $\unicode[STIX]{x1D6E4}$
(as in the results of figure 12
b),
 $H_{c}$
increases as
 $\unicode[STIX]{x1D6FF}$
increases, i.e. larger heights are needed to counteract the flow-rate reduction due to inertia. The physical origin of these phenomena (discussed in detail in § 5.2) are linked to a competition between the decrease of the microchannel cross-section as the meniscus flattens towards the microchannel end, with velocity modifications there due to apparent slip effects. For small to moderate heights apparent slip is sub-dominant and area decrease effects dominate and induce an increase in the leading-order streamwise velocity
 $w_{0}$
(crucially
 $w_{0z}$
is mostly positive towards the end of the microchannel). At large enough heights, however, the area decrease is not as important as apparent slip effects that modify
 $w_{0}$
so that the constant flux
 $Q_{0}$
can be attained with smaller maximum streamwise velocities. As a result
 $w_{0z}$
is mostly negative and the inertial forcing
 $w_{0}w_{0z}$
to the first-order streamwise velocity correction
 $w_{1}$
, acts as a favourable pressure gradient yielding
 $Q_{1}>0$
. Interestingly, as seen in figure 12(b) for instance, for given parameters
 $\unicode[STIX]{x1D6FF}$
and
 $\unicode[STIX]{x1D6E4}$
, there is a local (and indeed global) minimum negative value of
 $Q_{1}$
at some
 $H$
, where inertia exerts its most adverse effect on the reduction of the overall flow rate, at least within the context of our asymptotic analysis. It would be interesting to evaluate such findings with direct numerical simulations in the future.
Extensive computations were used to establish some highly accurate simplifying approximations in the calculation of the flow field at leading and first orders, as detailed in (5.1)–(5.2) and the discussion there. The accuracy of such approximations in capturing the flow rates
 $Q_{0}$
and
 $Q_{1}$
over all ranges of parameters studied is excellent – see the results of figure 12. As seen from (5.2) such simplifications make it unnecessary to solve for the transverse flow field, rendering the entire computational problem easier since we avoid biharmonic equations such as (3.22) with stick-slip boundary conditions that require more intricate singularity removal computational techniques as outlined in appendix C. As a consequence, the approximations can be useful to practitioners and notably for low Reynolds number problems where the flow rate is accurately given by the approximation (5.1) requiring solution of a parallel flow problem governed by a single Poisson equation.
Acknowledgements
S.G. was supported by an Imperial College President’s Scholarship. M.H. was supported in part by NSF grant no. 1402783, and D.T.P. was supported in part by EPSRC grant EP/L020564.
Supplementary movies
Supplementary movies are available at https://doi.org/10.1017/jfm.2019.366.
Appendix A. Stress conditions
Stress balances are applied at the liquid gas interface
 $y=-h$
, which in dimensionless terms and utilizing the expansions (2.13b
) reads
 $y=-H-h_{0}-\unicode[STIX]{x1D700}h_{1}+\cdots \,$
. First we calculate
 $$\begin{eqnarray}\displaystyle \unicode[STIX]{x1D748}\boldsymbol{n}^{T}=\frac{1}{\sqrt{1+h_{x}^{2}+h_{z}^{2}}}\left(\begin{array}{@{}c@{}}(-p+2\unicode[STIX]{x1D707}u_{x})h_{x}+\unicode[STIX]{x1D707}(u_{y}+v_{x})+\unicode[STIX]{x1D707}(u_{z}+w_{x})h_{z}\\ \unicode[STIX]{x1D707}(u_{y}+v_{x})h_{x}+(-p+2\unicode[STIX]{x1D707}v_{y})+\unicode[STIX]{x1D707}(v_{z}+w_{y})h_{z}\\ \unicode[STIX]{x1D707}(u_{z}+w_{x})h_{x}+\unicode[STIX]{x1D707}(v_{z}+w_{y})+(-p+2\unicode[STIX]{x1D707}w_{z})h_{z}\end{array}\right). & & \displaystyle\end{eqnarray}$$
The three boundary conditions we will derive are
 $\boldsymbol{t}_{1}\unicode[STIX]{x1D748}\boldsymbol{n}^{T}=0$
,
 $\boldsymbol{t}_{2}\unicode[STIX]{x1D748}\boldsymbol{n}^{T}=0$
and
 $\boldsymbol{n}\unicode[STIX]{x1D748}\boldsymbol{n}^{T}+p^{(0)}=\unicode[STIX]{x1D6FE}\unicode[STIX]{x1D705}$
. Using (A 1) and the expressions (2.18), the first tangential stress balance becomes
 $$\begin{eqnarray}\displaystyle \unicode[STIX]{x1D707}[2u_{x}h_{x}+(u_{y}+v_{x})(1-h_{x}^{2})+(u_{z}+w_{x})h_{z}-2v_{y}h_{x}-(v_{z}+w_{y})h_{z}h_{x}]=0, & & \displaystyle\end{eqnarray}$$
and in dimensionless form (using (2.10)–(2.11))
 $$\begin{eqnarray}\displaystyle 2u_{x}h_{x}+(u_{y}+v_{x})(1-h_{x}^{2})+(\unicode[STIX]{x1D700}^{2}u_{z}+w_{x})h_{z}-2v_{y}h_{x}-(\unicode[STIX]{x1D700}^{2}v_{z}+w_{y})h_{z}h_{x}=0. & & \displaystyle\end{eqnarray}$$
The leading-order condition (2.21) follows readily.
The second zero shear stress condition
 $\boldsymbol{t}_{2}\unicode[STIX]{x1D748}\boldsymbol{n}^{T}=0$
reads
 $$\begin{eqnarray}\displaystyle \unicode[STIX]{x1D707}[-(u_{y}+v_{x})h_{x}h_{z}-2v_{y}h_{z}+(u_{z}+w_{x})h_{x}+(v_{z}+w_{y})(1-h_{z}^{2})+2w_{z}h_{z}]=0, & & \displaystyle\end{eqnarray}$$
and non-dimensionalizing we find
 $$\begin{eqnarray}\displaystyle -\unicode[STIX]{x1D700}^{2}(u_{y}+v_{x})h_{x}h_{z}-2\unicode[STIX]{x1D700}^{2}h_{z}v_{y}+(\unicode[STIX]{x1D700}^{2}u_{z}+w_{x})h_{x}+(\unicode[STIX]{x1D700}^{2}v_{z}+w_{y})(1-\unicode[STIX]{x1D700}^{2}h_{z}^{2})+2\unicode[STIX]{x1D700}^{2}h_{z}w_{z}=0, & & \displaystyle \nonumber\\ \displaystyle & & \displaystyle\end{eqnarray}$$
also to be evaluated at
 $y=-H-h_{0}-\unicode[STIX]{x1D700}h_{1}+\cdots \,$
. At leading and first order we find (2.22) and (2.23), respectively, the latter requiring a Taylor expansion of dependent variables about
 $y=-H-h_{0}$
.
Finally, the normal stress balance condition
 $\boldsymbol{n}\unicode[STIX]{x1D748}\boldsymbol{n}^{T}+p^{(0)}+\unicode[STIX]{x1D6FE}\unicode[STIX]{x1D705}=0$
becomes
 $$\begin{eqnarray}\displaystyle & & \displaystyle -(p^{(0)}+\unicode[STIX]{x1D6FE}\unicode[STIX]{x1D705})(1+h_{x}^{2}+h_{z}^{2})=-p(1+h_{x}^{2}+h_{z}^{2})\nonumber\\ \displaystyle & & \displaystyle \quad +\,2\unicode[STIX]{x1D707}[(u_{y}+v_{x})h_{x}+u_{x}h_{x}^{2}+v_{y}+w_{z}h_{z}^{2}+(u_{z}+w_{x})h_{x}h_{z}+(v_{z}+w_{y})h_{z}].\end{eqnarray}$$
Note also that for the surface
 $y=-h(x,z)$
we have
 $$\begin{eqnarray}\displaystyle \unicode[STIX]{x1D705}=-\frac{(1+h_{z}^{2})h_{xx}-2h_{x}h_{z}h_{xz}+(1+h_{x}^{2})h_{zz}}{(1+h_{x}^{2}+h_{z}^{2})^{3/2}}. & & \displaystyle\end{eqnarray}$$
Non-dimensionalizing using (2.10)–(2.11) and dropping the stars yields
 $$\begin{eqnarray}\displaystyle & & \displaystyle \unicode[STIX]{x1D6E4}\frac{(1+\unicode[STIX]{x1D700}^{2}h_{z}^{2})h_{xx}-2\unicode[STIX]{x1D700}^{2}h_{x}h_{z}h_{xz}+\unicode[STIX]{x1D700}^{2}(1+h_{x}^{2})h_{zz}}{(1+h_{x}^{2}+\unicode[STIX]{x1D700}^{2}h_{z}^{2})^{1/2}}+(1+h_{x}^{2}+\unicode[STIX]{x1D700}^{2}h_{z}^{2})p\nonumber\\ \displaystyle & & \displaystyle \quad =2\unicode[STIX]{x1D700}^{2}[(u_{y}+v_{x})h_{x}+u_{x}h_{x}^{2}+v_{y}+\unicode[STIX]{x1D700}^{2}w_{z}h_{z}^{2}+(\unicode[STIX]{x1D700}^{2}u_{z}+w_{x})h_{x}h_{z}+(\unicode[STIX]{x1D700}^{2}v_{z}+w_{y})h_{z}].\end{eqnarray}$$
It follows from (A 8) that the leading- and first-order conditions (2.24) and (2.26) are capillary pressure conditions with viscous stresses entering at higher order.
Appendix B. Coordinate transforms
B.1 Transformation A
Definition:
 $$\begin{eqnarray}\displaystyle F(x,y,z)=f(\unicode[STIX]{x1D709}_{1,2},\unicode[STIX]{x1D702}_{1,2},p_{0}), & & \displaystyle\end{eqnarray}$$
 $$\begin{eqnarray}\displaystyle x=\unicode[STIX]{x1D6FF}\left(\frac{\unicode[STIX]{x1D709}_{1,2}+1}{2}\right),\quad y=(H+h_{0}(x))\left(\frac{\unicode[STIX]{x1D702}_{1,2}-1}{2}\right),\quad z=z(p_{0})\quad \text{is known}. & & \displaystyle\end{eqnarray}$$
Derivatives:
 $$\begin{eqnarray}\displaystyle & \displaystyle \frac{\unicode[STIX]{x2202}F}{\unicode[STIX]{x2202}x}=\frac{2}{\unicode[STIX]{x1D6FF}}\left(\frac{\unicode[STIX]{x2202}f}{\unicode[STIX]{x2202}\unicode[STIX]{x1D709}_{1,2}}-\frac{\unicode[STIX]{x2202}h_{0}}{\unicode[STIX]{x2202}\unicode[STIX]{x1D709}_{1,2}}\frac{\unicode[STIX]{x1D702}_{1,2}-1}{H+h_{0}}\frac{\unicode[STIX]{x2202}f}{\unicode[STIX]{x2202}\unicode[STIX]{x1D702}_{1}}\right), & \displaystyle\end{eqnarray}$$
 $$\begin{eqnarray}\displaystyle & \displaystyle \frac{\unicode[STIX]{x2202}F}{\unicode[STIX]{x2202}y}=\frac{2}{H+h_{0}}\frac{\unicode[STIX]{x2202}f}{\unicode[STIX]{x2202}\unicode[STIX]{x1D702}_{1,2}}, & \displaystyle\end{eqnarray}$$
 $$\begin{eqnarray}\displaystyle & \displaystyle \frac{\unicode[STIX]{x2202}F}{\unicode[STIX]{x2202}z}=\frac{\text{d}p_{0}}{\text{d}z}\frac{\unicode[STIX]{x2202}f}{\unicode[STIX]{x2202}p_{0}}-\frac{\text{d}p_{0}}{\text{d}z}\frac{\unicode[STIX]{x2202}h_{0}}{\unicode[STIX]{x2202}p_{0}}\frac{\unicode[STIX]{x1D702}_{1}-1}{H+h_{0}}\frac{\unicode[STIX]{x2202}f}{\unicode[STIX]{x2202}\unicode[STIX]{x1D702}_{1,2}}. & \displaystyle\end{eqnarray}$$
B.2 Transformation B
Definition:
 $$\begin{eqnarray}\displaystyle F(x,y,z)=f(\unicode[STIX]{x1D709}_{2,2},\unicode[STIX]{x1D702}_{2,2},p_{0}), & & \displaystyle\end{eqnarray}$$
 $$\begin{eqnarray}\displaystyle x=(1-\unicode[STIX]{x1D6FF})\left(\frac{\unicode[STIX]{x1D709}_{2,2}+1}{2}\right)+\unicode[STIX]{x1D6FF},\quad y=H\left(\frac{\unicode[STIX]{x1D702}_{2,2}-1}{2}\right),\quad z=z(p_{0})\quad \text{is known}. & & \displaystyle\end{eqnarray}$$
Derivatives:
 $$\begin{eqnarray}\displaystyle & \displaystyle \frac{\unicode[STIX]{x2202}F}{\unicode[STIX]{x2202}x}=\frac{2}{1-\unicode[STIX]{x1D6FF}}\frac{\unicode[STIX]{x2202}f}{\unicode[STIX]{x2202}\unicode[STIX]{x1D709}_{2,2}}, & \displaystyle\end{eqnarray}$$
 $$\begin{eqnarray}\displaystyle & \displaystyle \frac{\unicode[STIX]{x2202}F}{\unicode[STIX]{x2202}y}=\frac{2}{H}\frac{\unicode[STIX]{x2202}f}{\unicode[STIX]{x2202}\unicode[STIX]{x1D702}_{2,2}}, & \displaystyle\end{eqnarray}$$
 $$\begin{eqnarray}\displaystyle & \displaystyle \frac{\unicode[STIX]{x2202}F}{\unicode[STIX]{x2202}z}=\frac{\text{d}p_{0}}{\text{d}z}\frac{\unicode[STIX]{x2202}f}{\unicode[STIX]{x2202}p_{0}}. & \displaystyle\end{eqnarray}$$
B.3 Transformation C
Definition:
 $$\begin{eqnarray}\displaystyle F(x,y)=f(\unicode[STIX]{x1D709}_{1,4},\unicode[STIX]{x1D702}_{1,4}), & & \displaystyle\end{eqnarray}$$
 $$\begin{eqnarray}\displaystyle x=\unicode[STIX]{x1D6FF}\left(\frac{\unicode[STIX]{x1D709}_{1,4}+\cos (\unicode[STIX]{x03C0}/N)}{2\cos (\unicode[STIX]{x03C0}/N)}\right),\quad y=(H+h_{0}(x))\left(\frac{\unicode[STIX]{x1D702}_{1,4}-\cos (\unicode[STIX]{x03C0}/N)}{2\cos (\unicode[STIX]{x03C0}/N)}\right). & & \displaystyle\end{eqnarray}$$
Derivatives:
 $$\begin{eqnarray}\displaystyle & \displaystyle \frac{\unicode[STIX]{x2202}F}{\unicode[STIX]{x2202}x}=\frac{2\cos (\unicode[STIX]{x03C0}/N)}{\unicode[STIX]{x1D6FF}}\left(\frac{\unicode[STIX]{x2202}f}{\unicode[STIX]{x2202}\unicode[STIX]{x1D709}_{1,4}}-\frac{\unicode[STIX]{x2202}h_{0}}{\unicode[STIX]{x2202}\unicode[STIX]{x1D709}_{1,4}}\frac{\unicode[STIX]{x1D702}_{1,4}-\cos (\unicode[STIX]{x03C0}/N)}{H+h_{0}}\frac{\unicode[STIX]{x2202}f}{\unicode[STIX]{x2202}\unicode[STIX]{x1D702}_{1,4}}\right), & \displaystyle\end{eqnarray}$$
 $$\begin{eqnarray}\displaystyle & \displaystyle \frac{\unicode[STIX]{x2202}F}{\unicode[STIX]{x2202}y}=\frac{2\cos (\unicode[STIX]{x03C0}/N)}{H+h_{0}}\frac{\unicode[STIX]{x2202}f}{\unicode[STIX]{x2202}\unicode[STIX]{x1D702}_{1,4}}. & \displaystyle\end{eqnarray}$$
B.4 Transformation D
Definition:
 $$\begin{eqnarray}\displaystyle F(x,y,z)=f(\unicode[STIX]{x1D709}_{2,4},\unicode[STIX]{x1D702}_{2,4}), & & \displaystyle\end{eqnarray}$$
 $$\begin{eqnarray}\displaystyle x=(1-\unicode[STIX]{x1D6FF})\left(\frac{\unicode[STIX]{x1D709}_{2,4}+\cos (\unicode[STIX]{x03C0}/N)}{2\cos (\unicode[STIX]{x03C0}/N)}\right)+\unicode[STIX]{x1D6FF},\quad y=H\left(\frac{\unicode[STIX]{x1D702}_{2,4}-\cos (\unicode[STIX]{x03C0}/N)}{2\cos (\unicode[STIX]{x03C0}/N)}\right). & & \displaystyle\end{eqnarray}$$
Derivatives:
 $$\begin{eqnarray}\displaystyle & \displaystyle \frac{\unicode[STIX]{x2202}F}{\unicode[STIX]{x2202}x}=\frac{2\cos (\unicode[STIX]{x03C0}/N)}{1-\unicode[STIX]{x1D6FF}}\frac{\unicode[STIX]{x2202}f}{\unicode[STIX]{x2202}\unicode[STIX]{x1D709}_{2,4}}, & \displaystyle\end{eqnarray}$$
 $$\begin{eqnarray}\displaystyle & \displaystyle \frac{\unicode[STIX]{x2202}F}{\unicode[STIX]{x2202}y}=\frac{2\cos (\unicode[STIX]{x03C0}/N)}{H}\frac{\unicode[STIX]{x2202}f}{\unicode[STIX]{x2202}\unicode[STIX]{x1D702}_{2,4}}. & \displaystyle\end{eqnarray}$$
Appendix C. Singularity considerations
C.1 Streamwise velocity problem
The solution to the zeroth-order streamwise problem
 $w_{0}(x,y)$
was fed into the next part of the overall problem, the zeroth-order cross-flow problem. Likewise, the solution to this problem was fed into the subsequent part of the overall problem, the first-order streamwise problem. At each stage, transferring the previous numerically calculated solution introduces the potential for numerical errors to compound, severely impeding the convergence to the full solution. Consequently, we used a singularity removal method at each stage, which dramatically enhanced convergence and accuracy of the overall problem.
In particular, since the next part is a fourth-order PDE, we used slightly different Chebyshev grids and Chebyshev interpolation on
 $w_{0}$
. We also computed derivatives and indefinite integrals of
 $w_{0}$
using Chebyshev collocation methods. Since all of these Chebyshev methods rely on acting upon globally well-behaved functions, we handled the regular and singular parts of
 $w_{0}$
separately. Hence, all of the required work was done analytically on the singular part,
 $f$
, and numerically on the regular part,
 ${\hat{w}}$
. Denoting the strength of the singular part
 $f$
as
 $\unicode[STIX]{x1D6FC}$
, the solution was decomposed as
 $$\begin{eqnarray}\displaystyle w_{0}(x,y,z)=\widehat{w}(x,y,z)+\unicode[STIX]{x1D6FC}f(x,y,z). & & \displaystyle\end{eqnarray}$$
As demonstrated by Game et al. (Reference Game, Hodes, Kirk and Papageorgiou2018), the singular part
 $f$
can be calculated in polar coordinates
 $(r,\unicode[STIX]{x1D711})$
, where
 $r$
,
 $\unicode[STIX]{x1D711}$
are the usual radial and angular coordinates, respectively, with the ridge at
 $\unicode[STIX]{x1D711}=0$
. We find
 $$\begin{eqnarray}\displaystyle f(x,y,z)=r^{\unicode[STIX]{x1D706}(z)}\sin (\unicode[STIX]{x1D706}(z)\unicode[STIX]{x1D711}), & & \displaystyle\end{eqnarray}$$
 $$\begin{eqnarray}\displaystyle \unicode[STIX]{x1D706}(z)=\frac{(2k+1)\unicode[STIX]{x03C0}}{2(\unicode[STIX]{x03C0}+\unicode[STIX]{x1D703}(z))},\quad \unicode[STIX]{x1D703}(z)=\arcsin (\unicode[STIX]{x1D6FF}p_{0}(z)/\unicode[STIX]{x1D6E4}), & & \displaystyle\end{eqnarray}$$
 $$\begin{eqnarray}\displaystyle r(x,y)=\sqrt{(x-\unicode[STIX]{x1D6FF})^{2}+(y+H)^{2}},\quad \unicode[STIX]{x1D711}(x,y)=\left\{\begin{array}{@{}ll@{}}\displaystyle \tan ^{-1}\left(\frac{y+H}{x-\unicode[STIX]{x1D6FF}}\right)\quad & y\geqslant -H\\ \displaystyle \tan ^{-1}\left(\frac{y+H}{x-\unicode[STIX]{x1D6FF}}\right)+2\unicode[STIX]{x03C0}\quad & y<-H.\end{array}\right. & & \displaystyle \nonumber\\ \displaystyle & & \displaystyle\end{eqnarray}$$
The quantity
 $\unicode[STIX]{x1D703}(z)$
above is the (downwards-facing) protrusion angle of the meniscus at a streamwise distance
 $z$
along the microchannel. In our numerical implementation, we removed the first two singularities, i.e.
 $k=0$
and
 $k=1$
. Note that the singular part of functions
 $w_{A}$
and
 $w_{C}$
also take this form, therefore, in computing these we subtract the same singular function
 $f$
.
C.2 Transferring
 $w_{0}$
to the cross-flow problem

The cross-flow problem requires knowledge of the leading-order streamwise velocity
 $w_{0}$
, its derivatives and certain indefinite integrals (in
 $y$
). In order to handle the singular part
 $f$
analytically, it is necessary to derive expressions for the corresponding derivatives and integrals of
 $f$
. Firstly, we provide expressions for the
 $x$
and
 $y$
derivatives of
 $f$
as defined in (C 2)
 $$\begin{eqnarray}\displaystyle & \displaystyle f_{x}=f_{r}r_{x}+f_{\unicode[STIX]{x1D711}}\unicode[STIX]{x1D711}_{x}=\cos \unicode[STIX]{x1D711}f_{r}-\frac{1}{r}\sin \unicode[STIX]{x1D711}f_{\unicode[STIX]{x1D711}}=\unicode[STIX]{x1D706}r^{\unicode[STIX]{x1D706}-1}\sin ((\unicode[STIX]{x1D706}-1)\unicode[STIX]{x1D711}), & \displaystyle\end{eqnarray}$$
 $$\begin{eqnarray}\displaystyle & \displaystyle f_{y}=f_{r}r_{y}+f_{\unicode[STIX]{x1D711}}\unicode[STIX]{x1D711}_{y}=\sin \unicode[STIX]{x1D711}f_{r}+\frac{1}{r}\cos \unicode[STIX]{x1D711}f_{\unicode[STIX]{x1D711}}=\unicode[STIX]{x1D706}r^{\unicode[STIX]{x1D706}-1}\cos ((\unicode[STIX]{x1D706}-1)\unicode[STIX]{x1D711}). & \displaystyle\end{eqnarray}$$
We also need to compute
 $z$
derivatives. This is done using the chain rule, hence a useful expression to record is
 $$\begin{eqnarray}\displaystyle \unicode[STIX]{x1D706}_{z}=\unicode[STIX]{x1D706}_{\unicode[STIX]{x1D703}}\unicode[STIX]{x1D703}_{p_{0}}p_{0z}=-\frac{\unicode[STIX]{x1D706}}{\unicode[STIX]{x03C0}+\unicode[STIX]{x1D703}}\frac{\unicode[STIX]{x1D6FF}}{\sqrt{\unicode[STIX]{x1D6FE}^{2}-\unicode[STIX]{x1D6FF}^{2}p_{0}^{2}}}p_{0z}, & & \displaystyle\end{eqnarray}$$
which is used in the evaluation of
 $$\begin{eqnarray}\displaystyle f_{z}=f_{\unicode[STIX]{x1D706}}\unicode[STIX]{x1D706}_{z}=\unicode[STIX]{x1D706}_{z}r^{\unicode[STIX]{x1D706}}(\log (r)\sin (\unicode[STIX]{x1D706}\unicode[STIX]{x1D711})+\unicode[STIX]{x1D711}\cos (\unicode[STIX]{x1D706}\unicode[STIX]{x1D711})). & & \displaystyle\end{eqnarray}$$
It is also necessary to evaluate
 $\int _{y}^{0}w_{0z}\,\text{d}y^{\prime }$
and hence it is useful to evaluate
 $$\begin{eqnarray}\displaystyle \int _{y}^{0}f_{z}\,\text{d}y^{\prime }=\left[\int _{y}^{0}f\,\text{d}y^{\prime }\right]_{z}. & & \displaystyle\end{eqnarray}$$
Prior to differentiating the integral on the right-hand side of (C 9), we evaluate it at fixed values of
 $x\neq 0$
and
 $z$
 $$\begin{eqnarray}\displaystyle \int _{y}^{0}r^{\unicode[STIX]{x1D706}}\sin (\unicode[STIX]{x1D706}\unicode[STIX]{x1D711})\,\text{d}y^{\prime }=\int _{\unicode[STIX]{x1D711}^{-}}^{\unicode[STIX]{x1D711}^{+}}\left(\frac{x-\unicode[STIX]{x1D6FF}}{\cos \unicode[STIX]{x1D711}^{\prime }}\right)^{\unicode[STIX]{x1D706}}\sin (\unicode[STIX]{x1D706}\unicode[STIX]{x1D711}^{\prime })\frac{\text{d}y}{\text{d}\unicode[STIX]{x1D711}^{\prime }}\,\text{d}\unicode[STIX]{x1D711}^{\prime }, & & \displaystyle\end{eqnarray}$$
where
 $\unicode[STIX]{x1D711}^{+}=\unicode[STIX]{x1D711}(x,0)$
and
 $\unicode[STIX]{x1D711}^{-}=\unicode[STIX]{x1D711}(x,y)$
. Since
 $y+H=(x-\unicode[STIX]{x1D6FF})\tan \unicode[STIX]{x1D711}$
, where
 $x$
is now considered constant, we can change variables to
 $\unicode[STIX]{x1D711}$
so that the integral in (C 10) becomes
 $$\begin{eqnarray}\displaystyle (x-\unicode[STIX]{x1D6FF})^{\unicode[STIX]{x1D706}+1}\int _{\unicode[STIX]{x1D711}^{-}}^{\unicode[STIX]{x1D711}^{+}}\frac{\sin (\unicode[STIX]{x1D706}\unicode[STIX]{x1D711}^{\prime })}{(\cos \unicode[STIX]{x1D711}^{\prime })^{\unicode[STIX]{x1D706}+2}}\,\text{d}\unicode[STIX]{x1D711}^{\prime }, & & \displaystyle\end{eqnarray}$$
and evaluate to yield
 $$\begin{eqnarray}\displaystyle -\frac{(x-\unicode[STIX]{x1D6FF})^{\unicode[STIX]{x1D706}+1}}{\unicode[STIX]{x1D706}+1}\left[\frac{\cos ((\unicode[STIX]{x1D706}+1)\unicode[STIX]{x1D711}^{\prime })}{(\cos \unicode[STIX]{x1D711}^{\prime })^{\unicode[STIX]{x1D706}+1}}\right]_{\unicode[STIX]{x1D711}^{-}}^{\unicode[STIX]{x1D711}^{+}}=-\frac{1}{\unicode[STIX]{x1D706}+1}[r^{\unicode[STIX]{x1D706}+1}\cos ((\unicode[STIX]{x1D706}+1)\unicode[STIX]{x1D711})]_{y}^{0}. & & \displaystyle\end{eqnarray}$$
Hence we can derive a complete expression for
 $\int _{y}^{0}f_{z}\,\text{d}y^{\prime }$
, namely
 $$\begin{eqnarray}\displaystyle \int _{y}^{0}f_{z}\,\text{d}y^{\prime } & = & \displaystyle -\frac{\unicode[STIX]{x1D706}_{z}}{(\unicode[STIX]{x1D706}+1)^{2}}[r^{\unicode[STIX]{x1D706}+1}\{(\unicode[STIX]{x1D706}+1)\log (r)\cos (\unicode[STIX]{x1D706}+1)\unicode[STIX]{x1D711}\nonumber\\ \displaystyle & & \displaystyle -\,\unicode[STIX]{x1D711}(\unicode[STIX]{x1D706}+1)\sin (\unicode[STIX]{x1D706}+1)\unicode[STIX]{x1D711}-\cos (\unicode[STIX]{x1D706}+1)\unicode[STIX]{x1D711}\}_{y}^{0}.\end{eqnarray}$$
C.3 Singularities for
$\unicode[STIX]{x1D713}$

It can be shown (by coordinate transformation to polar coordinates and local analysis) that the system to be solved by the singular part of
 $\unicode[STIX]{x1D713}$
, which we denote by
 $g(x,y,z)$
, is
 $$\begin{eqnarray}\displaystyle \unicode[STIX]{x1D6FB}_{\bot }^{4}g=0, & & \displaystyle\end{eqnarray}$$
subject to
 $$\begin{eqnarray}\displaystyle & \displaystyle g=0, & \displaystyle\end{eqnarray}$$
 $$\begin{eqnarray}\displaystyle & \displaystyle g_{\unicode[STIX]{x1D711}\unicode[STIX]{x1D711}}=0\quad \text{on }\unicode[STIX]{x1D711}=\unicode[STIX]{x1D703}+\unicode[STIX]{x03C0}, & \displaystyle\end{eqnarray}$$
 $$\begin{eqnarray}\displaystyle & \displaystyle g=0, & \displaystyle\end{eqnarray}$$
 $$\begin{eqnarray}\displaystyle & \displaystyle g_{\unicode[STIX]{x1D711}}=0\quad \text{on }\unicode[STIX]{x1D711}=0. & \displaystyle\end{eqnarray}$$
The following expression for
 $g$
(for a fixed power,
 $\unicode[STIX]{x1D706}$
, of
 $r$
) can be verified using the Michell solution – see Barber (Reference Barber2002),
 $$\begin{eqnarray}\displaystyle g=r^{\unicode[STIX]{x1D706}}(A\cos (\unicode[STIX]{x1D706}\unicode[STIX]{x1D711})+B\cos ((\unicode[STIX]{x1D706}-2)\unicode[STIX]{x1D711})+C\sin (\unicode[STIX]{x1D706}\unicode[STIX]{x1D711})+D\sin ((\unicode[STIX]{x1D706}-2)\unicode[STIX]{x1D711})). & & \displaystyle\end{eqnarray}$$
Since the problem is homogeneous and we require non-trivial solutions, it follows that all of the constants
 $A,B,C,D$
scale together and we can assume
 $A=1$
without loss of generality. Then, (C 17) implies that
 $B=-1$
, (C 18) implies that
 $$\begin{eqnarray}\displaystyle C=\frac{2-\unicode[STIX]{x1D706}}{\unicode[STIX]{x1D706}}D, & & \displaystyle\end{eqnarray}$$
and (C 15) implies
 $$\begin{eqnarray}\displaystyle D=-\unicode[STIX]{x1D706}\frac{\cos (\unicode[STIX]{x1D706}(\unicode[STIX]{x1D703}+\unicode[STIX]{x03C0}))-\cos ((\unicode[STIX]{x1D703}+\unicode[STIX]{x03C0})(\unicode[STIX]{x1D706}-2))}{\unicode[STIX]{x1D706}\sin ((\unicode[STIX]{x1D703}+\unicode[STIX]{x03C0})(\unicode[STIX]{x1D706}-2))-(\unicode[STIX]{x1D706}-2)\sin (\unicode[STIX]{x1D706}(\unicode[STIX]{x1D703}+\unicode[STIX]{x03C0}))}. & & \displaystyle\end{eqnarray}$$
Finally, applying (C 16) gives the following implicit expression for
 $\unicode[STIX]{x1D706}$
 $$\begin{eqnarray}\displaystyle \sin (2\unicode[STIX]{x03C0}\unicode[STIX]{x1D706}-2\unicode[STIX]{x1D703}+2\unicode[STIX]{x1D706}\unicode[STIX]{x1D703})=(\unicode[STIX]{x1D706}-1)\sin (2\unicode[STIX]{x1D703}), & & \displaystyle\end{eqnarray}$$
which can be solved by standard root-finding methods. The corresponding expression for
 $g$
then follows from (C 19). Note that (C 22) can have multiple solutions for
 $\unicode[STIX]{x1D706}$
. We take the smallest non-integer solution greater than 1 (we expect velocities to be finite), and remove the corresponding singularity.



