


Introduction
The global warming anticipated in the 21st century by the scientific community is likely to affect the mountain snow cover in temperate regions. Several studies (Reference FöhnFöhn, 1990; Reference Rango and van KatwijkRango and Van Katwijk, 1990; Reference Martin, Timbal and BrunMartin and others, 1997) focused on the consequences for snow cover (duration and extent) as well as the hydrological regime of mountain rivers. Assessment of avalanche activity in a changed climate is also an important issue with respect to risk management in the future. Reference Laternser, Schneebeli, Fohn and AmmannLaternser and others (1997) assessed the evolution of avalanche activity in the 20th century by using snow data and avalanche records. They concluded that avalanche activity has remained stable and that the effect of protection measures will probably dominate the climatic signal.
In this work, the SAFRAN/Crocus/MÉPRA (SCM) software (Reference Durand, Giraud, Brun, Mérindol and MartinDurand and others, 1999) is used to assess the present avalanche activity and its modifications in a changed climate. In the first part of the paper, an avalanche-hazard index is proposed and validated against observations. Then the spatial and temporal variability of this index during the past 15 years is discussed. Several sensitivity studies are also conducted for a preliminary assessment of avalanche activity in case of climate change.
A Modelled Avalanche-Hazard Index
Avalanche activity is observed twice a day (0800 and 1300 h) in the French snow and weather network by visual observation of past avalanches using a very simple code (Table 1). At the massif scale (500–1000 km2) with N observation sites, Reference Giraud, Lafeuille and PahautGiraud and others (1987) proposed to summarize the avalanche activity,
 where A is the avalanche-hazard index, Σsites ni is the sum of the weights for each site (Table 1) and N0
is the number of sites where no avalanches are observed (a minimum of three observation sites is required for stable results). This index allows a good estimation of natural avalanche release, while the release of avalanches triggered by skiers (less frequent, and usually occurring outside the observation domain) is not well observed. For this reason, this study focuses only on natural avalanches.
Avalanche observation classes and weights for the avalanche-hazard index established by Reference Giraud, Lafeuille and PahautGiraud and others (1987)

On an operational basis, the MEPRA estimation of the avalanche hazard is available at a 3 hour time-step, with a vertical discretization of 300 m (1500–3000 ma.s.l in this study), and for six aspects (north, west, south, east, plus southeast and southwest for a better assessment of the influence of the solar radiation). For each analysis, the MEPRA expert system (Reference Giraud and ArmstrongGiraud, 1993) deduces from the Crocus snowpack simulations additional characteristics (shear strength, ram resistance and grain types). After classifying the ram and stratigraphical profile, this model studies the natural mechanical stability of the snowpack. In a first step, the usual stability index is calculated for each layer of each simulated snowpack (Reference FöhnFöhn 1987):

Depending on the value and the temporal evolution of this index, a natural avalanche risk is deduced on a six-level scale (Table 2) completed with the avalanche types (fresh dry, fresh wet, fresh mixed, surface slab, surface wet, bottom wet). In case of wet snow, the calculated index is completed by a diagnostic based on the increase of wetted-layers depth. In a second step, the expert system interprets the snowpack structure to detect the possible release of a dry slab avalanche by a skier and then to deduce a MÉPRA accidental-avalanche risk in a four-level scale.
MEPRA hazard classes and weights for the modelled avalanche-hazard index
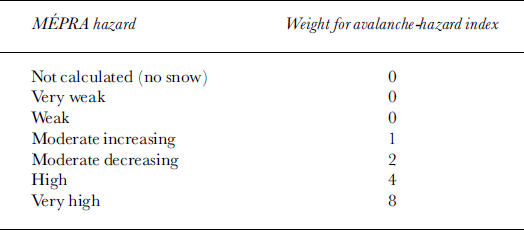
With the aim of building a “modelled daily avalanche activity” index comparable to the index proposed by Reference Giraud, Lafeuille and PahautGiraud and others (1987), the investigations of Reference Durand, Giraud, Brun, Mérindol and MartinDurand and others (1999) were extended in order to find better criteria. Several methods were used to aggregate the MEPRA analysis on a daily basis. The spatial aggregations tested were: the mean, the maximum, the mean of the highest indexes for each elevation, the maximum of the mean by aspect, and the maximum of the mean of the three highest by aspect. The temporal aggregations tested were the daily mean or daily maximum of the above-mentioned parameters. Correlations were calculated for winter 1986/87 (a winter with marked avalanche activity) in the Vanoise massif, France. A total of 16 indexes were tested. All are highly correlated with the other indexes, but the correlation with the observed avalanche activity is rather low (r = 0.44–0.55).
We decided to use the “daily maximum of the mean by aspect”: the mean of the weighted indexes between 1500 and 3000 m is calculated for each aspect every 3 h, and the final avalanche index is the maximum of all the calculated values. This index takes into account the exposure, as well as the fact that natural release of avalanches occurs most often when the daily instability is maximum. It has one of the highest correlations (0.53) with observed avalanche activity. Moreover, its definition is quite simple when compared to possible other combinations, which allows easier interpretation of the results. As a comparison, the correlation for the mean, used as index in Reference Durand, Giraud, Brun, Mérindol and MartinDurand and others (1999), is 0.49.
Further evaluations were made using contingency tables (Table 3). Three classes and their frequencies (weak 75%, moderate 15%, high 10%) were defined. This classification roughly corresponds to the frequency of forecast natural hazard in the five-level European avalanche scale (1, 2: 75.6%; 3: 15.3%; 4, 5: 9.1%). The corresponding thresholds were determined for the normalized avalanche-activity index and applied to the normalized modelled indexes.
Contingency table between indues from observation and modelled indices, Vanoise massif winter 1986/87
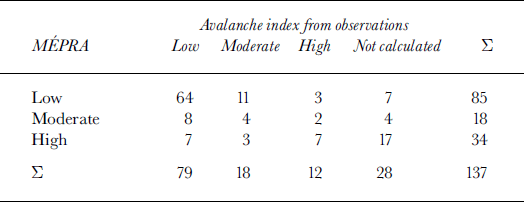
The contingency table for the index “daily maximum of the mean by aspect” (Table 3) shows that the “observed” index often cannot be calculated because of lack of observations: 28 days out of a total of 137. Among these days, 17 correspond to a high modelled index: this highlights the difficulties in observing avalanches in bad weather. The 7 days with high modelled activity and low observed activity and the 3 days with low modelled activity and high observed activity were studied in detail. In most cases, deficiencies were attributed to a lack of observations (bad weather, fog, late observation, avalanche attributed to the wrong date). However, weaknesses of SCM were highlighted. They were identified as wrong estimation of the snow/rain limit, as well as overestimation of wet-snow avalanche hazard because previous avalanche releases are not taken into account in the hazard estimation. But these cases are strictly limited.
Several problems were encountered during the validation. The first is that human observation of avalanches is not reliable in bad weather. The avalanches may be observed later, or not at all, especially for new-snow avalanches during snowfalls. In contrast, wet-snow avalanches can easily be observed. Seismic detection of avalanches (Reference Leprettre, Navarre and TailleferLeprettre and others, 1996) might be a good way of validating such modelled indexes, but at present not enough data are available to allow a comprehensive validation. The second problem comes from the quite simple avalanche code in the French snow network (see Table 1). A new code is under study. In spite of these difficulties, careful study of winter 1986/87 allows us to consider that the modelled index is a good synthesis of the natural snow-cover instability and avalanche hazard at the massif scale. Winter 1994/95, with a highly variable avalanche activity, confirmed the results from 1986/87, with a higher correlation (0.63) between the modelled and the observed index.
Present Avalanche-Hazard Climatology
SCM is used in this part to simulate the snow coverage and the avalanche hazard of the past 15 years (winters 1984/85 to 1998/99) in the French Alps. The calculated climatology obtained can be considered as a reference state for the sensitivity tests related to climate change, and is described below. The climate of the Alps is determined by the westerly flow. Precipitation (Fig. 1) is maximum in the northwest part (>600 mm a–1 at 1500 m) and decreases toward the southeast (about 200 mm a–1). A secondary maximum is located in the extreme southeast, associated with the occurrence of Mediterranean lows. The snow-cover duration (not shown) presents roughly the same pattern.
15 year mean of snowfall (mm a–1) analyzed by SAFRAN at 1500 m for winters 1984/85 to 1998/99.

The avalanche-hazard index is calculated all year round (except July and August) using the procedure defined in the previous section. The thresholds for moderate and high avalanche-hazard index were calibrated as for the tests using contingency tables, but using all massifs and five winter months (December-April) in order to obtain a distribution comparable to the test described in the previous section in winter (weak 75%, moderate 15%, high 10%). Thresholds found were 0.4 and 1.6. For the lowest massifs, the index is based on a limited number of elevations (e.g. 1500 and 1800 m for Chartreuse and Vercors).
The number of days with a moderate or high avalanche hazard (Fig. 2) varies between 107 (Mont Blanc) and 28 (Ubaye) per year. Again, the delineation follows the spatial distribution of precipitation. However, the lowest massifs of the Pre-Alps show fewer days with moderate or high avalanche index than their neighbours (Bauges, 71; Chartreuse, 47; Vercors, 32). Figure 3 shows the number of days with new-snow (precipitation or fragmented particles), wet-snow (wet grains) or mixed (both types are present) avalanche hazard. The type of avalanche is determined by MEPRA in the massif. In the north, new-snow avalanche hazard is predominant, while wet-snow avalanche hazard is predominant in the south, in conjunction with warmer and sunnier conditions. Days with mixed avalanches occur when the snow/rain limit is relatively high (1500 m or above). They are minimum in the southeast, where this type of situation is rarely encountered. The interannual variability of the avalanche hazard is very high: in the Mont Blanc massif the number of days with high or moderate avalanche hazard varies between 60 (1995/96) and 144 (1987/88) (average 107). The lowest values are obtained during the driest winters: in this case, wet-snow avalanche hazard is higher than or equal to new-snow avalanche hazard. The present study confirms that precipitation is a key factor for natural avalanche hazard: the correlation between the number of days with moderate or high avalanche hazard and winter precipitation at 1500 m is significant (r = 0.75), while correlation with winter temperature is low (r = 0.45). The above results are in full agreement with the experience of operational avalanche forecasters and confirm that one can be confident in the SCM results for climatological investigations on avalanche hazard (operational interest has already been discussed by Reference Durand, Giraud, Brun, Mérindol and MartinDurand and others, 1999).
Number of days with a moderate or high modelled avalanche-hazard index (days a–1).

Number of days with a moderate or high modelled avalanche-hazard index(days a–1)for(a) for ( a, new-snow, (b) mixed-snow, (c) wet snow avalanches.

Finally, the SCM software has been used to compare the January-February 1999 avalanche episodes to past extreme events. Episodes with an avalanche-hazard index of > 7 (the maximum is 8; see the weights in Table 2) for at least 2 days and two massifs are presented in Table 4. All events are well-known major avalanche events (characterized by either avalanche damage or high snowfall amounts). The January-February 1999 event is the longest in the last 15 years (even though it can be divided into three sub-events). Other remarkable episodes are February 1990 and December 1991, because of the large area touched by the high avalanche hazard (respectively 14 and 11 of the 23 massifs of the French Alps). Note that SCM allows a comprehensive estimation of avalanche hazard because it is based on a robust meteorological analysis. It is a good complement to the classical avalanche-hazard assessment based on weather/snow network observations and avalanche analyses.
Dates and extent of major avalanche events, 1984/85 to 1998/99

Sensitivity to Climate Change
In this first study of sensitivity of avalanche hazard to climate change, only simple methods such as constant perturbations of the meteorological variables analyzed by SAFRAN were used. Crocus and MEPRA were run with perturbed data, and the results were compared to those of the reference run detailed in the previous section. Because both a general warming and increased precipitation are expected for the next century, three runs (a full scenario and two partial ones) were made: a temperature rise of 1.8°C coupled with a precipitation increase of 10% (PT); a temperature rise of 1.8°C (T); and a precipitation rise of 10% (P). In experiments PT and T, the critical temperature (at which the precipitation turns from snow to rain) is fixed at 1.5°C. The snow coverage (especially at middle elevations (e.g. 1500 m)) is modified. In the PT scenario, the snow-cover duration is diminished by 30–40 days a–1 at 1500 m. At high elevations (3000 m), changes are small and snow coverage can be considered stable (the snow-cover duration is reduced by only a few days).
The number of days with moderate or high avalanche hazard decreases in all massifs (cf Figs 2 and 4). Variations are higher in the north, where reference values are high. However, the highest relative variations are encountered in the Vercors, Chartreuse and Bauges massifs because of their lower elevation (snow height and duration diminish drastically). In the other regions, the number of days with moderate or high avalanche hazard is diminished by 5–9 days a–1. Not surprisingly, partial scenarios indicate that this number increases with precipitation and decreases when temperature increases (in the Mont Blanc massif, presently 107 days a–1; future scenarios: PT: 96 days a–1, P: 120 days a–1, T: 84 days a–1).
Number of days with a moderate or high modelled avalanche-hazard index (days a-1) for the full climate scenano (PT).

Figure 5 shows the evolution of the mean avalanche-hazard index between November and June for two scenarios in the Mont Blanc massif. The maximum is obtained in February, and a secondary maximum (due to wet snow) occurs in May. In the full scenario (PT), the partial index for wet snow (and for mixed avalanches, not shown) increases systematically (except in May and June because of the decrease in snow-cover duration). In contrast, the partial index for new-snow avalanches decreases. The full index decreases throughout the winter (except in March), but variations cannot be considered important when looking at the daily variability of this index. The maximum decrease can be seen in May and June because of wet snow avalanches (note that in scenario Tall indexes decrease). The evolution of extreme events follows the evolution of mean parameters, and the number of days with indexes higher than 7 decreases significantly in scenarios PT and T.
15 year mean (by periods of 10 days), Mont Blanc massif, of the avalanche-hazard index for the reference run, scenario PTand scenario T. (a) Full index, (b) new-snow index, (c) wet-snow index.

Summary and Conclusion
One of the main problems encountered in this study is that avalanche activity and hazard are difficult to measure and model. New instruments (e.g. acoustic or seismic detection) may allow more accurate observation in the future, but at present only visual observations are available for a multi-year validation at large scale. The observed index in current use gives a robust synthesis of avalanche activity and may be compared to the modelled index from MEPRA. Detailed study of two winters (1986/87 and 1994/95) allowed us to consider the latter index a good indicator of avalanche hazard at the massif scale. The 15 year run (1984/85 to 1998/99) confirms the interest of this index; in particular, all the major avalanche events were found and compared easily (such comparison can hardly be made with conventional observations).
The sensitivity to climate change can only be considered a preliminary study, because of the very simple scenario. It appears that the avalanche hazard decreases slightly in winter, but the decrease is more pronounced in February and May-June. The relative importance of new-snow avalanches is expected to diminish. At this stage, one can hardly assess the impact of this scenario on the hazard of avalanches triggered by skiers (that may be the subject of another study) or the frequency of major avalanche events, which are strongly related to extreme events (mainly heavy precipitation combined with low temperature).



