Political parties are one of the most important organizations in modern democracies. This statement is especially true in Britain where political parties have traditionally played a key role in running government. Political parties became relevant in Britain's government starting in the 1670s and 1680s when a group known as “the Whigs” sought to exclude James Stuart from the throne because of his Catholicism and views on the monarchy. The Tories formed to oppose exclusion because in their view it represented too great an incursion into royal authority. The Whigs and Tories continued to differ on major issues after the Glorious Revolution when the throne was transferred to William of Orange and Britain went to war with France. The Tories protected the interests of the Church of England and were committed to the hereditary rights of the monarch. Appealing to their base, the landed gentry, the Tories also favored isolationism from continental wars and lower taxes on land. The Whigs promoted toleration to Dissenters from the Church of England and a contractual theory of the monarchy. The Whigs also appealed to one of their bases, the aristocrats and the financial interests, by pursuing an aggressive foreign policy supported by a well-funded army (Harris Reference Harris1993: 157–59; Holmes Reference Holmes1967: 164; Plumb Reference Plumb1967: 153). These differences in party principles fostered a period of intense electoral competition. During the so-called Rage of Party, between 1690 and 1715, there were 11 elections and the majority party in the House of Commons changed seven times. At stake were the jobs, influence, profit, and related spoils from controlling the Commons.
There was a change in British politics after 1715 with the weakening of party competition and the evolution of the Whig Party's principles and tactics. The Tories were damaged by their links with the failed Jacobite Rebellion of 1715, which aimed to overthrow the new Hanoverian monarchy and reinstall the Stuarts. Its leadership also failed to resolve internal disputes and create a party capable of governing (Plumb Reference Plumb1967: 172–73). The emergence of Robert Walpole as the leader of the Whig Party was another important development. Walpole courted a new group of Whigs by offering government offices and other perks. Walpole was successful in maintaining a Whig majority in the Commons from 1721 to 1742 and helped to create political stability, but he was accused of corruption and under his leadership the Whig Party became more oligarchical. Some former Whigs reacted by forming an opposition party in the early 1730s. It was the beginning of the party fragmentation characteristic of the mid-eighteenth century.
There is a burgeoning literature on Britain's first political parties. Many study how parties were interconnected with broader social and economic trends. For example, Pincus (Reference Pincus2009) argues that the Whigs and Tories had fundamentally different visions of political economy in the 1680s and 1690s, leading the Whigs to adopt policies favoring a manufacturing economy and the Tories an agrarian economy. David Stasavage (Reference Stasavage2003) argues that Whig majorities signaled a more credible commitment to protect the rights of government bond holders, and fostered the growth of a national debt. Although the literature is vast, important aspects of Britain's early parties are still poorly understood. One concerns the relationship between politics in the localities and party politics at the seat of government in Westminster. For example, little is known about how popular interests affected the outcomes of elections and, ultimately, policy making (Black Reference Black1990: 91; Harris Reference Harris1993: 202; O'Gorman Reference O'Gorman1989: 7).
Research on Britain's political parties is greatly constrained by the absence of a comprehensive and accessible database on the party representation of all Members of Parliament (MPs). Much of the literature uses The House of Commons, 1690–1715 and The House of Commons, 1715–1754, edited by Cruickshanks, Handley, and Hayton (Reference Cruickshanks, Handley and Hayton2002) and Sedgwick (Reference Sedgwick1970), respectively. The House of Commons series provides biographies of every MP with information on their politics, but there is no tabular data on the party affiliation of each MP or the constituency represented by MPs. One of the contributions of this article is to provide such data. Specifically, I code whether every MP serving in constituencies in England and Wales between 1690 and 1747 was affiliated with the majority party in each Parliament. The interest in the majority party stems from the idea that in Britain (and other countries) the majority party usually has a great advantage in implementing its legislative goals compared to opposition parties. The early eighteenth century was also the period when the ministry became interconnected with the largest or most influential party in the Commons (Cox Reference Cox2011; Plumb Reference Plumb1967).
Like previous historical studies, this article uses division lists to identify party affiliation. Division lists were often compiled by MPs for political purposes (Cruickshanks and Hayton Reference Cruickshanks, Hayton, Ditchfield, Hayton and Jones1995: 99). Some listed all MPs that belong to one party or another, and were designed to assist party leaders in the management of Parliament. Another type identifies which MPs voted for or against a particular bill in the House of Commons. The bills are usually associated with the policy agenda of the governing party or the opposition, and one goal of publishing such lists was to influence the electorate (ibid.).
Division lists are invaluable as they are the only systematic source on the political views or votes of a large number of MPs. However, division lists do have their problems. Lists vary in their informational content as some were colored by the views of the compiler. Sometimes mistakes are also made with MPs being incorrectly assigned to a position (Cruickshanks and Hayton Reference Cruickshanks, Hayton, Ditchfield, Hayton and Jones1995: 108). Another problem is that, when multiple division lists exist in a Parliament, MPs may not fit the Whig or Tory model of voting on all division lists in that Parliament. The issue of so-called cross-voting or independence is significant and has led to much debate about the nature of parties after the Glorious Revolution (see the literature review on party allegiances in the following text).
I address the issues with division lists in several ways. First, the secondary literature is consulted whenever possible to identify lists with higher informational content or to identify mistakes. Second, an algorithm is developed that combines information from two or more division lists. The algorithm is “conservative” in that majority party status is assigned only to MPs who never deviate from the majority party line for all division lists in a Parliament. Along with this article, I provide a data file with all the MPs in each Parliament and their listing on all divisions used in this article. Therefore, in the future researchers can drop division lists or add them in order to study the robustness of my classifications of majority party affiliation. Researchers can also dispense with the majority party framework and use the lists to classify MPs as Whigs and Tories in individual parliaments.
The new data on MP party affiliation has numerous applications for research on Britain's politics, economy, and society. In this article, the implications for party representation and the electoral politics of constituencies are examined. I begin by constructing variables for “Whig strength” and “Tory strength” in all English and Welsh constituencies between 1690 and 1747. I also classify which constituencies were safe for the Whigs or Tories, and which regularly swung between the majority parties. The figures indicate there were fewer safe and swing seats than previous historians thought. Most constituencies had allegiances with one party for some time, but not consistently. More generally, the results suggest a high degree of political competition and fluidity especially before 1715.
The data are also used to test theories on where and in which types of constituencies the Whigs and Tories drew their electoral strength. Historians have argued that the Whigs were stronger in municipal boroughs with small and narrow electorates. The Tories are thought to be stronger in county constituencies and in boroughs with large and more democratic electorates (Colley Reference Colley1982; O'Gorman Reference O'Gorman1989; Rogers Reference Rogers1989; Speck Reference Speck1970). I confirm both of these arguments using difference-in-means tests for the Whig and Tory strength variables. Historians have also argued that Tories were strongest in Wales and Western England, whereas the Whigs had a slight advantage in the South (Colley Reference Colley1982; Speck Reference Speck1970). I also find that the Tories were strongest in Wales and the West, but the Whigs are found to be much stronger in the Southeast and North especially during the Rage of Party. In the Walpole era, Whig strength became more uniform in the Southeast, Southwest, East Midlands, and North. During the Rage of Party, Whig strength was higher in counties where “Dissenters” from the Church of England were more populous, but not so under Walpole. This finding provides additional evidence that the Whig Party distanced itself from its original principles under Walpole.
Another application of the data addresses the linkage between electoral contests and the dynamics of party strength in constituencies. In the literature, the incidence of a contest, where multiple candidates run and an election occurs, is taken as an indicator of local opposition to the traditional arrangement whereby a wealthy patron nominates their MP (O'Gorman Reference O'Gorman1989). For the first time in the literature, I examine whether contests affected party representation, specifically the strength of the majority party. Using constituency-Parliament–level data, I show that when contests occurred in a constituency the majority party often lost strength in the resulting election. These findings suggest that the prevailing status quo in a constituency could be changed if voters or opposition leaders chose to invest time and money in contesting an election.
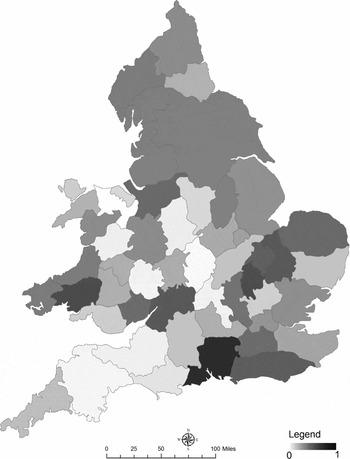
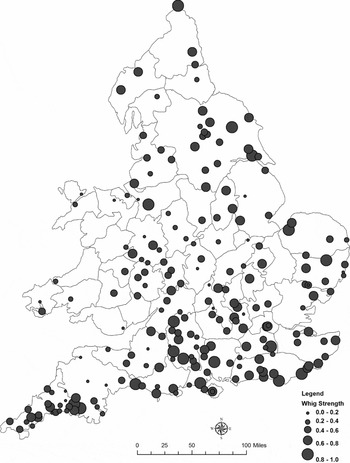
Finally, one of the most exciting applications of the data involves the use of geographic information systems (GIS). To illustrate the spatial patterns, figures 1 and 2 show indices for Whig Party strength in English counties and municipal boroughs. The strength of the Whig Party has never been displayed spatially to my knowledge. GIS files with the party data accompany this article and should open new avenues for research in English and Welsh history.
Whig strength in English and Welsh counties. Source: see text.

Whig strength in English and Welsh boroughs. Source: see text.

The Literature on Party Allegiance
There is a large literature examining political parties from their emergence in the 1670s to the mid-eighteenth century when parties became fragmented. The key areas of debate concern the role of party allegiances in determining parliamentary behavior, the relationship between parties and the electorate, and the relationship between parties and policy decisions. Party allegiances are most relevant to the first part of this article. I will return to the electorate and policy later. The literature generally interprets party allegiances as MPs having a shared set of political principles. The principals are often framed around divisive issues like support for the Church of England or permitting Dissenters to practice freely and hold office. The Whigs and Tories often took opposite sides on a principal issue helping to form a two-party system. The earliest historians of party, such as Trevelyan (Reference Trevelyan2013), viewed the Glorious Revolution as the moment when strong party allegiances and the two-party system began. Trevelyan's evidence largely came from the diaries and pamphlets of contemporaries who used Whig and Tory labels and espoused their principles.
In reaction, Namier (Reference Namier1957) and Walcott (Reference Walcott1956) led a revisionist school that argued that many MPs did not fit into the two-party model despite the broad use of the Whig and Tory label. Focusing on the 1690s and early 1700s Walcott argued that many MPs could easily divide along “court” and “country” distinctions. Court MPs served the crown's ministers in the hopes of receiving government positions. Country MPs aimed to check the government's military and fiscal policies mainly because they captured few of the spoils. In Walcott's view, party principles were weak and MPs formed groups based on connections to the court's ministers. The working of the “party” system is summarized as follows: “the parliamentary foundation of any administration will be the court segment, with its solid nucleus of regular government members. The task of the chief ministers will then be to recruit enough elements from the adjoining Whig or Tory segments so that they and the government members together will give the administration a workable majority” (ibid.: 158).
The Walcott interpretation was challenged by historians who argued again for the two-party model. Holmes (Reference Holmes1967) studied the voting behavior of MPs in 10 division lists between 1702 and 1714 and found that only 8 percent of the MPs labeled Tory or Whig voted against the party line on any list. Hayton (Reference Hayton, Cruickshanks, Handley and Hayton2002) went further analyzing 24 division lists dealing with party issues between 1696 and 1714. The finding was that 62 percent of MPs acted with complete consistency. Hayton also examined 12 division lists dealing with court versus country issues and found a lower percentage of MPs (54 percent) acting consistently for court or country.Footnote 1 Moreover, Hayton argued that Whig and Tory principles and court and country distinctions often overlapped, with the Whigs supporting the court agenda and the Tories the country perspective.Footnote 2
There is a similar debate about the strength of party allegiances for the period from 1715 to 1747. Hill (Reference Hill1976: 228–29) argues that party allegiances were strong as Whig MPs coalesced around their support for the Hanoverian monarchs. Focusing on the Tories, Colley (Reference Colley1982) argues that it remained an organized and effective party, and continued to work toward the goal of regaining a majority in the Commons and the ministry. Counter to these views, Thomas (Reference Thomas1987) argues that Colley and Hill misinterpret the evidence of Tory cohesion. Thomas also questions the two-party framework in the Walpole era, where the expectation of government patronage is believed to be the key reason Whig MPs acted in concert. Owen (Reference Owen1962) also questioned the strength of party allegiances in documenting that 28 percent of Whig MPs voted against the ministry at least once between 1730 and 1747.Footnote 3 The main consensus on parties in the second quarter of the eighteenth century is that it was a period of transition to a party system less dominated by principles and more influenced by the pursuit of patronage and royal favor.
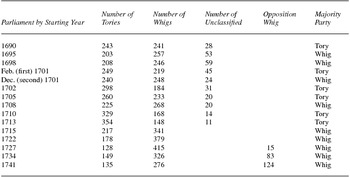
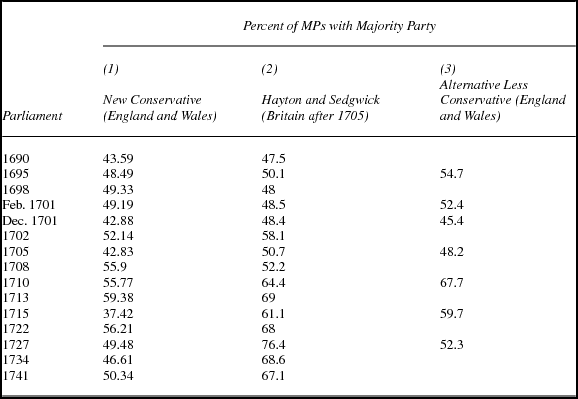
The preceding literature provides a useful framework for the identification of party affiliation from 1690 to the late 1740s. Before describing my methodology, it is necessary to briefly describe Hayton's (Reference Hayton, Cruickshanks, Handley and Hayton2002) and Sedgwick's (Reference Sedgwick1970) estimates of party groupings in the House of Commons. Table 1 gives their party counts at the beginning of each Parliament. Hayton's and Sedgwick's estimates are based on a large number of division lists, but neither describes how they deal with the “cross-voting” or “independence.” It is possible that some MPs Sedgwick classifies as Whigs after 1715 occasionally voted against Whig governments, but were not dropped from the totals of Whig MPs. The same concern applies to Hayton's figures although perhaps cross-voting MPs end up as unclassified.
Classifications of party strength in parliaments from 1690 to 1741

Sources: Hayton (Reference Hayton, Cruickshanks, Handley and Hayton2002: 218–33) and Sedgwick (Reference Sedgwick1970: 33–57).
Another limitation is that Hayton's and Sedgwick's figures are not presented in a disaggregated form. They are published in the introductory volumes to The House of Commons, 1690–1715 (Cruickshanks et al. Reference Cruickshanks, Handley and Hayton2002) and The House of Commons, 1715–1754 (Sedgwick Reference Sedgwick1970). The volumes contain a biography of every MP, describing their politics, education, profession, positions held, and other characteristics. Unfortunately, the biography does not give an indicator for party affiliation that would correspond to the totals given in table 1. A researcher interested in the party affiliation of all constituencies must read every biography and infer party affiliation from the description. For example, the biographical entry for Thomas Lamplugh, representing Cockermouth from 1702 to 1708, contains more than 1,000 words. Toward the end of the Lamplugh entry it is stated that “an analysis of the Commons in early 1708 classed him as a Whig.”Footnote 4 On the basis of this biographic entry, a researcher could classify party affiliation, but as a general approach it is not ideal. The relevant passages are not always easy to find and, once identified, the inferences based on their text could lead to judgment errors. A researcher is also tied to the biographer's description of an individual MP's party affiliation. If their classification was not accurate there is little a researcher can do to identify the error unless he or she returns to the primary sources.
Methodology for Classifying MP Party Affiliation
My analysis follows the previous literature in using division lists to classify the party affiliation of MPs. Hayton (Reference Hayton, Cruickshanks, Handley and Hayton2002: 835–40) has identified all division lists from 1690 to 1715. The History of Parliament Trust has retained a red ledger reproducing the data contained in the divisions.Footnote 5 The red ledger is similar to a spreadsheet with the voting records of each MP or their classification as Whigs or Tories in the columns. Sedgwick's (Reference Sedgwick1970: 126–31) catalog of all parliamentary lists between 1715 and 1754 provides a useful starting point after 1715. Cruickshanks and Hayton (Reference Cruickshanks, Hayton, Ditchfield, Hayton and Jones1995) provide a more recent catalog of division lists, and it serves as an additional source. I also draw on the secondary literature including Synder (Reference Snyder1972), Speck (Reference Speck1964), and Horwitz (Reference Horwitz1977) who classify many MPs as Whigs or Tories based on division lists.
The next step is to develop a methodology for using division lists. My approach begins with the identity of the majority or governing party in each Parliament. The majority party is inferred from Hayton's and Sedgwick's counts of MPs (see table 1). Their classification of the majority party is supported by the party affiliation of key government ministers. In all parliaments from 1690 to 1713 at least two of the Lord President of the Privy Council, the first Lord Treasurer, and the Chancellor of the Exchequer were affiliated with the majority party identified by Hayton and Sedgwick. Online appendix table 5 provides the details on the party affiliation of ministers.
The second step is to adopt a general rule for classifying an MP as being with the majority party in each Parliament. The major issue here is cross-voting. I chose to adopt a rigorous or conservative criterion given the debate about party allegiances in the literature. I assume that the MP has to vote with or be listed with the majority party and cannot vote against a bill promoted by majority party leaders in any division list for that Parliament. One vote against the majority party disqualifies an MP from being coded as a majority party MP. MPs can be absent on some vote and still be classified as a majority party MP if they consistently vote with the majority party on other bills and/or they were classified as being with a party. MPs can switch parties across parliaments, but not within parliaments. An MP can vote with the Whig majority in one Parliament, but in the next Parliament can deviate from the Whig majority on some votes and hence is not classified as with the majority party.
It was not uncommon for MPs to go unclassified in all division lists during a given Parliament. Here the most reasonable approach is to use classifications or voting records in nearby parliaments, usually the previous one. If nearby parliaments fail to produce any information, then the biographies in the edited volumes by Cruickshanks et al. and Sedgwick are consulted. If the biographies do not give clear information on party affiliation, then MPs are labeled as not with the majority party.
Note that my approach cannot classify the size of the opposition party in each Parliament because it does not classify the political affiliation of MPs who are not with the majority. For example, if MPs are not classified with the Whig majority in a Parliament they are not automatically labeled a Tory in the same Parliament. There is a potential to classify MPs as Whig if they were not classified with the majority party during Tory majorities and they were classed with the majority party under Whig majorities. Similarly, MPs could be classified as Tory if they were not classified with Whig majorities and they were classified with Tory majorities. I leave this application to future research.
The following subsections describe how political affiliation is determined in each Parliament using the available division lists. When it is useful, the columns in the red ledger provided by the History of Parliament Trust are noted.
1690 Parliament
The 1690 Parliament had a slight Tory majority. There is a division list attributed to Lord Carmarthen, the President of the King's council, and a prominent Tory, in March 1690 (column 1 in the red ledger). The Carmarthen list gives MPs a numerical coding: 1 = Whig, 2 = Tory, and 3 = Doubtful. There is another list attributed to Carmarthen (column 3 in the red ledger) that labels some MPs as probable supporters of Carmarthen. There were 38 MPs that could not be found on the Carmarthen list, but I was able to code them as being with the Tories based on their voting in the 1695 session. I could not determine the political affiliation of 26 MPs based on voting in other sessions, so here the biographies in Cruickshanks et al. are referenced. Note that a typical Parliament before 1700 had at least 513 MPs and usually more as some died or vacated their seat before the next election.
1695 Parliament
The 1695 Parliament saw a shift in the majority to the Whigs who also became known as the Court Party based on their close link with King William. One division (column 18 in the red ledger) concerned the bill of attainder for Sir John Fenwick in November 1696. Fenwick was accused of an assassination attempt against King William. The Whig leaders supported the attainder of Fenwick and the Tories did not. P indicates a vote for the attainder and C against. A second division concerned the proposed Council of Trade in January 1696 (column 15). The Council of Trade Bill revised the navigation laws and was supported by the Whig leadership. P indicates an MP was likely to support the court on the trade bill and C indicates an MP was likely to oppose the court. A third division concerned whether an MP signed or refused to sign the Association of the First (column 16). The Association was a document pledging to take revenge against William's enemies. The Whig leaders supported the Association and signed quickly. The Tories did not. P indicates the MPs signed the Association of First and C indicates they did not. Following the general approach, MPs were identified as a Whig if they always voted with the Whig leaders, meaning they supported the Fenwick attainder, the Council on Trade Bill, or signed the Association. Whig MPs are allowed to be absent on one or two of these divisions, meaning if they voted with the Whigs on any one and were absent for the rest they were stilled classified as a Whig. There are 22 MPs who are not reported in any of these divisions, but were classified based on voting in 1690 or the 1698 session. For six MPs the biographies in Cruickshanks et al. were consulted.
1698 Parliament
The Whigs maintained a majority in the House of Commons in the 1698 session. There is a division list that distinguishes between the court party and the country party in September 1698 (column 27 in the red ledger). MPs are given an x if they were a court supporter and a check mark if they were a country supporter. MPs are defined as a Whig if they were listed as a court supporter. There were 32 MPs who could not be found in the 1698 division list, but they were labeled a Whig based on voting in previous parliaments. For 21 MPs the biographies in Cruickshanks et al. were consulted to establish whether they were a Whig.
1701, February and December Parliaments
In February 1701 a new Parliament was formed, in which the Tories had a majority. In December 1701 there was another Parliament, in which the Whigs had a narrow majority. Three sources are used to establish party in these two parliaments. First, there is an analysis by Robert Harley in December 1701 listing MPs as with the Whigs (A), with the Tories (B), or doubtful (C) (column 35 in the red ledger). Second, Horwitz (Reference Horwitz1977) in his study of parliamentary politics classifies MPs as Tory, Whig, or mixed. Third, Snyder (Reference Snyder1972) lists MPs in the February 1701 Parliament and the December 1701 Parliament, which Lord Sunderland regarded as a gain or loss for the Whigs. Some MPs are found in all sources and others in only one or two. The following rule is used. If MPs were listed as a Whig (or Tory) in only one source they were classified as a Whig (or Tory). If they were classified as a Whig in one source and as a Tory or doubtful in another source, then they are not classified as Tory in the February 1701 Parliament or Whig in the December 1701 Parliament. If MPs were listed in multiple sources to be with the majority party, they had to be consistently classified as such. For 56 MPs in the two sessions there was no information from the sources in 1701 so their party affiliation was inferred from classifications in earlier parliaments. For 128 MPs there was no information in the 1701 sources and prior classifications were absent or unclear so the biographies in Cruickshanks et al. were consulted.
1702 Parliament
The 1702 Parliament had a large Tory majority. As many MPs in 1702 were in Parliament in 1701 the same sources as 1701 are used to classify party here. I also use one additional division list indicating whether MPs voted for or against the “Tack” in November 1704 (column 51). The Tack was the occasional conformity bill (pushed by Tories favoring the Church of England) and was tacked onto the land tax bill in 1704. I start with the Tack. If MPs voted for the Tack, then they were a Tory and if they voted against they were not classified as a Tory. Next I used Sunderland's list of gains and losses for the Whigs in 1702 provided by Synder (Reference Snyder1972). If MPs were classed as a loss to the Whigs, they were a Tory and if a gain to the Whigs they were not. If MPs did not vote on the Tack and were not in Sunderland's list, the classification from the 1701 parliaments is used to determine whether they were a Tory. There were 35 MPs with no information in the Tack or previous parliaments so the biographies in Cruickshanks et al. were consulted.
1705 Parliament
The Tories maintained a majority in the 1705 Parliament. Speck (Reference Speck1964) gives the voting record for many MPs in the 1705 session. They are assigned 1T, 2T, 3T, and 4T if they voted one, two, three, or four times for Tory positions between 1702 and 1714. MPs are assigned 1W, 2W,. . . 7W if they voted one, two, and up to seven times for Whig positions. Speck also indicates if MPs voted for some Whig and some Tory positions and how many. Lastly, Speck labels MPs “N” if they do not occur on any list he consulted. MPs were classified as Tory if they always voted Tory according to Speck. If they ever voted Whig, they were not classified as Tory. If any MPs were listed as N by Speck the biographies in Cruickshanks et al. were consulted to establish whether they were Tory. For 91 MPs I inferred their voting record from previous parliaments.
1708 Parliament
The 1708 Parliament saw the return of the Whigs as the majority party in the Commons. Here four division lists are used. The Cambridge division list in early 1708 identifies MPs as either Whig or Tory (column 58 in the red ledger). The “True” division list in early 1708 identifies MPs as Whig, Court Whig, Tory, or other (column 59 in the red ledger). These two lists overlap with respect to most MPs but not all. The third division list indicates whether MPs supported the naturalizations of Palatines (column 61 in the red ledger). Support was taken to be a Whig position. The fourth division list indicates whether an MP voted for or against the impeachment of Dr. Sacheverell (column 62 in red ledger). Voting for was a Whig position. If MPs were labeled a Whig or Court Whig in the Cambridge and True lists and voted for naturalization and impeachment, then they were classified as a Whig. If MPs were labeled a Tory, then they were not classified as a Whig. If MPs were not labeled in the Cambridge and True lists and either supported the naturalization of palatines or voted for the impeachment they were labeled a Whig. If they voted against the Whig position on naturalization or against the impeachment of Dr. Sacheverell they were not labeled as a Whig. For 12 MPs not on any list the biographies in Cruickshanks et al. are consulted.
1710 Parliament
In the 1710 Parliament the Tories returned to the majority. Three division lists are used to classify MPs. First, the Hanoverian list in 1710 describes MPs as Tory, Whig, or doubtful (column 67 in the red ledger). Second, the White list identifies “Tory Patriots” in 1711 (column 68). Third, there is a division list concerning the French Commerce Bill (column 75). A vote for the French Commerce Bill indicated a position in favor of the Tory leadership. If MPs were identified as a Tory on the Hanoverian list and the White list and they voted for the French Commerce Bill, they were classified as a Tory. If they were not identified on the first two lists but did vote for the commerce bill they were also classified as a Tory. For 95 MPs there was no information on these three lists and their political affiliation was classified based on prior voting. For 27 MPs I use the biographies in Cruickshanks et al. because they were not identified in any division list.
1713 Parliament
The Worsley list classifies MPs with the Tory majority in the 1713 Parliament. Worsley identifies whether an MP was a Tory or Whig and whether MPs sometimes voted against their party. The Worsley list is reprinted in Sedgwick (Reference Sedgwick1970) along with Sedgwick's corrections to a few errors in the Worsley list. I classified MPs as a Tory if they were listed as such by Worsley and they were not identified as an MP that would sometimes vote against their party. There were three MPs where prior voting was used to determine party. For eight MPs the biographies in Cruickshanks et al. are consulted.
1715 Parliament
The Whigs gained a majority again in the 1715 Parliament. The Worsley list provides an indicator for every MPs party affiliation at the start of the 1715 Parliament. The Worsley list becomes less useful after 1718 when there is a split in the Whig leadership due to a quarrel between the King and the Prince of Wales. Whig leaders like Sunderland, Stanhope, and Cadogan remained as ministers while Townshend and Walpole left the ministry and formed a Whig opposition. The Whig opposition voted against the government on several key bills. One bill was meant to repeal a provision of the Occasional Conformity Act requiring public office holders to take the sacrament. A list of MPs voting for and against the so-called Protestant Interest Bill is given by Cobbett (Reference Cobbett1811, 7: 585–88). A second bill was to prevent the prince from expanding the peerage upon succession. It is known as the Peerage Bill and a list is reprinted in Chandler (Reference Chandler1742, 7: 285–95). Both the Protestant Interest Bill and the Peerage Bill were supported by the Whig-led Sunderland-Stanhope-Cadogan ministry. For this Parliament, I assume a Whig MP must support the Whig ministry throughout. Thus I classify MPs as Whig if they were classified as a Whig in the Worsley list and if they did not vote against the repeal of the Occasional Conformity Act or the Peerage Bill. For 86 MPs I used the biographies in Sedgwick.
1722 Parliament
Identifying party affiliation for the 1722 Parliament is more difficult as there is only one division list from 1722 to 1727. The division is from a disputed election in Wells in 1723 and has been compiled by Hanham (Reference Hanham1996). Whig opponents disputed the election victory of two Tory MPs in Wells, Francis Gwyn, and Thomas Edwards. A vote was taken in the Commons, which upheld Gwyn's and Edwards's seats. Afterward Gwyn listed the Tories who voted to uphold their election and the Whigs that voted against. Gwyn also listed “Whig” MPs that voted to uphold the election, and thus went against their party's interest. Furthermore, Gwyn listed Tories that were absent, Whigs that were absent, and Whigs that “promised & did not appear for me” (see Hanham Reference Hanham1996). The latter group can be interpreted as Whigs considering voting against their party but did not in the end. For the 1722 Parliament I classify MPs as a Whig if they voted against upholding the Wells election, if they were an absent Whig, or if they were a Whig that promised but did not appear for Gwyn. If an MP was listed as a Tory or a Whig that voted to uphold the Wells election they were not classified as a Whig. Gwyn's list did not include 223 MPs who sat in the 1722 Parliament. In these cases, the voting records from the previous Parliament are used for 151 MPs. MPs that were Whig in the 1715 Parliament were classified as Whig again if they sat in the 1722 Parliament. Whigs that supported the Sunderland-Stanhope ministry also supported the Walpole ministry that formed in 1721 and continued in the 1722 Parliament. If MPs were classified as a Tory in the Worsley list from 1715 then they were not classified as a Whig if they sat in the 1722 Parliament. Tories rarely switched to the Whig side. The more difficult group are MPs that were classified as Whig in the Worsley list but were not classified as Whig in the 1715 Parliament due to the split. Here I consult the biographies in Sedgwick to see if they were considered to be Whigs throughout the 1722 Parliament. I also consult the biographies in Sedgwick if the MP served in the 1722 Parliament for the first time. In total the biographies in Sedgwick were used to classify 72 MPs in the 1722 Parliament.
1727 Parliament
There is a rich set of division lists to identify party affiliation in the 1727 Parliament where the Whigs again held the majority. The first involved a bill to make good on the arrears to the Civil List in 1727. The Civil List funded the king's household and thus was crucial to the government and the Whigs. A list of MPs voting for and against the Civil List is reprinted in Chandler (Reference Chandler1742, 8: appendix). The second was a supply bill to fund Hessian soldiers. Like the Civil List, voting for the Hessian Bill represented a vote for the Whig position. A list of the MPs that voted for and against the Hessian Bill was printed in 1730 (Great Britain 1730). The third was a bill to repeal the Septennial Act in 1731. The Septennial Act dictated that parliaments could sit for seven years before an election. The Whigs were perceived as benefitting from the Septennial Act, so a vote against the repeal represented a vote for the Whig position. A list of MPs voting for or against the repeal is printed in Cobbett (Reference Cobbett1811, 9: 479–82). The fourth division list involved the Excise Bill, which proposed to increase excise taxes. It was proposed by Walpole and would improve the fiscal position of the government. Voting for the Excise Bill represented a vote for the Whig position. A list of MPs voting for and against the Excise Bill is reprinted in Chandler (Reference Chandler1742, 8: appendix). If MPs voted with the Whigs on at least one of these four bills and never voted against the Whigs on any of these four bills they were classified as a Whig. Thus a vote against the Whig position automatically meant an MP was not classified as a Whig. There were 102 MPs in the 1727 Parliament that are not identified on any of the four division lists and therefore the biographies in Sedgwick were used to classify party affiliation. Note that Sedgwick also lists MPs classified as opposition Whigs toward the end of the 1727 Parliament (1970: 87). Opposition Whigs are not classified as Whig in my methodology. I include a list of opposition Whigs in the database as it is useful for the analysis later.
1734 Parliament
There are two main division lists for the 1734 Parliament and both are printed in Chandler (Reference Chandler1742, 8: appendix). The first is a division on a motion to address the Spanish Convention in 1739. The Spanish Convention was an agreement between the Spanish king and English merchants who were accused of violating trade agreements in the Americas. Walpole proposed the agreement, and voting for the motion to address the Spanish Convention represented a Whig position. The second is a division list describing whether MPs voted for or against the Place Bill of 1740. Voting against the Place Bill represented a Whig position. There were 105 MPs in the 1734 Parliament that could not be identified in either of the two division lists. In these cases, the biographies in Sedgwick are consulted. Note there were also 50 MPs classified as opposition Whigs by Sedgwick in this Parliament.
1741 Parliament
There are two main division lists for the 1741 Parliament. The first is the December 1741 division over the election of the chairman for the committee of privileges and elections (see Chandler [Reference Chandler1742, 8: 55–60]). The chairmanship was important as it had an influence on the outcomes of disputed elections. Walpole proposed Giles Earle and the opposition chose Dr. Lee. MPs who supported Earle were acting in support of the Whig leadership and those who supported Lee were acting against. The second division dealt with funding for Hanoverian troops in 1742 (Chandler Reference Chandler1742, 14: appendix). The Whig leadership supported funding the Hanoverian troops while the opposition opposed. If MPs were in both lists, then they had to vote for Earle and for funding Hanoverian troops to be classed a Whig. If MPs were in only one of these lists, then they had to vote with the Whig leadership to be classed a Whig. There were 97 MPs in the 1741 Parliament in neither of these lists. Here the biographies in Sedgwick were used to classify party affiliation.
Summary of Majority Party Classifications
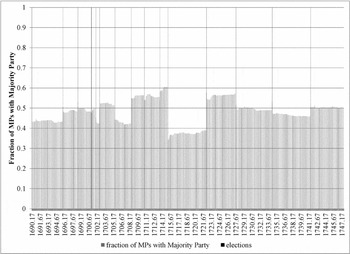
The majority party classifications of MPs are summarized in the supplementary databases that accompany this article. It lists all MPs holding seats in English and Welsh constituencies every month between February 1690 and June 1747. For each MP an indicator variable is provided for majority party affiliation as well as accompanying data from the division lists, and in some cases the party classification from prior voting and secondary sources like Cruickshanks et al. or Sedgwick. Figure 3 shows monthly time series for the fraction of English and Welsh MPs affiliated with the majority party. The fraction of MPs with the majority ranges between 0.34 and 0.605 with an average of 0.485. Most of the shifts in majority party size occur at elections, especially the 1715 and 1722 elections. In between there is some variation due to MPs leaving the House of Commons or dying and being replaced. Some elections were also overturned due to evidence of voter fraud. In such cases, new MPs are elected and the fraction with the majority can change.
Fraction of MPs with the majority party in England and Wales by month, 1690–1747. Source: see text.

Estimates for the size of the majority party averaged over each Parliament are reported in table 2. I refer to column 1 as “conservative” because the classifications require consistent voting patterns for majority party MPs within parliaments. The conservative estimates indicate there was a “true” majority (more than 50 percent of MPs) in 6 of the 15 parliaments. The majority party was close to 50 percent in four other parliaments (1695, 1698, February 1701, and 1727). The five remaining parliaments (1690, December 1701, 1705, 1715, and 1734) put the size of the majority party significantly below 50 percent. In these last five, the estimates could be interpreted as the size of the “governing” party, which consistently voted together, rather than a true majority.
Summary of majority party representation in parliaments from 1690 to 1741

Notes: The conservative and alternatives are described in the text. For Hayton and Sedgwick see table 1.
The new estimates are comparable to Hayton's and Sedgwick's estimates for the size of the majority party subject to some caveats. Hayton and Sedgwick include Scotland from 1708 onward, whereas the new estimates are for England and Wales throughout. Also the Hayton and Sedgwick party counts are taken at the beginning of the Parliament, whereas my estimates are averaged over the whole Parliament. Despite their different structures, the two series share some similarities especially before 1715. For the three parliaments, 1690, December 1701, and 1705, Hayton also finds the majority to be relatively small. In both series, the 1713 Parliament has the largest majority. The main difference is that Sedgwick's estimates after 1713 generally find the size of the majority party to be larger (the 1715 Parliament will be explained in the following text). One factor is the omission of Scottish MPs in the new series. Scottish MPs are thought to have been more closely allied to the ministry party (Plumb Reference Plumb1967: 158). It is also likely that the new series yields a smaller majority because it incorporates the cross-voting of MPs.
Robustness
It is useful to relax some of the assumptions underlying the preceding classifications and see how the size of the majority party changes. In the 1695 Parliament, MPs are identified as with the majority if they supported the Fenwick Attainder, supported the Council on Trade Bill, and signed the Association of the First. As an alternative, suppose it is sufficient for MPs to vote “Whig” for two of these three. The size of the majority in 1695 would then increase to 54.7 percent (see column 3 in table 2). Thus there were a number of MPs in 1695 who voted Whig on some bills but not all. Depending on one's position, the alternative, less conservative, estimate may be preferred.
In the February 1701 Parliament and the December 1701 Parliament equal weight was given to Harley's list, Horwitz's classification, and Lord Sunderland's list. Suppose as an alternative I first used Harley's list and if an MP was not listed there then Horwitz's and Sunderland's classification are used. Suppose Harley's classification is given priority in cases in which there is conflicting information with Horwitz and Sunderland. The resulting calculations imply a relatively small increase in the majority party in 1701, say from 43 to 45 percent in the December Parliament (see column 3 in table 2). Thus the results for 1701 are not overly sensitive to the equal weighting between the three sources.
In the 1705 Parliament MPs are classified as Tory if they always voted Tory according to Speck. If they ever voted Whig, they were not classified as Tory. Suppose I relax this assumption and allow MPs to be classified as a Tory if Speck specifies that they voted for Tory positions more than Whig positions. The less stringent assumption implies that 48 percent of MPs were with the Tory majority as opposed to 43 percent in the baseline model. Thus the presence of cross-voting has a noticeable effect on the size of the majority party in the 1705 Parliament.
In the 1710 Parliament, if MPs were identified as a Tory on the Hanoverian list and the White list and they voted for the French Commerce Bill then they were classified as a Tory. There are some MPs labeled as Tories on the Hanoverian and White lists that did not vote for the French Commerce Bill. Suppose that an MP did not need to vote for the French Commerce Bill to be classified as a Tory, but needed to be on the Hanoverian or White list. The size of the majority would then increase to 67.7 percent. Again the size of the majority is sensitive to the requirement of a consistent voting record.
In the 1715 Parliament MPs classified as a Whig on the Worsley list would not be classified as with the majority Whigs in the Parliament if they voted against the repeal of the Occasional Conformity Act or the Peerage Bill. The last two bills were important to the Whig leaders, Stanhope and Sunderland, and contributed to a split in the Whig Party. To see their significance, suppose I drop the requirement that a Whig in the Worsley list never vote against either the Occasional Conformity Act or the Peerage Bill to be classified as a Whig. The size of the majority in the 1715 Parliament would then increase substantially to 59.7 percent. Once again the size of the majority is found to be sensitive to the requirement of a consistent voting record.
Finally, in the 1727 Parliament there were four bills and an MP in the Whig majority could not vote against the Whig position on any of the four. Suppose alternatively that an MP only needed to vote with the Whigs on more than half of the four bills, say three of four or two of three, to be classified as a Whig majority MP. In this case, the size of the majority increases from 48.7 to 52.3 percent.
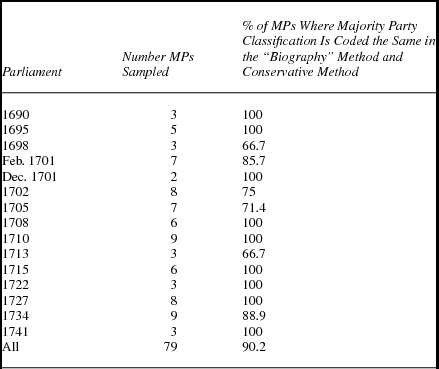
Another way of checking the assumptions is to compare my coding with a classification based on the biographical entries in the House of Commons series edited by Cruickshanks et al. and Sedgwick. A 1 percent random sample of MPs was drawn and, based on my reading of the biographies in Cruickshanks et al. and Sedgwick, an MP was identified as a Whig, Tory, or unclassified. Then the MP was assigned to the majority party depending on whether the Whigs or Tories had the majority in that Parliament according to table 1. I implemented this “biography” method without consulting the baseline coding of the MPs to ensure the biographical information gave an independent source of information. Table 3 shows the number of MPs sampled in each Parliament and the percent of MPs that were coded similarly in the two methods. For 90 percent of MPs, the coding is the same. The upshot is that my method does not give substantially different results from the more exhaustive approach of reading and interpreting every biographical entry in the House of Commons.
Coding of majority party representation using biographical entries

Sources: See text.
Party Representation across Constituencies
The size of the majority party was ultimately determined by voters and patrons in constituencies. Much like modern democracies, some constituencies in this period were more favorable to one party over the other. In this section, I present data showing which constituencies were more strongly represented by the Whigs and the same for the Tories. Also reported are new estimates on the number of safe seats for each party and how many constituencies regularly swung between the two parties.
Party strength in a constituency is measured by three variables for each Parliament. The first variable is called “majority strength Whig.” It measures the average fraction of MPs with the majority party in parliaments where the Whigs were in the majority. The average is calculated over all MPs (most constituencies have two) and all months in a Parliament. The second variable is called “majority strength Tory.” It equals the average fraction of MPs with the majority party in parliaments where the Tories were in the majority. As an example, at the beginning of January 1713 the borough of Chester had one of its two MPs with the majority Tories. The same two MPs represented Chester throughout the 1713 Parliament so Chester's value for majority strength Tory is 0.5 in the 1713 Parliament. In the 1695 Parliament, Chester started with one of its two MPs with the majority Whigs. In January 1698 one of Chester's MPs died. The new MP was not classified as a Whig so the fraction of MPs with the Whigs fell to zero in that month. Across all months in the 1695 Parliament, the average fraction of MPs with the majority party Whigs in Chester was 0.406. Thus the value for majority strength Whig is 0.406 in the 1695 Parliament.
The third variable measuring party strength is simply called “Whig strength.” It equals the variable majority strength Whig in parliaments where the Whigs were in the majority and one minus the variable majority strength Tory in parliaments where the Tories were in the majority. Thus Whig strength combines the previous two variables into a single index ranging between zero and one, summarizing the strength of Whig versus Tory representation in a constituency.Footnote 6 An analogous variable for Tory strength could be calculated, but it provides no new information, as it equals one minus Whig strength. Readers should note that in calculating Whig strength an assumption is made. In a Parliament with a Tory majority an MP that is not a Tory is identified as a Whig. However, some MPs may have been independent rather than being Whigs. Thus the existence of independent MPs will bias the true value of Whig strength upward when the Tories are in the majority. When the Whigs are in the majority there is no bias as independent MPs will be correctly identified as not Whig.
For the interested reader, online appendix table 1 lists majority strength Whig, majority strength Tory, and Whig strength for each constituency averaged across all parliaments from 1690 to 1747. Summary statistics indicate that majority strength Tory is higher than majority strength Whig indicting that Tories had higher party strength on average. As expected, majority strength Tory is negatively correlated with majority strength Whig and the composite variable Whig strength. Some examples illustrate the measures. Lyme Regis, a borough in Dorsetshire, was a Whig stronghold. It had a high value for majority strength Whig and a low value for majority strength Tory. Eye, a borough in Suffolk, has a slightly higher value for majority strength Whig than Lyme Regis but its value for Whig strength is lower because its majority strength Tory was higher than zero. At the other extreme was Denbigshire in Wales. It was a Tory stronghold and had Tory MPs in all parliaments where the Tories were in the majority. It briefly had one MP classified as a Whig in the 1741 Parliament. Its value of majority strength Tory is one, while its values for majority strength Whig and Whig strength are close to zero. Hertford, a borough in Hertfordshire, is an example of a swing constituency. Its value for majority strength Tory and Whig are both high at 0.766 and 0.82. It was a constituency that generally had MPs with the majority party, irrespective of whether the Tories or Whigs were in the majority.
The party strength variables help to identify the degree of competition in Britain's party system, which is a significant characteristic of any country's political institutions.Footnote 7 Speck (Reference Speck1970: 64–65, 121–22) focuses on the period from 1701 to 1713 and argues that the number of “safe” seats for either party was relatively small. Speck estimates there were 89 constituencies where the Tories held at least one seat in all parliaments from 1701 to 1713 and 60 constituencies where the Whigs had at least one seat in all parliaments. In total, then, 55 percent of the constituencies were safe by this definition. By comparison, Speck notes that from 1955 to 1965 more than 72 percent of constituencies always returned a Conservative MP or a Labour MP to the Commons. Speck's concludes that the “floating vote,” which changes its mind from one election to the next, was quite large in early-eighteenth-century Britain (ibid.: 25).
Unfortunately, Speck does not explain the methods used to classifying the party affiliation of MPs and constituencies and so it is difficult to evaluate these claims about the degree of political competition. I revisit this issue using my new data. I define an indicator variable: “Tory Safe.” It equals one if majority strength Tory is at least 0.5 in every Tory majority Parliament from 1701 to 1713 and majority strength Whig is no more than 0.5 in every Whig majority Parliament from 1701 to 1713. Otherwise Tory Safe is zero. Similarly, Whig Safe is one if majority strength Whig is at least 0.5 in every Whig majority Parliament and majority strength Tory is no more than 0.5 in every Tory majority Parliament. Online appendix tables 2 and 3 list safe seats for interested readers. Overall I find there were 103 safe seats from 1701 to 1713, 62 for the Tories and 41 for the Whigs totaling 38 percent of all constituencies. The new counts of safe seats are less than Speck. The most likely reason is that I require MPs to have a consistent voting record to be classed with the majority Whigs or Tories.Footnote 8
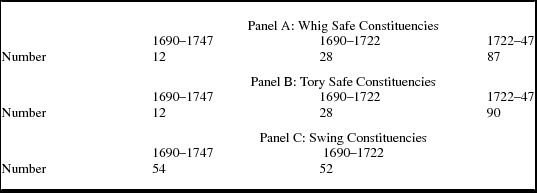
Using a similar method, I also classify safe seats in three other periods, 1690–1747, 1690–1722, and 1722–47. The second period generally corresponds to the Rage of Party and the third covers the main period of Walpole's time as prime minister. The results are shown in table 4. There were relatively few safe seats for the Whigs or Tories from 1690 to 1747. That is to be expected because it covers 15 parliaments, and therefore 15 elections. In the two subperiods the number of safe seats rises for both parties, especially from 1722 to 1747 where the number of safe seats is 87 for the Whigs and 90 for the Tories, totaling 66 percent of all constituencies. The Walpole era looks to be fairly similar to modern democracies where two-thirds or more of constituencies are safe for one party.Footnote 9 The Rage of Party period is more exceptional with relatively few seats being safe for either party.
Summary of constituencies that were safe and swing

Sources: See text.
The party strength variables also help to identify “swing” constituencies. I classify a constituency as swing if majority strength Tory and majority strength Whig are both at least 0.5 for 12 or more parliaments from 1690 to 1747. Otherwise swing is zero. Note that there are 15 parliaments in total so 12 out of 15 would represent 80 percent of all parliaments. During the Rage of Party period, Swing is one if majority strength Tory and majority strength Whig are both at least 0.5 for nine or more parliaments from 1690 to 1715. All swing constituencies are listed in online appendix table 4. A summary count is shown in panel C of table 4. The number of swing constituencies is smaller than safe seats, totaling 54 or 20 percent of all constituencies from 1690 to 1747. The number of swing constituencies is similar during the Rage of Party (52) from 1690 to 1722.
Taking the safe and swing figures together, I find that 40 percent of the constituencies can be classified as safe or swing between 1690 and 1722. The remaining constituencies had a variety of outcomes. Some favored one party for a few parliaments, and then not. Some swung between the two parties for a few parliaments and then settled on a party for a period. The relatively high number of these constituencies in the 1690 to 1722 period testifies to the fluidity of the political system during the Rage of Party, and bolsters Speck's argument for a large floating vote. The next section examines various theories on which types of constituencies were safe for either party and which tended to swing between the parties.
Party Strength by Constituency Type
The literature makes several claims about which types of constituencies were generally represented by Whig and Tory MPs. The Whigs are thought to be strongest in municipal boroughs, especially those with a small electorate, while the Tories were strongest in counties and boroughs with a larger electorate. The reasoning is that the majority of the populace and voters were likely to be sympathetic to the Tories (Hill Reference Hill1976: 154). Therefore, in the counties, the Tories had a natural advantage because the franchise was broadly held. Any freeholder in a county possessing property worth more than 40 shillings a year had the right to vote. The same argument applies to the more democratic boroughs where shopkeepers, craftsman, and smaller merchants had greater voice and generally supported the Tories (Speck Reference Speck1970: 47–63).
The Whigs were different from the Tories in that they drew support from aristocrats and the financial interests. As a result, in some cases the Whigs had to focus their efforts on consistencies where they could buy votes, like boroughs with a small electorate. As Plumb (Reference Plumb1967: 139) explains, “the Whigs realized quickly enough that they were a minority. . .. Their greatest strength lay in their territorial magnificence, enabling them to influence elections out of proportion to their numbers.” Whig electioneering is thought to have been exceptionally strong in the Walpole era (O'Gorman Reference O'Gorman1989: 14). A prominent example is London, where urban radicalism was quelled by the remodeling of the City's charter in 1725. Even though some voters were disenfranchised in 1725, Opposition Whigs soon became prominent in the city and among its MPs (Cruickshanks Reference Cruickshanks and Black1984: 39). Party representation in other large and democratic boroughs is less clear, but there are indications that the Walpole Whigs struggled to find support, even if they resorted to remodeling and related tactics (Rogers Reference Rogers1989).
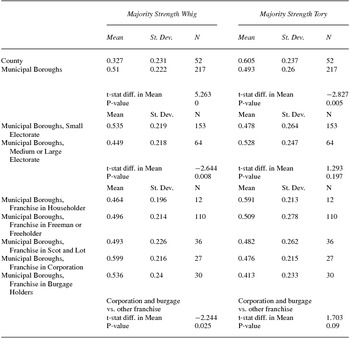
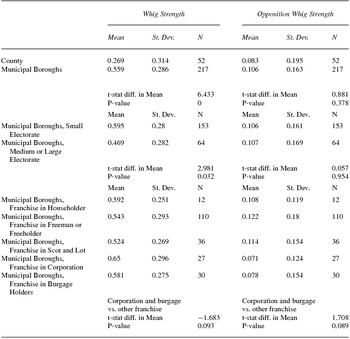
In this section, I examine these previous arguments using the constituency party strength indices and the electoral characteristics of constituencies provided in Cruickshanks et al. (Reference Cruickshanks, Handley and Hayton2002) and Sedgwick (Reference Sedgwick1970). It is useful to begin with the differences in party strength across the two general types of constituencies: counties and municipal boroughs. The first set of rows in table 5 report the means of majority strength Whig and majority strength Tory for counties and municipal boroughs across all parliaments from 1690 to 1747. The next two rows show the t-statistic and p-value testing for the difference in means. One immediate finding is that Whig strength is 0.166 higher for municipal boroughs compared to counties. The difference is statistically significant. The opposite pattern is found for Tory strength with county constituencies having a significantly higher value.
Majority strength by borough or county

Note: For variable definitions see text.
There is further evidence for differences between the parties in boroughs with small electorates. I use Sedgwick's (Reference Sedgwick1970: 116–22) classification of boroughs as having small, medium, or large electorates in the early eighteenth century. Sedgwick states there were 153 boroughs with small electorates and 64 with medium or large electorates. The difference in means for boroughs with small electorates compared to medium or large electorates is reported in the middle panel of table 5. The mean for Whig strength is 0.086 higher in boroughs with small electorates and is statistically significant. The mean for Tory strength was higher in boroughs with medium or large electorates, but the difference is small and not statistically significant. It was more the case that the Whigs were strong in boroughs with small electorates than the Tories were weak in these constituencies.
The legal nature of the franchise is a related dimension revealing differences between the two parties. Boroughs where the franchise was held by corporation members or burgage holders usually had a relatively narrow or oligarchical electorate. Corporation members could be restricted to a small group of families. Burgage holders were individuals who had the right to vote because they owned a specific piece of property in the borough. These properties were often scarce and were purchased almost entirely because they conferred the right to vote. By comparison, the electorate was usually broader or more democratic if the franchise was held by freeholders, freeman, or households. Freeholders included small and medium landowners. Freeman often included shopkeepers and guildsman and thus a broader segment of borough inhabitants. Households were the most encompassing category of all. Scot and Lot boroughs occupy a mixed category as the franchise was restricted to households who paid local taxes.
Sedgwick's (Reference Sedgwick1970: 116–22) classification of boroughs by franchise type is used to investigate the differences in majority party strength. Whig strength is significantly greater in boroughs where the franchise was held by corporation and burgage holders compared to other boroughs. The opposite pattern holds for Tory strength. The Tories were significantly stronger in boroughs where the franchise was held by households, freeman, freeholders, or by Scot and Lot.
The differences in party representation when Walpole was the prime minister are shown in table 6. The first columns report Whig strength for parliaments in the 1722 to 1747 period. As in the 1690 to 1722 period, the Whigs were stronger in municipal boroughs with small electorates and where the franchise was held by corporations and burgage holders. However, note that the differences between corporation and burgage holder boroughs and the rest are smaller than in the Walpole period. The strength of Opposition Whigs in parliaments from 1722 to 1747 is also shown in table 6 for comparison. The Opposition Whigs were similarly strong in boroughs compared to counties, and they were not any stronger in boroughs with small electorates compared to medium or large electorates. The Opposition Whigs were strongest in boroughs where the franchise was held by households, freeman, freeholders, or by Scot and Lot. Notice the similarity between Opposition Whig strength and Tory strength in terms of consistency types. In the larger and more democratic boroughs the Tories were better represented during the Rage of Party, and later in the Walpole era the Opposition Whigs had strength here too.
Whig strength and opposition Whig strength in the Walpole era

Note: For variable definitions see text.
Interestingly the franchise and the size of the electorate were not significantly linked to the likelihood of a constituency swinging between the parties. In results that are omitted for space reasons the mean for the swing indicator variable is slightly larger in smaller electorates than medium or large electorates, but the difference is not significant. Also the mean for swing is larger in boroughs where the franchise is defined by corporate and burgage status, but again the difference is not significant. There is a difference in swing for counties and municipal boroughs overall. Boroughs are significantly more likely to be classified as swing.
Party Strength across Regions
Economic interests and political traditions vary across space and the Whigs and Tories are thought to have been stronger in certain regions. According to Speck (Reference Speck1970: 67), the Tories were stronger in Wales and western England, in part because these regions were bastions of the Royalist cause during the civil war. Speck goes on to argue that the two parties were evenly matched in northern England, but the Whigs had a slight advantage in southern and eastern England. The financial interests were concentrated in London and the Southeast, and as the Whigs were linked with finance they potentially had an advantage in this region. There were also port and naval cities in the Southeast that likely benefitted from the Whig's more aggressive stance on foreign policy.
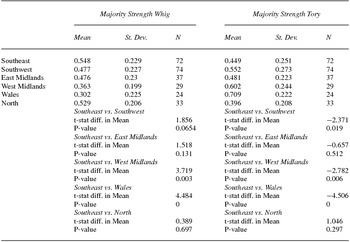
I examine the regional strengths of the parties using the new variables for Whig and Tory strength between 1690 and 1747. Constituencies are assigned to five regions plus Wales based on the county.Footnote 10 The differences in regional means for majority strength Whig and Tory are reported in table 7. Whig strength is highest in the Southeast and the North. It is lowest in Wales and the West Midlands. The Southwest and East Midlands are close to the national average but still below the Southeast. Tory strength shows the opposite pattern being low in the Southeast and North and highest in Wales. The bottom of table 7 shows that the difference between Whig strength in the Southeast and other regions is statistically significant except for the North and East Midlands. Tory strength is also statistically different in the Southeast compared to other regions except for the North and East Midlands.
Majority strength by region

Note: For variable definitions see text.
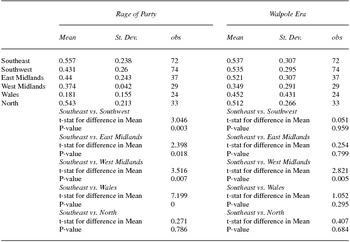
The regional concentration of Whig strength was less pronounced in the Walpole era (1722–47) compared to the Rage of Party (1690–1722). A summary of the regional patterns in each period is shown in table 8. Strikingly, the Whigs lost some strength in the Southeast and North during the Walpole era, and gained strength in the Southwest, East Midlands, and Wales. The West Midlands is the only region where the Whigs continued to have a weak presence in the Walpole era. The shifting patterns of regional strength are further evidence that the Whigs were becoming an oligarchical party after 1722. When parties appeal to the electorate there are often regional differences in party strength as policy preferences naturally differ across regions. But when parties appeal to a few powerful individuals to nominate their party members, then it is likely their party strength will be more evenly distributed across regions, as powerful individuals are more mobile and can buy seats in many locations.
Whig strength by region in the Rage of Party and Walpole era

Note: For variable definitions see text.
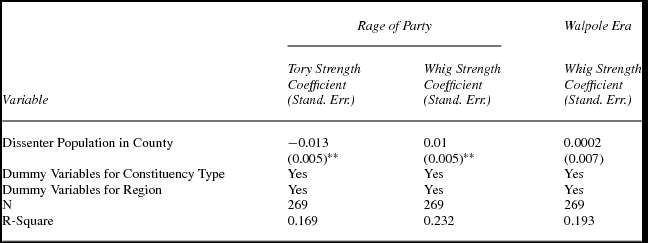
The changing nature of the Whig Party after 1722 is further illustrated by the relationship between Whig strength and the concentration of the “Dissenting” population. In the literature, the Tories are often described as being strongly allied with the Church of England and the Whigs were more closely connected to what were called Dissenter groups, like the Presbyterians, Baptists, and Quakers (Harris Reference Harris1993: 144). If so, then one would expect that Whig strength should be higher in areas where the Dissenter population was large and Tory strength should be lower. I test for this pattern using Watts's (Reference Watts1978) estimates for the percent of the population who were Dissenters in a county during the early eighteenth century. The Dissenter percentage in each county was matched to its county constituency and to the municipal boroughs by the county of location. A regression model is used to control for regional and constituency type effects. The expected connection between Whig and Tory party strength and the dissenting population is found during the Rage of Party (see table 9). In column 1 the Dissenter population is negatively and significantly correlated with Tory strength, and in column 2 the Dissenter population is positively and significantly correlated with Whig strength. A very different relationship is evident in column 3. It shows no significant relationship between the Dissenter population and Whig strength in the Walpole era. This finding is consistent with historians who argue that the Whig Party moved away from its original party principles under Walpole. According to Plumb (Reference Plumb1967: 179) Walpole was aware of the strong support for the Church of England in Parliament, and dexterously evaded all pressure from Dissenters to change the status quo.
The connection between Dissenters and majority strength

Source: For percent of dissenter population see Watts (Reference Watts1978: 509–10).
Note: Robust standard errors are reported.
*, **, and *** represent statistical significance at the 10 percent, 5 percent, and 1 percent level, respectively.
Electoral Contests and Majority Party Strength in Constituencies
Electoral contests are one of the most prominent features of Britain's politics in the first half of the eighteenth century. The frequency of contests peaked in this period when between one-third and one-half of constituencies had them. Contested elections were especially common in urban boroughs and in the Southeast (O'Gorman Reference O'Gorman1989: 107; Rogers Reference Rogers1989: 231–56). Historians view contests as moments where voters could express their preferences and implement political change. O'Gorman explains that contests happened for several reasons (Rogers Reference Rogers1989: 113–16). The patron of a constituency, who usually selects the MP out of tradition, could show himself to be incapable of providing leadership to his interest thus opening the door for an entrant to the seat. Another possibility is that voters lose confidence in their patron, again opening the door for an entrant. Yet another possibility is that rival organizations and associations in a constituency regularly challenge one another at elections.
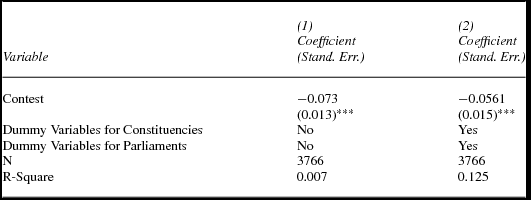
While contests have long been discussed, their effects on party representation have never been established. I use the new data presented here to study whether contests changed party representation in constituencies, particularly the share of seats gained or lost by the majority party following an election. I start by defining variables for majority strength Whigit or majority strength Toryit equal to the average fraction of MPs with the Whigs or Tories in Parliament t depending on which party has the majority in t = 1690, 1695,. . . 1741. I then calculate my estimate for the share of seats held by the same party in Parliament t+1. For example, if the Whigs are in the majority in Parliament t and t+1 then the change in the share of seats for the majority party is simply majority strength Whigit+1 - majority strength Whigit . If the Whigs are in the majority in t and the Tories are in the majority in t+1 then the change in the share of seats held by the majority is (1 - majority strength Toryit+1 ) - majority strength Whigit . Notice that I must make the assumption that one minus Tory strength is equal to the share of seats held by Whigs in Parliament t+1. The resulting construction yields a series of variables called change majority seat shareit+1 for each constituency in all parliaments t+1=1695, 1698,. . . 1741. My hypothesis is that change majority seat shareit+1 decreased if constituency i had a contest in Parliament t+1. The baseline estimating question is
 $$\begin{equation*}
\it change\ majority\ seat\ shar{e_{it+1}} = \beta contest_{{it+1}}+{\varepsilon _{it+1}}\end{equation*}$$
where contestit+1 is an indicator if there is a contest in constituency i in Parliament t+1 and ε it+1 is the error term.Footnote 11 Using the panel structure, I also run some regressions exploiting the within-constituency variation in contests. In such specifications the estimating equation is:
 $$\begin{equation*}
change\ majority\ seat\ shar{e_{it+1}} = \beta contes{t_{it+1}}+{\alpha _i}+{\delta _{t+1}}+{\varepsilon _{it+1}}
\end{equation*}$$
where α i is a vector of constituency fixed effects (equal to one for a constituency and zero for all others) and δ t+1 is a vector of Parliament (or time) fixed effects (equal to one for each Parliament and zero for all others).
The results are shown in table 10. In column 1 without constituency and Parliament fixed effects the results suggest that contests reduced the share of seats held by the majority party by 0.07, which is about 16 percent of a standard deviation for change majority seat shareit . With constituency and Parliament fixed effects, the results are smaller in magnitude but still negative and significant. Here the estimates imply that when a constituency has a contest the share of seats held by the majority party falls by 0.0561 or 13 percent of a standard deviation. These findings suggest that contested elections affected the composition of the House of Commons. Voters and parties in the opposition could change the status quo if they invested the time and money in contesting elections.
The connection between contests and changes in majority party strength

Note: Robust standard errors are reported.
*, **, and *** represent statistical significance at the 10 percent, 5 percent, and 1 percent level, respectively.
Conclusion
Political parties were central to Britain's politics in the late seventeenth and early eighteenth centuries. While parties have garnered much attention in the literature, much is still unknown. One of the constraints in this literature is the absence of a comprehensive and accessible database on party representation among MPs and in electoral constituencies. This article builds on the House of Commons series and presents new data on the party affiliation of every MP in England and Wales in all parliaments from 1690 to 1747. As noted, there are several challenges in assigning MPs to parties. Perhaps the most difficult problem is cross-voting by MPs leaning to one party. The methodology here draws on multiple division lists and sources in each Parliament and aims to provide a conservative classification of party affiliation. By outlining the methods, I encourage other scholars to refine or improve upon the approach used here.
The new data on MP party affiliation have numerous applications for research on Britain's politics, economy, and society. Here I provide a series of new variables measuring Whig strength and Tory strength in all English and Welsh constituencies. I also classify which constituencies were safe for the Whigs or Tories, and which tended to swing between the parties when they were in the majority. The resulting variables show a high degree of political competition and fluidity in Britain's political system. There were relatively few safe seats in England and Wales. A few swung between the parties, but many had connections with one party for a period of time, before shifting to the other.
This article also offers new evidence on where and in which types of constituencies the Whigs and Tories drew their electoral strength. I show that the Whigs were stronger in municipal boroughs with small and narrow electorates and that the Tories were stronger in county constituencies and in boroughs with large and broad electorates. I also confirm that the Tories were strongest in Wales and Western England, whereas the Whigs had an advantage in the Southeast and North. There were also changes in the regional strengths of the two parties after 1721 when Walpole came to power. Whig strength became more uniform across regions and weakened in counties with dissenting populations. Overall the findings support the view that the Whigs were strongest in oligarchical constituencies and Tories were strongest in more democratic constituencies.
The last application in this article studies electoral contests. For the first time in the literature, I analyze how contests affected the strength of the majority party in a constituency. The data show that when contests occurred, the majority party often lost strength in the resulting election. Therefore, voters in Britain's political system had some ability to challenge the traditional selection of candidates by local patrons and the party in power.
There are numerous applications of the party affiliation data that future research will uncover. One of the most exciting concerns local and personal acts, which exploded in number after 1690. The prevailing assumption in the literature is that these acts were not influenced by party (Harris Reference Harris1993: 151). However, this view has never been tested and, as Black (Reference Black1990: 91) argues, the extent to which local government and politics were distinct and independent may be less than has been believed hitherto. The basis for testing this and numerous other hypotheses concerning Britain's political economy is a database on the party strengths of constituencies. The GIS files for constituencies accompanying this article and the party classification of individual MPs should open new avenues for research in English and Welsh history.
Supplementary material
To view supplementary material for this article, please visit http://dx.doi.org/10.1017/ssh.2016.4.