I. INTRODUCTION
Driven by the development of automotive radars, millimeter-wave measurement systems are already in use in different commercial applications, with a current focus on long-range and mid-range applications. But also short-range applications for automotive and industrial applications, such as parking aid [Reference Weidmann and Steinbuch1] or machine tool positioning [Reference Bauer2], might be implemented with radar technology due to its robustness against environmental influences. Although influences such as mud, salt, ice as well as dirty environment or extreme temperatures – as they typically occur in automotive or industrial applications – affect the radar measurement performance, radar systems are more robust compared to optical or ultrasonic technology. One of the main challenges to make radar sensors applicable to very short-range applications is the reduction of the radar's so-called blocking distance (also known as dead zone). For various applications range measurements down to a few centimeters need to be possible. Therefore signals with a very high bandwidth are required which allows to separate target responses from direct crosstalk between transmit (TX) and receive (RX). Most of the known radar techniques can be used to realize wideband systems; however in this work, we focus on the frequency-modulated continuous-wave (FMCW) principle. Since this principle is already widely used in automotive applications, many components are already available for such radars, which is an advantage from a realization point of view.
FMCW radars are typically realized in a homodyne configuration leading to a simple system setup. However, for short-range applications the zero-intermediate frequency (IF) architecture leads to problems, since, due to the FMCW principle, frequencies of IF signals from nearby targets are very low and superpose with dc-offsets from the RX mixer and components such as IF-amplifiers and analog-to-digital converters (ADCs). Furthermore, the IF-chain needs to be dc-coupled which complicates the design of this stage. Increasing the radar signal's bandwidth and decreasing the ramp duration would lead to higher IF signal frequencies. However, the usable bandwidth is limited both by legal regulations as well as by signal generation hardware restrictions. Especially fast chirps with a large bandwidth are difficult to generate with a linear frequency course as it is required for accurate FMCW systems. Therefore, different research groups have presented various solutions to modify FMCW radars in order to shift the IF signals away from dc while keeping parameters such as bandwidth and ramp duration unchanged. Examples for analog implementations are systems based on different voltage-controlled oscillators (VCOs) in the TX and RX path of the radar, which are operated at differing frequencies. Such solutions can be extended by techniques to reduce the influence of phase noise which is uncorrelated in the TX and RX VCOs [Reference Musch and Schiek3–Reference Dao, Shin, Im and Park7]. However, the increased power consumption of two VCOs remains as a drawback. Alternatively also frequency multipliers with differing multiplication factors can be used to implement a frequency shift of the radar's IF signal [Reference Cooper, Dengler, Llombart, Thomas, Chattopadhyay and Siegel8], but these solutions often operate at relatively high offset frequencies to avoid large multiplication factors. Examples for digitally generated frequency shifts are the systems based on switched on–off modulation [Reference Saito, Okubo, Kawasaki, Isaji and Suzuki9] or in-phase/quadrature (I/Q) modulator-based single sideband (SSB) modulation [Reference Feger, Wagner and Stelzer10, Reference Feger, Wagner and Stelzer11]. These systems offer the possibility of coherently operating radio frequency (RF) signal generation, modulation and analog-to-digital conversion. Therefore, no uncorrelated noise sources are added to the system. In [Reference Feger, Ng, Pfeffer and Stelzer12] a different solution for digital offset frequency generation was presented. The approach from [Reference Feger, Ng, Pfeffer and Stelzer12] is based on a binary phase-shift keying (BPSK) modulator in the TX path which is driven by a ΔΣ sequence. Compared to [Reference Saito, Okubo, Kawasaki, Isaji and Suzuki9] the proposed approach reduces switching harmonics by ΔΣ noise-shaping. Furthermore, the hardware setup is simplified compared to [Reference Feger, Wagner and Stelzer10, Reference Feger, Wagner and Stelzer11] since no digital-to-analog converter (DAC) or I/Q modulator is required. Due to the latter, there is no need for calibrating possible I/Q imbalances. Using sinusoidal modulations with moderate frequencies, it is possible to reuse existing well-proven signal processing blocks which are typically available in FMCW systems. As will be shown by deriving the signal model, the behavior of the heterodyne radar, with respect to resolution or range-Doppler coupling, is equivalent to a conventional homodyne implementation with the only difference being the frequency shift of the IF signals. First experiments with such a system were already presented in [Reference Feger, Ng, Pfeffer and Stelzer12]. In the following, we will present a more detailed derivation of the signal model, a characterization of the TX signal and experiments demonstrating the measurement performance at short measurement distances below 1 m.
II. SYSTEM DESCRIPTION
The proposed system setup is based on a conventional FMCW architecture which is extended by building blocks that can be used to implement a configurable frequency shift of the 77-GHz TX signal. Main objectives during system design were an easy and cost-effective realization as integrated circuit, broadband operation, and compatibility to the FMCW principle. The latter is achieved by a sinusoidal modulation with a moderate modulation frequency in the range of the typical FMCW IF signal frequencies – usually in the kHz to MHz range. This allows to reuse existing FMCW hardware components and frequency-domain signal processing techniques. To avoid an analog upconversion mixer in the TX path, the modulation of the TX signal is realized using an easy to integrate BPSK modulator which is controlled by a ΔΣ sequence derived from a digitally generated sinusoid. The BPSK modulator can be interpreted as 1-bit DAC with multiplier. The resulting quantization noise is shaped by a ΔΣ modulator such that it can be easily filtered out in the IF stage.
A) System architecture
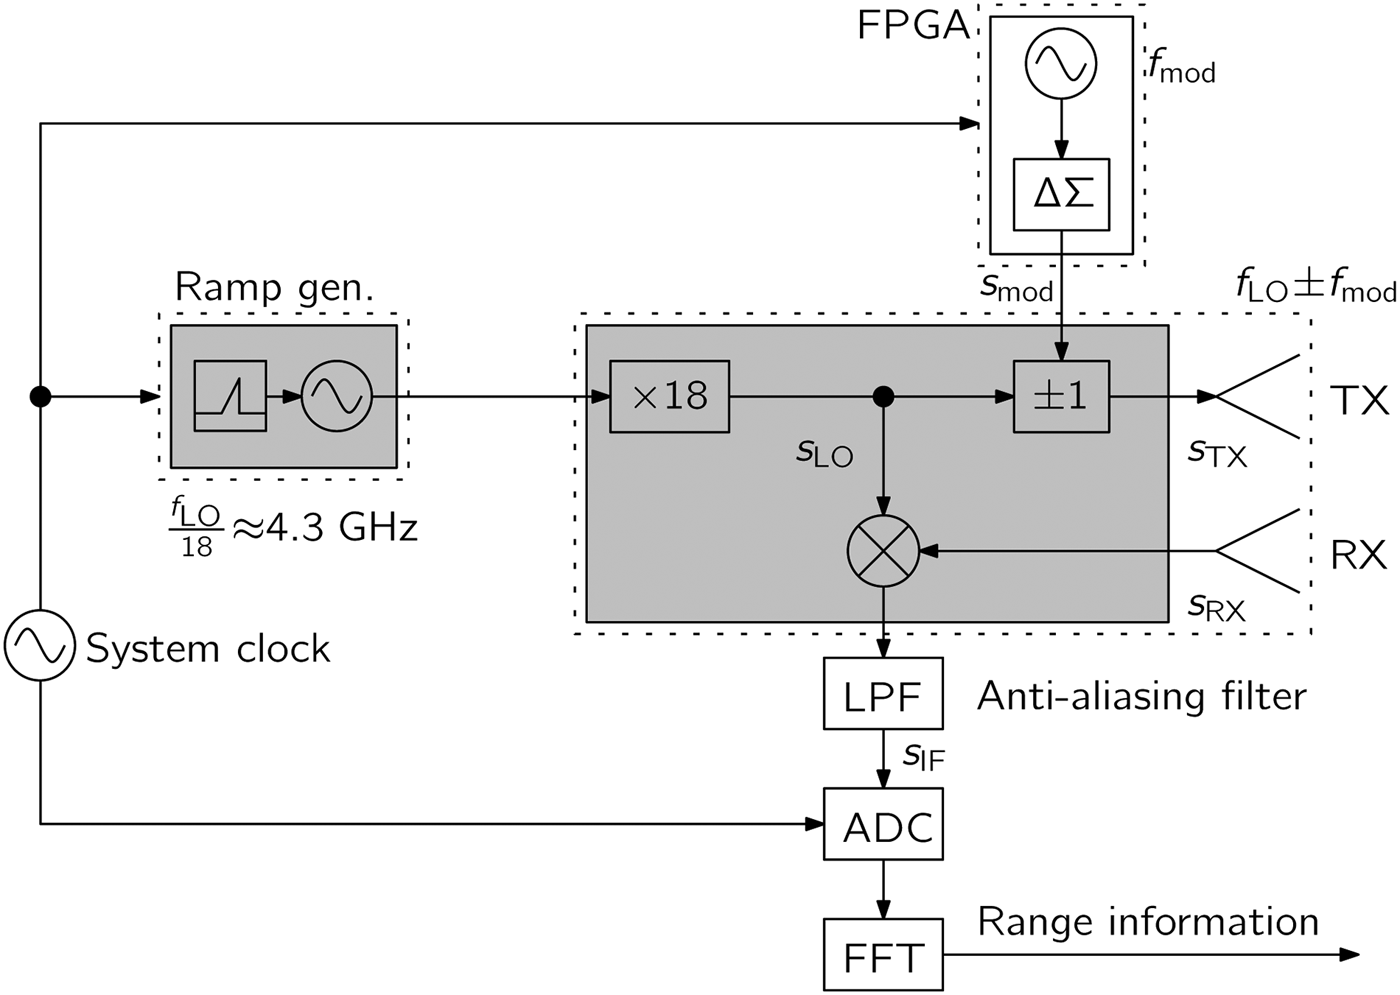
The system setup, as proposed in [Reference Feger, Ng, Pfeffer and Stelzer12], is shown in Fig. 1. Compared to a conventional FMCW radar, only small modifications need to be implemented in order to realize the desired frequency shift of the TX signal. Only the BPSK modulator is inserted into the RF path of the radar. The ΔΣ sequence, which controls the BPSK modulator, is derived from a digitally generated sinusoid using a ΔΣ modulator implemented within a field-programmable gate array (FPGA) that is also used for controlling sampling, data transfer, etc. The generation of the broadband linear frequency sweep is based on a phase locked loop (PLL)-stabilized VCO in combination with a frequency multiplier. As shown in [Reference Ng, Fischer, Feger, Stuhlberger, Maurer and Stelzer13] such a setup allows to realize large modulation bandwidths. Only the small frequency shift of the TX signal is implemented using the BPSK modulator which allows large oversampling ratios and consequently little in-band noise within the IF signal. The shaped ΔΣ noise is filtered out by the anti-aliasing filter prior to the ADC. As shown in Fig. 1 the whole system can be coherently operated from a single clock source, which means that no uncorrelated phase noise components are introduced into the system.
Sketch of the proposed system architecture (extended from [Reference Feger, Ng, Pfeffer and Stelzer12]). Only a BPSK modulator is inserted into the TX path of the radar.

B) Signal model
The E-band local oscillator (LO) signal s LO(t) is a linearly frequency-modulated sinusoid described by
 $$s_{LO} \lpar t\rpar =A_{LO} \cos \left({2\pi \left({f_0 t+\displaystyle{{k_r } \over 2}t^2 } \right)+\varphi _0 } \right)\comma \;$$
with the continuous time t, the signal amplitude A LO, f 0 denoting the starting frequency of the linear chirp, k r its slope and φ 0 the initial phase of the LO signal. Prior to transmission the BPSK modulator multiplies s LO(t) by a ±1 sequence. This sequence s mod(t) is generated from a digital input signal by the ΔΣ modulator and can thus be described as a sum of a desired analog signal and ΔΣ noise denoted as N ΔΣ(t). In this work, a sinusoidal modulation with amplitude 1 is desired, which is described as
 $$s_{mod} \lpar t\rpar = \cos \left({2\pi f_{mod} t+\varphi _{mod} } \right)+N_{\Delta \Sigma } \lpar t\rpar.$$
In (2) f mod denotes the chosen modulation frequency, whereas φ mod is the initial phase of the modulating signal. Now, the TX signal can be calculated from (1) and (2) as
 $$\eqalign{s_{TX} \lpar t\rpar & =s_{LO} \lpar t\rpar s_{mod} \lpar t\rpar \cr& =\displaystyle{{A_{LO} } \over 2}\left({\cos \left({2\pi \left({f^+t+\displaystyle{{k_r } \over 2}t^2 } \right)+\varphi ^+} \right)}\right.\cr \quad &\quad\left.{ +\cos \left({2\pi \left({f^ - t+\displaystyle{{k_r } \over 2}t^2 } \right)+\varphi ^ - } \right)} \right)+N_{\Delta \Sigma\comma TX} \lpar t\rpar \comma \; }$$
with the abbreviations  $f^ +=f_0+f_{mod}\comma \; \, f^ -=f_0 - f_{mod}\comma \; \, \varphi ^ +=\varphi _0+\varphi _{mod}\comma \; \, \varphi ^ -=\varphi _0 - \varphi _{mod} $, and
 $N_{\Delta \Sigma\comma TX} \lpar t\rpar =s_{LO} \lpar t\rpar N_{\Delta \Sigma } \lpar t\rpar $. From (3), it can be seen that two tones with frequencies f + and f −, each with half the LO amplitude, are transmitted. This signal s TX(t) is radiated toward a target, which reflects a portion of the signal back to the radar. For target distance r and constant target velocity v the corresponding time-dependent delay τ(t) can be calculated as
 $$\tau \lpar t\rpar =2\lpar r+vt\rpar /c_0.$$
The signal s RX(t) received at the radar is a damped and time delayed version of the transmitted signal which can be written as
 $$s_{RX} \lpar t\rpar =A_{RX} s_{TX} \lpar t - \tau \lpar t\rpar \rpar \comma \;$$
where the signal attenuation is taken into account by the amplitude A RX. Assuming φ mod = 0 the low-pass filtered output of the RX mixer can be calculated. Owing to the low-pass filter, signal components with frequencies around 2f 0 and, as will be shown later, also the ΔΣ noise  $N_{\Delta \Sigma\comma IF}=s_{LO} \lpar t\rpar s_{LO} \lpar t - \tau \lpar t\rpar \rpar N_{\Delta \Sigma }\lpar t\rpar $ are filtered out. Thus, the IF signal can be written as
 $$\eqalign{s_{IF} \lpar t\rpar & =A_{RX} s_{TX} \lpar t - \tau \lpar t\rpar \rpar s_{LO} \lpar t\rpar \cr & =\displaystyle{A_{IF} \over 2}\left(\cos \left(2\pi \left(f_{mod} t - f_0 \tau \lpar t\rpar - f_{mod} \tau \lpar t\rpar \right. \right. \right. \cr &\left. \left. \left. \quad - \displaystyle{k_r \over 2}\lpar 2t\tau \lpar t\rpar - \tau ^2 \lpar t\rpar \rpar \right) \right) \right)\cr & \quad +\displaystyle{A_{IF} \over 2} \left( \cos \left(2\pi \left( - f_{mod} t - f_0 \tau \lpar t\rpar +f_{mod} \tau \lpar t\rpar \right. \right. \right. \cr &\left. \left. \left. \quad - \displaystyle{{k_r } \over 2}\lpar 2t\tau \lpar t\rpar - \tau ^2 \lpar t\rpar \rpar \right) \right) \right).}$$
For the chosen modulation frequencies and the applications aimed at in this work terms τ 2(t)k r/2≪π as well as f modτ(t)≪π can be neglected which results in
 $$\eqalign{s_{IF} \lpar t\rpar \approx & \displaystyle{{A_{IF} } \over 2}\lpar \cos \lpar 2\pi \lpar f_{mod} t - f_0 \tau \lpar t\rpar - k_r t\tau \lpar t\rpar \rpar \rpar \rpar \cr \quad & +\displaystyle{{A_{IF} } \over 2}\lpar \cos \lpar 2\pi \lpar f_{mod} t+f_0 \tau \lpar t\rpar +k_r t\tau \lpar t\rpar \rpar \rpar \rpar .}$$
Inserting τ(t) from (4) into (7) and neglecting 2k rvt 2/c 0≪π leads to
 $$\eqalign{s_{IF} \lpar t\rpar \approx & A_{IF} \left({\cos \left({2\pi \left({f_{mod} t - \left({f_0 \displaystyle{{2v} \over {c_0 }}+k_r \displaystyle{{2r} \over {c_0 }}} \right)t - f_0 \displaystyle{{2r} \over {c_0 }}} \right)} \right)} \right)\cr \quad &+A_{IF} \left({\cos \left({2\pi \left({f_{mod} t+\left({f_0 \displaystyle{{2v} \over {c_0 }}+k_r \displaystyle{{2r} \over {c_0 }}} \right)t+f_0 \displaystyle{{2r} \over {c_0 }}} \right)} \right)} \right).}$$
It can be seen that the radar output consists of two tones containing information about target range and velocity in the range-dependent frequency f r(r) = 2k rr/c 0 and the velocity-dependent Doppler frequency f D(v) = 2f 0v/c 0. Thus the range-Doppler coupling known from conventional FMCW radars, which leads to the FMCW beat frequency
 $$f_{FMCW}=f_0 \displaystyle{{2v} \over {c_0 }}+k_r \displaystyle{{2r} \over {c_0 }}=f_r \lpar r\rpar +f_D \lpar v\rpar \comma \;$$
is also present in the shown architecture. By properly choosing f mod an overlap of positive and negative frequency components can be avoided. In this case the two symmetric tones around f mod are equivalent to the positive and negative frequency components being present in a homodyne FMCW radar with a single RX mixer which delivers real-valued IF data. Thus all performance limits known from classical FMCW radars also apply to the proposed approach.
C) Analysis of ΔΣ noise
The noise component  $N_{\Delta \Sigma\comma IF}=s_{LO} \lpar t\rpar s_{LO} \lpar t - \tau \lpar t\rpar \rpar N_{\Delta \Sigma } \lpar t\rpar $, being present at the mixer output can be calculated by
 $$N_{\Delta \Sigma\comma IF} \approx A_{noise} \cos \left({2\pi f_{FMCW} t+2\pi f_0 \displaystyle{{2r} \over {c_0 }}} \right)N_{\Delta \Sigma } \lpar t\rpar \comma \;$$
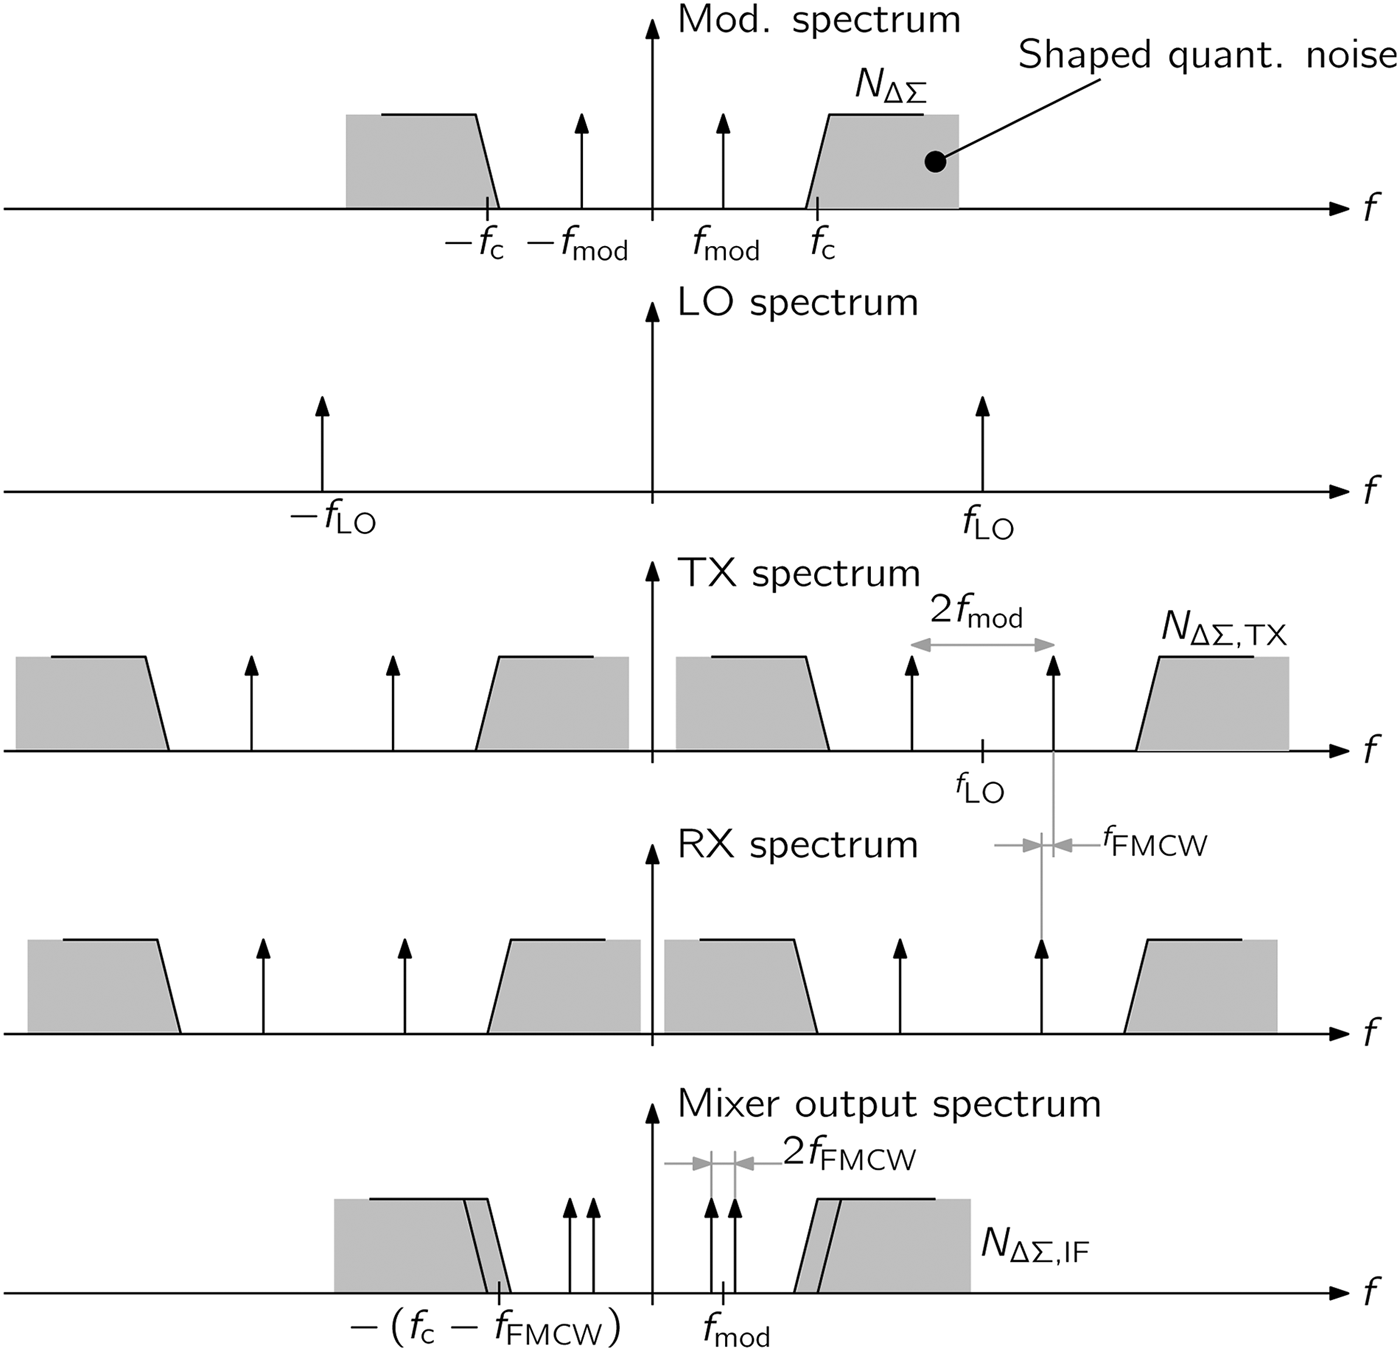
if it is assumed that signals around 2f 0 do not appear at the mixer output. From (10), it can be seen that after downconversion, the ΔΣ noise is centered around f FMCW. In a conventional ΔΣ modulator, as it is used in this work, the quantization noise is suppressed at low frequencies by shifting the power toward higher frequencies. Thus, N ΔΣ(t) is a high-pass signal with corner frequency f c and can be easily filtered out from the radar output, if the parameters of the ΔΣ modulator, the FMCW parameters (e.g. the ramp slope) and f mod are chosen correctly. The spectra of desired and noise signals at various stages inside the radar system are shown in Fig. 2. From this sketch, it can be seen that the usable frequencies are limited to f c − f FMCW,max with f FMCW,max denoting the highest frequency defined by the desired application. Thus, it has to be assured that f mod + 2f FMCW,max < f c and f mod > f FMCW,max which can be fulfilled by correctly choosing f mod and k r depending on the desired maximum target ranges and velocities.
Signal spectra at various points in the proposed radar system (modified from [Reference Feger, Ng, Pfeffer and Stelzer12]). It can be seen that the corner frequency f c of the ΔΣ defines the usable IF band.
III. HARDWARE REALIZATION
The realized circuit is based on various building blocks that partly have been presented in other publications. Details about the ×18 frequency multiplier, transceiver cell and antenna in package were presented in [Reference Fischer, Starzer, Forstner, Kolmhofer and Stelzer14, Reference Fischer, Tong, Hamidipour, Maurer and Stelzer15]. In the following, the focus is set on the ΔΣ modulator and the circuit realization of the BPSK modulator.
A) Delta–Sigma modulator
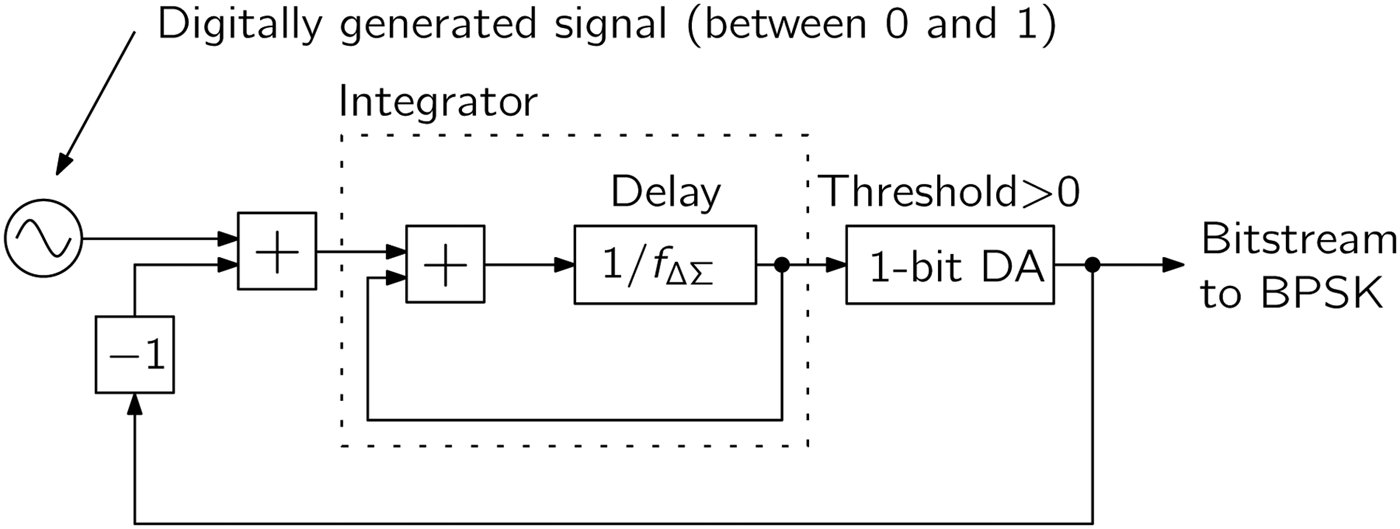
A block diagram of the ΔΣ modulator that was realized inside an FPGA is shown in Fig. 3. A simple first-order modulator was chosen in this work to keep the hardware effort as low as possible. The ΔΣ modulator is realized inside an FPGA [Reference Pfeffer, Feger, Schmid, Fischer and Stelzer16] and runs at a frequency of f ΔΣ = 100 MHz. With its use a digitally generated sinusoid is converted into a binary sequence controlling the BPSK modulator via a conventional digital FPGA output pin.
Delta–Sigma modulator implemented in the FPGA. To minimize the hardware effort a simple first-order realization was chosen.
B) BPSK modulator circuit
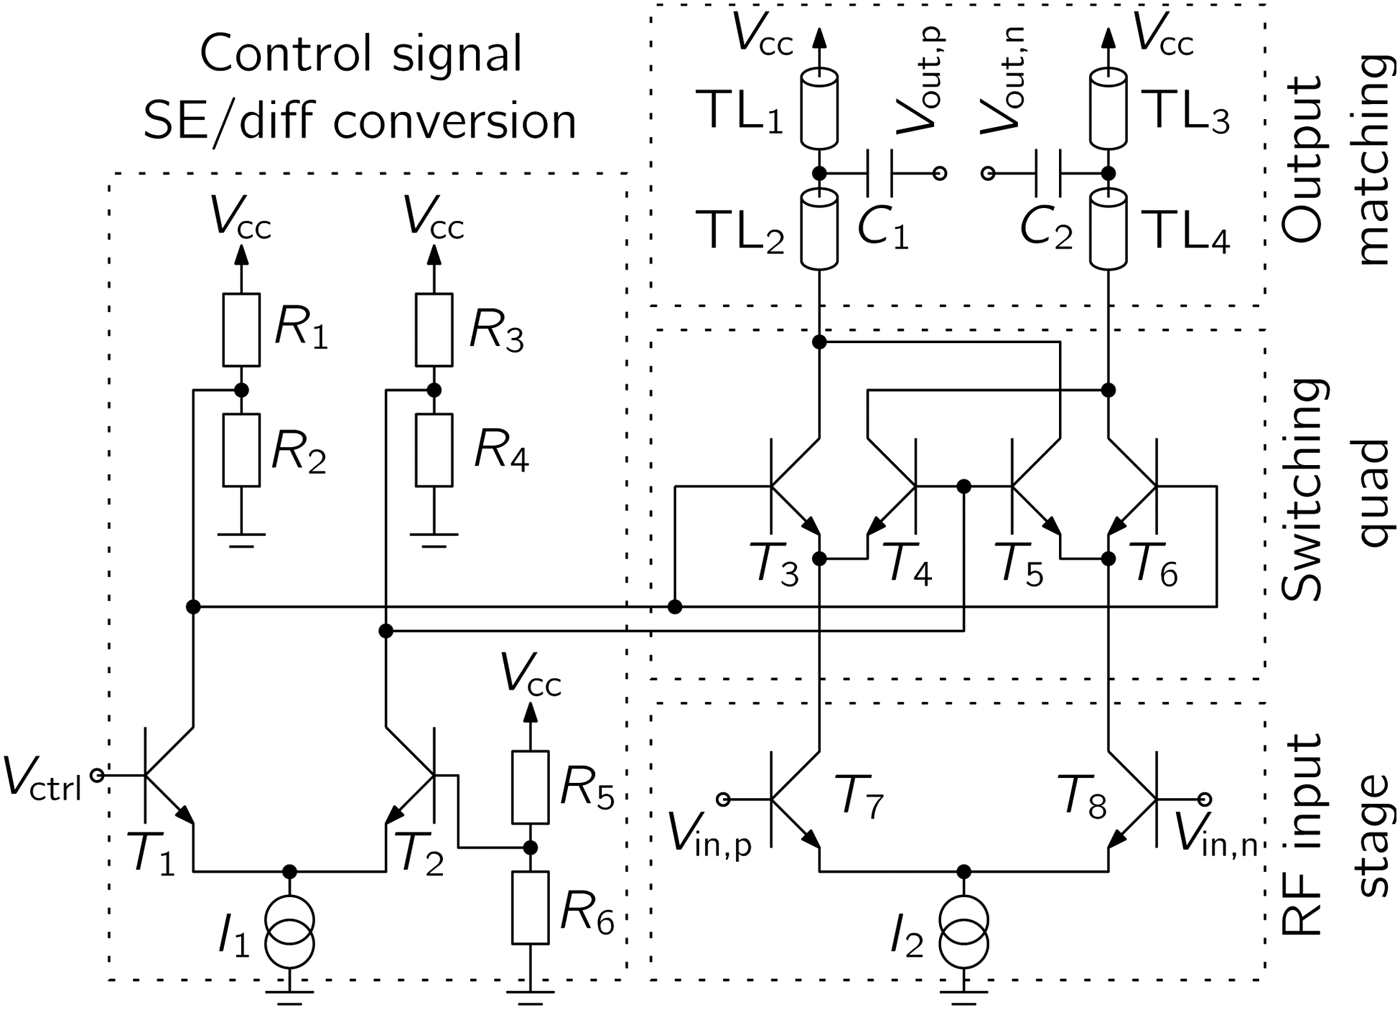
The RF transceiver (TRX) is realized in Infineon's B7HF200 SiGe:C technology [Reference Böck17]. All main RF building blocks are realized as differential circuits which allow a very efficient implementation of the BPSK modulator. The desired 180° phase shift of the differential E-band signal V in,p − V in,n can be achieved by a switching quad, which simply swaps the positive and negative signal lines as it also was presented in [Reference Lee, Yao, Mangan, Yau, Copeland and Voinigescu18]. This technique allows a very broadband operation of the BPSK modulator. Figure 4 shows the circuit diagram of the BPSK modulator. Besides, the already mentioned switching quad, which is formed by T 3–T 6, the modulator includes an input stage for the control signal V ctrl. This stage consists of T 1, T 2, and R 1–R 6 and converts the single-ended digital input signal to a differential signal. The input stage for the differential RF-signal is formed by T 7 and T 8. The output matching stage is realized using transmission lines TL 1–TL 4 as well as the capacitors C 1 and C 2. At the output, a power of 0 dBm is delivered into a directly connected and matched differential dipole antenna that is integrated in the chip package.
BPSK modulator circuit including an input stage for differential to single-ended conversion of the control signal, a switching quad realizing the 180° phase shift, an input stage for the differential 77-GHz signal and an output matching section.
C) Integrated transceiver with antenna in package
As already mentioned, some of the used components were already presented in [Reference Fischer, Starzer, Forstner, Kolmhofer and Stelzer14, Reference Fischer, Tong, Hamidipour, Maurer and Stelzer15]. Compared to [Reference Fischer, Tong, Hamidipour, Maurer and Stelzer15], a solution with separated TX and RX antenna was realized in this work. Figure 5 shows the packaged chip including the dipole antennas, which are realized on the redistribution layer.
Photograph of the E-band circuit integrated with antennas in an eWLB package [Reference Feger, Ng, Pfeffer and Stelzer12]. The overall size of the package is 6 × 6 mm2 and it can be seen that the BPSK modulator requires only little chip area.
IV. MEASUREMENTS
In [Reference Feger, Ng, Pfeffer and Stelzer12], we presented measurements demonstrating the basic functionality of the system. Furthermore, we showed that the signal-to-noise ratio (SNR) degradation in the IF signal is negligible despite the modulation of the TX signal. In the following, we present measurements of the modulated E-band TX signal and range measurements focusing on the system performance in short-range scenarios.
A) Verification of the TX signal
The high carrier frequency complicates the direct measurement of the modulated TX signal. Thus, a multi-stage downconversion using a spectrum analyzer (Rohde & Schwarz FSQ40) in conjunction with a harmonic mixer (Rohde & Schwarz FS-Z90) was employed for this purpose. The input to the ×18 frequency multiplier was generated using a signal generator (Rohde & Schwarz SMR40) which was set to a constant frequency of 4.3 GHz and to an output power of −10 dBm. No FMCW sweep was performed, i.e. the frequency of the E-band signal was fixed to 77.4 GHz. The BPSK modulated and down-converted signal was measured at the spectrum analyzer's IF output (center frequency: 404.4 MHz) using a high-speed oscilloscope (Agilent DSO91204A). The modulators were operated at 100 MHz, the frequency of the sinusoid was chosen as 500 KHz. The spectrum of the down-converted signal and a simulation of the modulator output is shown in Fig. 6. It can be seen that, especially close to the carrier, the measured signal matches well with the simulated one. At larger offsets from the carrier, the measured signal power is lower than it would be expected from the simulation. This behavior can be attributed to the output stage of the FPGA with its limited switching speed and the bandwidth of the spectrum analyzer's IF output. A zoom into the resulting spectrum, together with a measurement of the unmodulated output, is shown in Fig. 7. As expected from (3) the power of the sidebands is 6 dB below the unmodulated carrier. The tones caused by the first-order ΔΣ modulation match well with the simulation. Some other unwanted tones are visible in the measurement results for both the modulated and the unmodulated case. Thus, these disturbances can be attributed to external influences. It furthermore can be seen from Fig. 7 that choosing an IF bandwidth smaller than 2f mod is advantageous, since in this way spurious tones caused by the Delta–Sigma modulation do not influence the radar performance. If this is not possible also an increase of both the oversampling ratio as well as the order of the Delta–Sigma modulator can be increased to improve the achievable SNR. For details, we refer the interested reader to [Reference Schreier and Temes19].
Comparison of measured and simulated E-band TX signal spectra.
Zoom into the E-band TX signal spectrum.
B) Range measurements
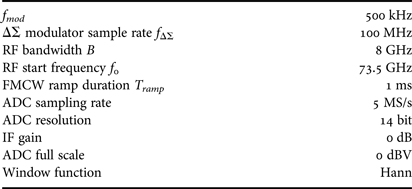
Compared to [Reference Feger, Ng, Pfeffer and Stelzer12], the measurements that will be presented in the following have been performed between 73.5 and 81.5 GHz with an increased sweep duration of 1 ms. Furthermore, instead of using a single chip, in this work two separate but identical chips were used. To reduce the influence of crosstalk one chip was operated as TX and the other one as RX. All other measurement parameters are summarized in Table 1. A small corner reflector with a radar cross section (RCS) of 0.044 m2 was mounted on a linear rail and moved in steps of approximately 0.47 mm. At each position 200 range measurements were taken both in heterodyne as well as in homodyne mode using the baseband system presented in [Reference Pfeffer, Feger, Schmid, Fischer and Stelzer16]. To calculate the target position a fast Fourier transform (FFT) was applied to the digitized IF signal after windowing and zero-padding. In the homodyne mode the beat frequency was determined from the position of the peak in the spectrum calculated around the expected target position. Using (9) the frequency can be directly converted to range, since the target was not moved during each measurement step. As can be seen from (8) two tones centered around f mod are contained in the IF signal for the heterodyne mode. As described in [Reference Feger, Ng, Pfeffer and Stelzer12], these two tones can be coherently combined. This can be achieved by calculating a virtual spectrum
 $$S_{virt} \lpar \,f^{\prime}\rpar =S_{IF} \left(\,{f_{mod}+f^{\prime}} \right)+S_{IF}^\ast \left({\,f_{mod} - f^{\prime}} \right)\quad f^{\prime}\lt f_{mod}\comma \;$$
where * denotes complex conjugation. The operation (11) has two effects: First, the SNR is improved by 3 dB due to the coherent combination. Secondly, the frequencies are digitally down-converted to zero. Thus, the same peak search as in the homodyne mode can be directly applied to (11) to find the beat frequency related to the target parameters. In Fig. 8, the deviations between the averaged measured distances and the distances set by the rail are depicted.
Parameters of the conducted radar measurements.
From Fig. 8, it can be seen that both the heterodyne and the homodyne radar operate well down to a distance of approximately 40 cm with range bias values below 0.5 mm. Below 40 cm, the influence of the dc increases which can be seen especially from the rising errors of the homodyne measurement. Both systems work down to approximately 17 cm, with larger errors in the homodyne mode. At even lower distances the homodyne radar stops working since the target peak is masked by the dc-signal, whereas the heterodyne radar still gives satisfying results with errors staying below 10 mm. Also the measured standard deviation, depicted in Fig. 9, shows that for very short distances the heterodyne setup performs better than its homodyne counterpart.
Measurement bias calculated using the averaged measured distance and the position of the linear rail. (a) Range measurement bias calculated as difference between measured and true distance. (b) Zoom into Fig. 8(a).
Measurement standard deviation for varying position of the linear rail.
However, for rising distances the homodyne setup results in better measurement performance. This can be attributed to the slightly lower noisefloor of the homodyne setup, as it was already presented in [Reference Feger, Ng, Pfeffer and Stelzer12]. Nevertheless, both systems achieve highly accurate results for distances up to 80 cm with a worst-case standard deviation in the range of only 60 µm. It has to be noted, that this was achieved without exploiting the phase information contained in the IF spectrum.
A further improvement of measurement performance is possible, if it is assumed that both the dc as well as the cross-coupling signals remain constant over time, temperature etc. In this case a reference measurement can be performed prior to operation, which can be used to remove the static unwanted signals. The measured spectra achieved with this technique are shown in Fig. 10.
Averaged power spectra of 50 reference measurements and 50 different measurements after subtracting the averaged reference measurement. It can be seen that both dc and crosstalk signals can be removed. However, the dc-level remaining in the heterodyne measurement exceeds the level of crosstalk remaining in the heterodyne result. (a) Power spectra. (b) Zoom into Fig. 10(a).
The shown results were achieved by coherently averaging 50 measurements of a single corner reflector at a distance of 112.5 cm. The averaged results of this measurement are shown in Fig. 10 as dashed lines. From Fig. 10(a), the target peak and reflections due to the non-perfect anechoic chamber are visible at distances up to approximately 6.5 m. Furthermore, it can be seen that the crosstalk signal is visible both in the heterodyne as well as the homodyne mode, since the crosstalk signal is also shifted in frequency and thus appears at close-to-zero distance. By comparing the level of the spectral peak caused by the corner reflector and the level of the crosstalk signal an isolation between TX and RX of approximately 50 dB can be estimated. This means that, for small distances, if signal component due to the corner reflector exceeds the level of the crosstalk. After 50 reference measurements, another 50 measurements were carried out. The averaged results of these measurements, after subtracting the reference measurement, are shown as solid lines in Fig. 10. It can be seen that, for constant temperature or other external influences, the subtraction of the reference measurement effectively removes dc- and crosstalk signal components and additionally also the reflections from the measurement chamber. However, the dc-level remaining in the homodyne measurement exceeds the level of crosstalk remaining in the homodyne measurement. This indicates that the dc-signal varied between the reference measurements and the other measurement runs, whereas the crosstalk remained constant. Thus, a separation of these two unwanted signal components, as it is realized by the heterodyne approach, allows a better suppression also if a reference measurement is included. The range bias for both heterodyne as well as homodyne measurements after removing the reference measurement is shown in Fig. 11.
Measurement bias for short range measurements after removing the reference measurement.
It can be observed that both measurement principles show comparable behavior with errors below 10 mm for target distances down to 11 cm. For even lower distances, the mirror signal component influences the position of the target peak in the spectrum which leads to rising deterministic errors. This behavior could be improved using a more advanced frequency estimator as described in [20, pp. 410–413] which takes multiple tones, and thus also the mirror component, into account. However, it can be expected that the improvement for both the homodyne as well as the heterodyne system will be comparable as long as sufficient suppression of unwanted dc- and crosstalk-components can be realized.
V. CONCLUSION
We presented a FMCW radar which was extended by a ΔΣ sequence driven BPSK modulator. The extension allows to shift the IF signal away from dc with little hardware effort by modulating the TX signal without requiring any DAC or I/Q modulator. The derived signal model shows that analog filtering prior to the ADC can be used to remove the ΔΣ-noise. Measurements collected with a prototype system demonstrated that, for moderate distances, the performance of the heterodyne radar is comparable to a conventional realization. However, for short range applications the heterodyne realization shows a better behavior if no removal of dc- and crosstalk components is applied. If such a removal is carried out, e.g. by subtracting a reference measurement, both realizations show similar behavior. Nevertheless, subtracting such a reference measurement requires that undesired signal components are time invariant, which is an assumption that might be violated in practice. Thus the presented heterodyne implementation is advantageous especially if the simplified realization of the IF chain is taken into account.
ACKNOWLEDGEMENTS
The authors wish to acknowledge DICE GmbH & Co KG as part of Infineon for funding this work carried out at the Christian Doppler Laboratory for Integrated Radar Sensors. Furthermore, the financial support by the Federal Ministry of Economy, Family and Youth and the National Foundation for Research, Technology and Development is gratefully acknowledged.
Reinhard Feger was born in Kufstein, Austria, in 1980. He received the Dipl.-Ing. (M.Sc.) degree in Mechatronics and Dr. techn. (Ph.D.) degree in Mechatronics from Johannes Kepler University, Linz, Austria, in 2005 and 2010, respectively. In 2005, he joined the Institute for Communications and Information Engineering, Johannes Kepler University, as a Research Assistant. In 2007, he became a member of the Christian Doppler Laboratory for Integrated Radar Sensors, Johannes Kepler University. His research topics are radar signal processing, as well as radar system design for industrial and automotive radar sensors. Dr. Feger was recipient of the 2011 Microwave Prize and the 2011 German Microwave Conference Best Paper Award. In 2012, he received the Best Measurement Paper Prize at the European Conference on Antennas and Propagation.
Herman Jalli Ng was born in Tebing Tinggi, Indonesia, in 1981. In 2005, he received the Dipl.-Ing. (FH) degree in Communication Engineering from Karlsruhe University of Applied Sciences in Germany. He is currently working toward the Ph.D. degree at the Johannes Kepler University. From 2002 to 2003, he worked at Siemens AG, Karlsruhe, Germany, as a trainee where he developed software for SIMATIC automation systems. From 2004 to 2005, he was with the Atmel GmbH, Heilbronn, Germany, as a trainee for test developments for RF chips. After his graduation in 2005, he worked at Bosch GmbH, Reutlingen, Germany, as an IC design engineer, where he developed mixed-signal ASICs in HV-CMOS and BCD technologies for automotive sensors. In 2009, he joined the Institute for Communications and Information Engineering, Johannes Kepler University, Linz, Austria, as a Research Assistant. In 2011, he became a member of the Christian Doppler Laboratory for Integrated Radar Sensors, Johannes Kepler University. His main interests include the design of RF integrated circuits in SiGe Bipolar and CMOS technologies, frequency synthesizers, and radar systems.
Clemens Pfeffer was born in St. Pölten, Austria, in 1975. He received the Dipl.-Ing. (M.Sc.) degree in Mechatronics from Johannes Kepler University, Linz, Austria, in 2009. In 2009, he joined the Institute for Communications and Information Engineering, Johannes Kepler University, as a Research Assistant and became a member of the Christian Doppler Laboratory for Integrated Radar Sensors, Johannes Kepler University. His research interests are radar system design for industrial and automotive radar sensors. Mr. Pfeffer was recipient of the 2012 European Conference on Antennas and Propagation (EuCAP) Best Measurement Paper Prize.
Andreas Stelzer was born in Haslach an der Mühl, Austria, in 1968. He received the Dipl.-Ing. degree in Electrical Engineering from the Technical University of Vienna, Vienna, Austria, in 1994, and the Dr. techn. degree (Ph.D.) in Mechatronics (with honors sub auspiciis praesidentis rei publicae) from Johannes Kepler University Linz, Austria, in 2000. In 2003, he became Associate Professor with the Institute for Communications Engineering and RF Systems, Johannes Kepler University Linz. Since 2008, he has been a key researcher for the Austrian Center of Competence in Mechatronics (ACCM), where he is responsible for numerous industrial projects. Since 2007, he has been head of the Christian Doppler Research Laboratory for Integrated Radar Sensors, and since 2011, he has been full Professor at the Johannes Kepler University, heading the Department for RF-Systems. He has authored or coauthored over 300 journal and conference papers. His research is focused on microwave sensor systems for industrial and automotive applications, radar concepts, SiGe-based circuit design currently up to 320 GHz, microwave packaging in eWLB, RF and microwave subsystems, surface acoustic wave (SAW) sensor systems and applications, as well as digital signal processing for sensor signal evaluation. Dr. Stelzer is a member of the Austrian ÖVE. He has served as an associate editor for the IEEE MICROWAVE AND WIRELESS COMPONENTS LETTERS. Currently, he serves as Co-Chair for MTT-27 Wireless-Enabled Automotive and Vehicular Applications. He was recipient of several awards including the 2008 IEEE Microwave Theory and Techniques Society (IEEE MTT-S) Outstanding Young Engineer Award and the 2011 IEEE Microwave Prize. Furthermore, he was recipient of the 2012 European Conference on Antennas and Propagation (EuCAP) Best Measurement Paper Prize, the 2012 Asia Pacific Conference on Antennas and Propagation (APCAP) Best Paper Award, the 2011 German Microwave Conference (GeMiC) Best Paper Award, as well as the EEEfCOM Innovation Award and the European Microwave Association (EuMA) Radar Prize of the European Radar Conference (EuRAD) 2008. He is a member of the IEEE MTT, IM, and CAS Societies and he serves as IEEE Distinguished Microwave Lecturer for the period 2014–2016.