INTRODUCTION
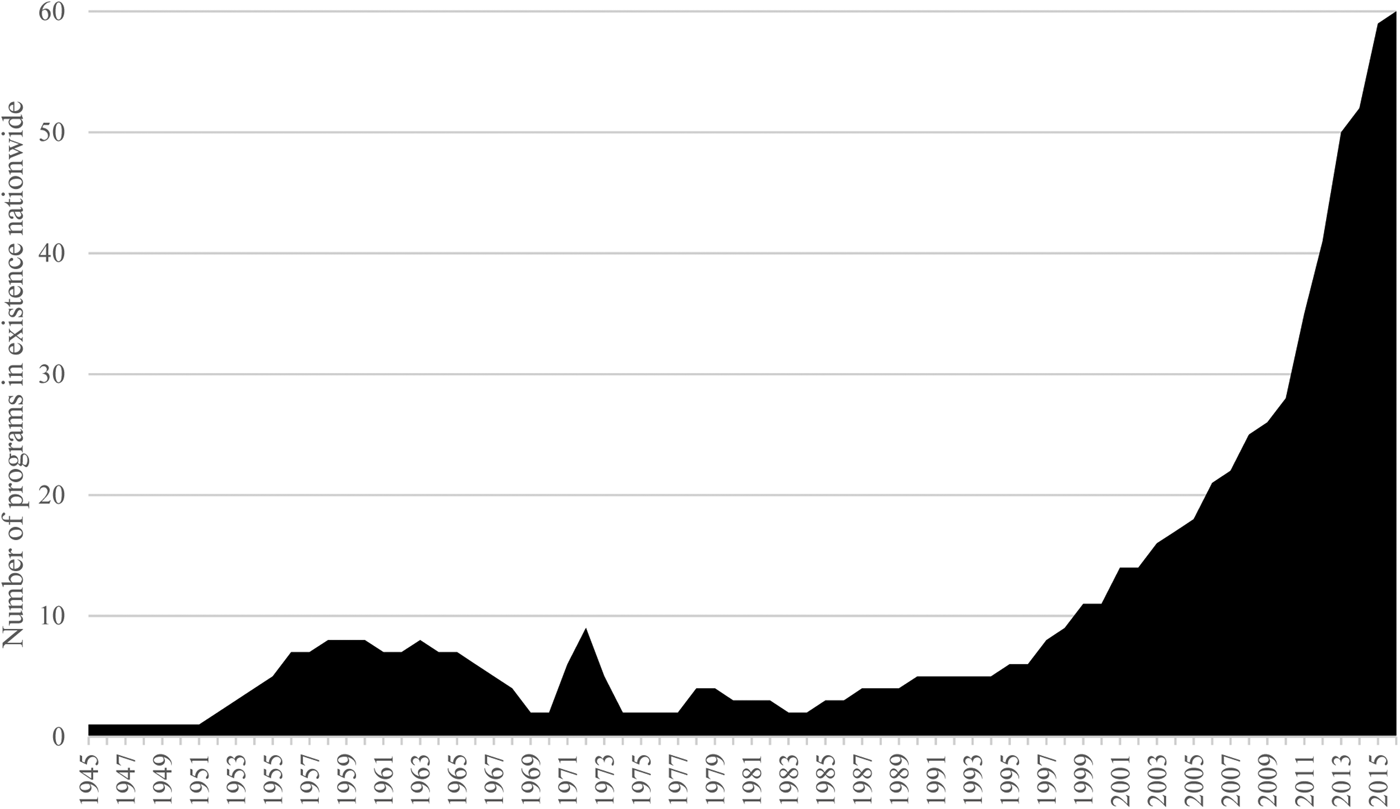
The renaissance of education vouchers in the United States is indisputable and striking (Figure 1).Footnote 1 While modern proponents of education vouchers cite numerous motives, the majority are at pains to promote them as “color-blind” or “race-neutral” measures, to use King and Smith'sFootnote 2 language. Color-blind advocates of vouchers claim the race of the children participating is irrelevant to the policy, even though it is an activist program nominally targeting the educationally disadvantaged.Footnote 3 In contrast, proponents of an active federal role to ameliorate enduring racial inequalities rarely advocate education vouchers, concluding that they are commonly designed by white Republican Party lawmakers and used by white parents to perpetuate de facto segregated education among American children.Footnote 4
The Renaissance of Vouchers—Cumulative Total of Voucher Programs in the United States, 1945–2016.

The contemporary debate about education vouchers has unmissable historical echoes reflecting, first, the origin of voucher schemes in the 1950s when they were used as instruments to maintain racial segregation and, second, their redesign after the 1960s, principally by opponents of racial progress, to accommodate the civil rights era. This article brings an analytic-historical perspective rooted in racial orders to understand how education vouchers have been reincarnated and reinvented since Milton Friedman first formalized the idea in 1955.Footnote 5
We argue that the politics of such schemes—variously called tuition grants, tax credit scholarships, educational savings accounts, or vouchers—is related to the dominant racial order at each historical juncture in American politics. Vouchers buttressed white supremacy during public school desegregation by funding segregated private schools. They were opposed by civil rights organizations but attracted some advocates for racial equality during the 1990s as a remedy for educational inequalities. But during President Obama's first term, vouchers became firmly associated with the modern color-blind alliance, consisting of Republicans and conservatives who disclaim the use of racial categories in policymaking. Our approach enables us to demonstrate that education vouchers have never been racially neutral but served key roles with respect to these prevailing racial hierarchies.Footnote 6
In the era of segregated education in the decades up to 1964, v2ouchers emerged as an instrument developed by white supremacists to maintain the racial order that was under threat from court orders and federal actions. Responding to the Brown v. Board of Education of Topeka (1954) decision ordering school desegregation, school districts offered tuition grants to white parents to remove their white children from public schools that had been ordered to integrate.Footnote 7 Tuition grant vouchers funded segregated institutions indirectly—channeling money via parents rather than directly to the school—in an effort to avoid legal challenge, but activists and judges exposed their racist purposes. In the 1960s and 1970s, as civil and voting rights legislation transformed the segregationist order into a new civil rights regime, proponents of racial equality worked to end the use of tuition grants in the South. More generally, they opposed the use of voucher-type schemes because these included the potential to discriminate racially between children.
Some liberal academics and progressive policymakers supported vouchers or tax credit voucher programs for the educationally disadvantaged, but growing racial and ideological polarization from the 1980s pushed vouchers firmly into conservatives’ issue preferences.Footnote 8 In the post–civil rights era, American voters’ partisan and ideological polarizationFootnote 9 has increasingly overlapped with a racial division between conservative color-blind and liberal race-conscious policy alliances: loose configurations of individuals and groups seeking to disclaim or deploy racial categories in policymaking, respectively.Footnote 10 This polarized context provides an opportunity for politicians associated with the conservative color-blind alliance to promote voucher type schemes that in practice contribute to keeping schools segregated.Footnote 11
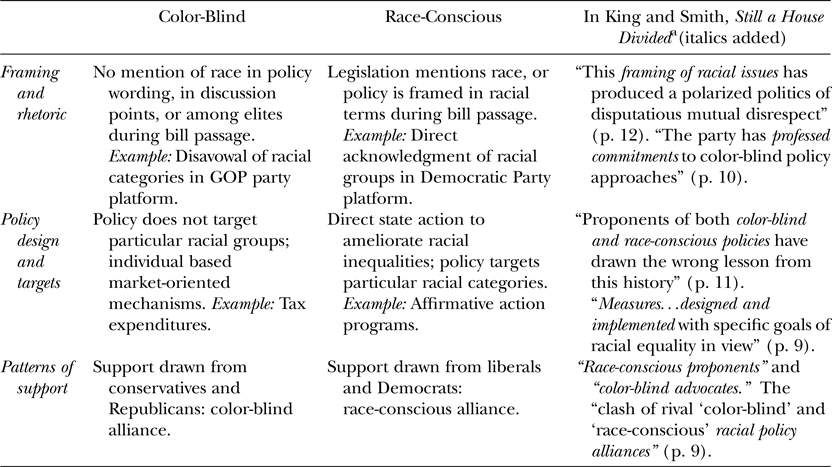
Modern vouchers have some race-conscious supporters—liberals and Democrats committed to the use of racial categories in policymaking—but their support base is overwhelmingly color-blind. Since the 1990s, some of these color-blind advocates of vouchers have maintained that such schemes will be beneficial to African American children and parents, but most are anxious to deny that vouchers result in any race-targeted effects. Proponents lobbied states to hold referenda to enact them. The overwhelming rejection of the schemes after such referenda prompted a strategic shift among voucher advocates to enact schemes in GOP-controlled state legislatures. To make sense of this complexity in the evolution of voucher politics over time, we draw on King and Smith's racial policy alliances framework to distinguish three arenas in which alliances contest: rhetoric, patterns of support, and policy design (Table 1). Table 1 defines the terms “color-blind” and “race-conscious” for policy framing, design, and support (columns 1 and 2) and situates the components of the King-Smith analytical framework in context (column 3).
Three Arenas of Racial Policy Alliance Contestation: Framing, Design, Support

Note: aDesmond King and Rogers M. Smith, Still a House Divided. Princeton Studies in American Politics: Historical, Institutional, and Comparative Perspectives (Princeton, NJ: Princeton University Press, 2011).
King and Smith's two racial policy alliances represent broad alignments rather than precise specifications of tight coalition partners. In this article we show how the framework can be calibrated and applied in an analytic-historical way to the development of school vouchers as these schemes move through their shifting incarnations. We argue that these arenas of racial policy alliance contestation—rhetoric, patterns of support, and policy design—are analytically separable, which means that race-conscious policy alliance members do not always espouse race-conscious arguments, and race-conscious policy designs may be publicly justified in a color-blind fashion. In King and Smith's book, Still a House Divided, race-consciousness and color-blindness identify frames, policies, and people, as illustrated in Table 1, column 3.
For King and Smith, color-blindness and race-consciousness manifest in the framing of racial issues and in parties’ professed commitments, whereby elites rhetorically emphasize or diminish racial categories (Table 1, row 1). Color-blindness and race-consciousness also occur in the design and implementation of policy (Table 1, row 2). And race-conscious proponents and color-blind advocates form two sides of opposed racial policy alliances (Table 1, row 3). Distinguishing these three arenas of racial policy alliance conflict enables us to identify multiple concurrent and consecutive transformations in voucher politics over time.
The tenacity of racial hierarchies in U.S. politics and the struggles to defend or reform approaches to racial equality is exceptionally well illustrated in the trajectory of education vouchers since their introduction by states in the 1950s to their contemporary embrace by Republican state governors and legislators. Our account of vouchers gives a micro example of the broad contours sketched out in the racial policy alliances framework showing the powerful ways in which institutionally embedded hierarchies operate locally to maintain and retain racist legacies.Footnote 12
Vouchers and Racial Epochs
In this article we use a racial orders framework to analyze how the politics of education vouchers has developed since Brown and what has driven that change. Empirically, we drew upon modern and historical newspaper sources (1953–2017), judicial rulings, civil rights reports and census data to construct an analytic narrative showing how voucher programs served the interests of those either opposing or on rare occasions promoting egalitarian racial reform rooted in America's shifting post–Civil War racial orders. We also constructed two original databases, legislator votes on voucher bills (2005–2017) and judicial votes in voucher cases (1955–2017), to express these patterns statistically.
Our approach used state legislature websites to extract information about the 6,693 legislative votes on forty-seven voucher bills passed between 2005 and 2017. To address possible selection bias we incorporated twelve voucher bills that were brought to a vote before July 2017 but failed to become law because they were vetoed or voted down, yielding a total of 7,851 state legislator votes. Additionally, drawing upon the universe of judicial votes in forty-six voucher cases (1955–2017) and 236 individual votes, we examined the legal vulnerability of voucher programs by recording each judge's decision about the constitutionality of the program at issue.
In this article we make four key empirical and theoretical contributions. First, we unearth patterns of tuition voucher distribution across the Jim Crow South. To our knowledge, no existing account has calculated the number and distribution of tuition grant vouchers over time for multiple states. Second, we advance empirically the accounts of voucher politics articulated in the first decade of the twenty-first century by analyzing the rapid increase in voucher programs after 2010 and drawing upon original data sets. Third, we apply the racial orders framework developed by Desmond King and Rogers Smith to the elite politics of vouchers. Fourth, our micro-empirical approach disaggregates the racial orders framework for the first time into its underlying dimensions—design, framing, and patterns of support—to understand how racial orders coalesce and fragment in different eras of contestation.
The first section of this article explains how vouchers originated in the 1950s as part of white supremacists’ struggle to resist desegregation. Such efforts were cited as empirical examples by the University of Chicago economist Milton Friedman as he articulated the theoretical rationale for vouchers.Footnote 13
As discussed in the second section, during the momentous transition from the segregationist to the civil rights era, achieved partly in laws passed by Congress in the 1960s, vouchers rarely featured in policy debates as a desirable method to address racial inequality in American schools. Instead, the focus for getting change and reform was the combination of federal funds, adroitly granted or withheld to the states by the U.S. Department of Education, and of court orders.
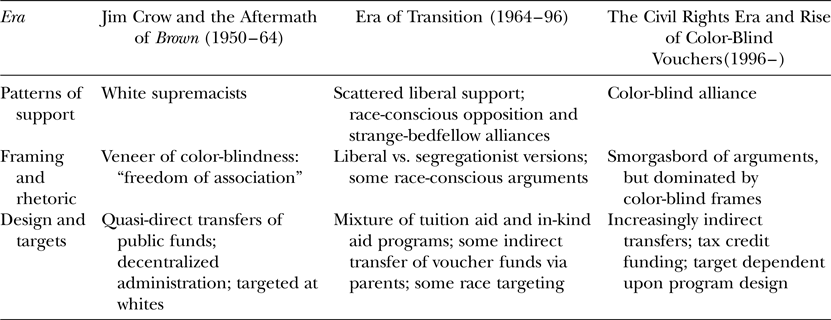
In the third section we show that as the civil rights reforms of the 1960s settled into the new alliances and struggles of the 1970s and 1980s, so opponents of federal-backed racial equality revived and redesigned school vouchers for the modern era to block reform. Table 2 illustrates the forms of racial policy alliance contestation in patterns of support, rhetoric, and policy design during the three eras of voucher politics: Jim Crow and the aftermath of Brown (1950–64), the era of transition (1964–96), and the civil rights era and rise of color-blind vouchers (1996–). The analysis in the article is organized around these three eras and shifts between them.
Three Eras of Voucher Politics

Expanding upon King and Smith's racial orders framework, we show how the reinvention of vouchers took place in three key arenas of racial policy alliance contestation summarized in Table 2: patterns of support, framing and rhetoric, and design and targets. Tracing the temporality of voucher politics reveals a trend toward color-blindness punctuated by sporadic race-conscious rationales and coalition building.Footnote 14 The revival of racial divides in contemporary voucher use is an empirical surprise but consistent with the deep legacies of racism in America identified by King and Smith and others,Footnote 15 and mobilized in recent electoral politics.Footnote 16
The racial orders framework guides the empirical analysis by providing explanations for the varying political purpose of vouchers at different historical stages. The use of vouchers took place in three distinct waves corresponding to the King and Smith racial orders and eras of racial policy alliance contestation: As part of the pro-segregationist anti-Brown resistance, during the brief race-conscious response to urban school crises, and in the explosion of color-blind vouchers paralleling the Obama presidency.Footnote 17
Within each era we show how color-blind and race-conscious forces sought to make and unmake racial hierarchies by building coalitions, reframing public debate, and crafting policy. This periodization is close to King and Smith's framework.Footnote 18 But our micro-empirical focus enables us to expand their account of the post-1970s’ decades by delineating the distinct bases of support found among some race-conscious advocates versus the overwhelming color-blind mobilization base for vouchers. These nuances have been missed in many existing broad-stroke accounts of changes in racial politics since the 1960s.
There are competing accounts about vouchers. The most compelling is religious activism, from which we distinguish our analysis. Although most vouchers are used at religious schools and many religious elites support vouchers, we find explanations rooted in racial policy alliances more analytically compelling for three reasons.
First, religious leaders have historically played a weak or ambivalent role in the formation of voucher coalitions, ranging from reluctant Midwest Catholic dioceses to outright hostility from Texan Baptist groups.Footnote 19 As we show in Part 2 of this article, voucher activism in the 1990s was propelled by coalitions organized around racial justice, with Catholic organizations in a supporting role. Racial policy alliances—rather than culture war categories—can more usefully describe the patterns of support of individuals and groups advocating for and against vouchers.
Second, the movement from values arguments to racial-justice claims to color-blind framing of vouchers marks significant shifts in vouchers’ evolution.Footnote 20 Race-conscious and color-blind frames are meaningful in judicial decision making. The Establishment Clause of the First Amendment restricts arguments for vouchers couched in terms of benefits for religious individuals or institutions, but not those framed in terms of racial justice, individual choice, or school quality.
Third, voucher policies have been designed explicitly to accomplish racial goals, having their genesis in and responses to the Brown decision. As we show in section 1 of this article, tuition grant legislation in the Jim Crow era explicitly excluded sectarian schools from participation. We do not deny the importance of religion in propelling voucher activism on occasion but find evidentially that the formation of racial policy alliances is a more compelling explanation for vouchers’ patterns of support, rhetoric, and policy design and how they change over time.
1. VOUCHERS AND SEGREGATIONIST AMERICA
1.1. Origins and Number of Vouchers
The first school voucher programs were adopted in the South in response to Brown v. Board of Education (1954).Footnote 21, Footnote 22, Footnote 23 Their purpose was defined by ardent defenders of the segregationist racial order. These programs were designed to enable white families to escape any desegregation of the public schooling system by utilizing publicly funded vouchers distributed by all-white school districts to send their children to private de facto segregated academies.Footnote 24 This tactic was embraced to maintain the South's system of white supremacy.Footnote 25
The laws authorized public funding for grant payments to parents to spend on private education for their children. Seven southern states passed tuition grant laws: Alabama (1955), Georgia (1953Footnote 26), Louisiana (1958Footnote 27), Mississippi (1964), North Carolina (1956), South Carolina (1963), and Virginia (1956Footnote 28). For these states, buttressing separate schools was a pivotal component of segregation. In an eighth state, Arkansas, a publicly funded tuition grant bill was introduced but never reached the governor's desk. Instead, policymakers successfully solicited private funding for tuition grants.Footnote 29
The tuition grant programs were to be used for “segregation academies,” single-race private schools established in direct response to Brown. Catholic or “sectarian” schools were excluded from these tuition grant programs, due partly to anti-Catholicism in the South and partly to the fear that Catholic schools would soon start to desegregate (as, indeed, they did in many parts of the South during the early 1960s).Footnote 30
Compiling data on the number of grants issued during this period is challenging because official records are incomplete and inadequate. We triangulate among contemporary newspaper sources, judicial rulings, and reports of the United States Commission on Civil Rights to piece together—for the first time—the trajectory of grant issuance across states.
Of the tuition grant states, Louisiana and Virginia distributed the largest number of grants. In its first year of operation Louisiana issued 535 tuition grants, but the number quickly rose to 7,093 in its second year (1962–63) and to 11,000 the following year.Footnote 31 In 1966, the number of grants peaked at 15,177, followed by 14,059 in 1967–68, after which the program was struck down by a federal district court.Footnote 32
The value of the grants was initially set at $1.67 per day and later raised to $2 per day, or $360 for an assumed school year of 180 days, which was typically sufficient to cover all or most of private school fees.Footnote 33 We used the data appendices attached to the Poindexter v. Louisiana Financial Assistance Commission case (1968) to calculate the average tuition charge in private schools set up in Louisiana after the Brown decision: $414 per annum.Footnote 34 Hence, the grants covered, on average, 87 percent of fees. Judges in many states noted that tuition grants were calibrated to the level of school fees, and vice versa (Hall v. St. Helena Parish School Board).Footnote 35 Many segregated schools set up after Brown, such as Carrollton Private School, Mirabeau Elementary School, United Elementary School, and Jefferson Academy, charged precisely the cost of the tuition grant.
These vouchers were used almost exclusively by whites, although a small number of black students did use tuition grants to attend segregated academies.Footnote 36 In Coffey v. State Education Finance Commission (1969) the vigilant judges provided a detailed data appendix on patterns of voucher usage to justify their conclusion that Mississippian tuition grants were unconstitutional.Footnote 37 The court found that all but one of the private schools receiving the $240 tuition grant payments in the school year 1967–68 had all-white attendance (the other school was entirely African American).Footnote 38
In Virginia the state dispensed 4,750 grants in the school year beginning in 1959 at a cost of just over $1 million,Footnote 39 with each grant amounting to $125 per child for elementary students and $150 for high schoolers, supplemented by local sources (see Griffin v. County School Board of Prince Edward County and Pettaway v. County School Board of Surry County)Footnote 40 In subsequent years the number of tuition grants rose to 6,100, then 7,261, 8,518,Footnote 41 and 9,489 in 1963–64.Footnote 42 By 1964, Virginia had spent more than $7 million on tuition grant payments. Even after the passage of the 1964 Civil Rights Act and a 1965 Supreme Court decision striking down the Prince Edward County's policy of shuttering the public school system to avoid desegregation, Virginia continued to fund private tuition grants.Footnote 43
Numbers rose to 12,253 in 1964, dipping slightly to 11,983 in 1965, then climbing again to 12,786 in 1966 and almost 14,000 in 1967. Despite declining enthusiasm for the program on the part of some whiter Virginian counties toward the end of the decade, particularly Roanoke, Arlington, and Alexandria, the number of tuition grants issued in 1968 (after which they were struck down by a three-judge federal court) was in excess of 13,000.Footnote 44 Over the course of a decade, Virginia spent nearly $20 million in tuition grants.
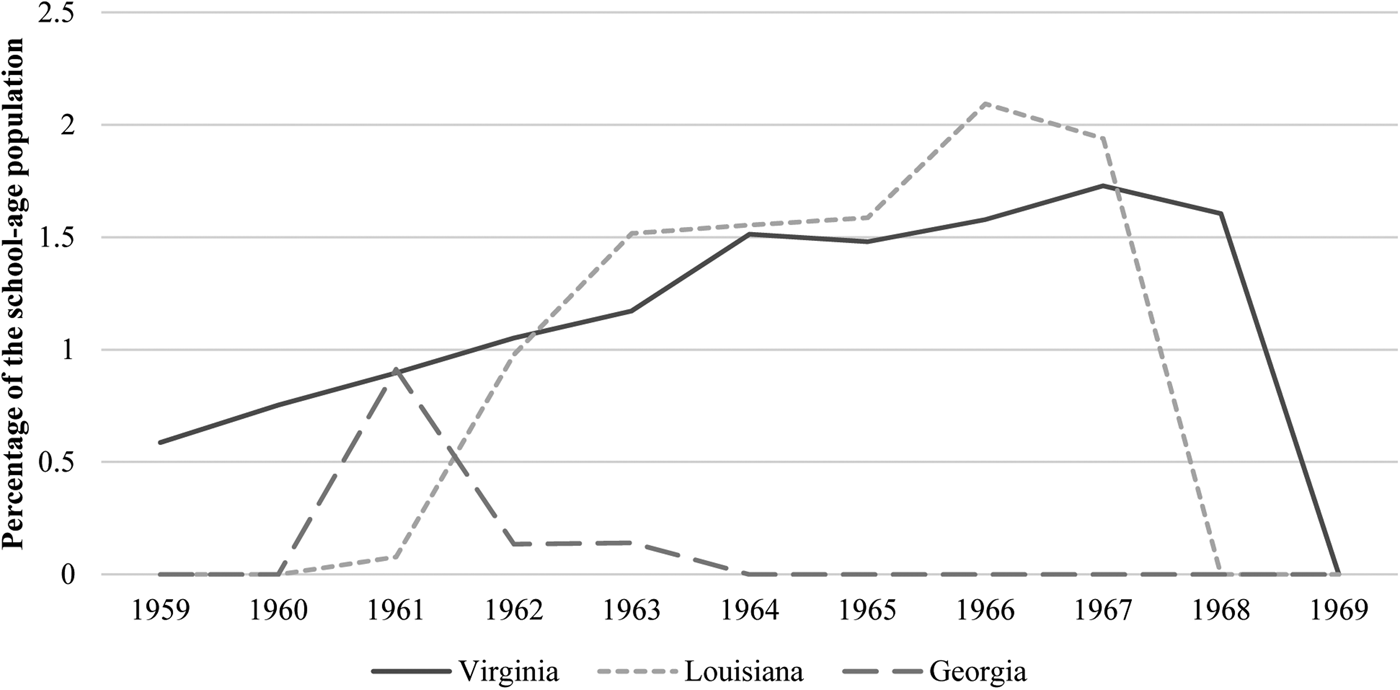
By contrast, the Georgia tuition grant program's early promise—the state spent $1.4 million in 1961–62 alone—was quickly snuffed out after the legislature adopted additional regulations. “The legislature provided [in 1963] that local school systems must participate in the costs and certify the students for private school grants, an action that virtually killed the plan.”Footnote 45 State outlay for the grants dropped to a mere $112,000 in 1963 and came to a halt the following year without the need for court action.Footnote 46 Figure 2 displays the rise and fall of tuition grant payments in Virginia, Louisiana, and Georgia, normalized for the size of the 5- to 14-year-old population in each state. As Figure 2 shows, at their peak about 2 percent of the school-age population in Louisiana and Virginia used tuition grants. But the impact of these grants was felt across the South.
Selected Southern States’ Issuance of Vouchers in the Era of Segregation.

1.2. Patterns of Support for Vouchers in Defense of Jim Crow
White supremacist Democratic governors, including George and Lurleen Wallace of Alabama, Eugene Talmadge and Ernest Vandiver Jr. of Georgia, Earl Long and James Davis of Louisiana, Paul Johnson of Mississippi, and Thomas B Stanley of Virginia, were vociferous supporters of tuition grant vouchers.Footnote 47 They and their legislative allies established commissions to devise strategies to avoid desegregation. The Sibley Commission in Georgia (“the Committee on Schools of the Georgia General Assembly”), the Pearsall Committee in North Carolina, and the Gray Commission in Virginia recommended tuition grants as part of packages of measures designed to thwart desegregation.Footnote 48
Committee memberships were almost exclusively white and male—three African Americans sat on the sixteen-member Pearsall Committee in North Carolina, but the Gray Commission in Virginia was drawn from the state legislature, which had no African Americans and only one woman serving in it.Footnote 49 Members of the Gray Commission were drawn disproportionately from southern Virginian legislative districts with smaller populations but larger concentrations of black residents, a pattern of support that would be repeated when it came to voting on tuition grant packages across the South.
White segregationists shepherded tuition grant legislation through state legislatures. The bills did not garner uniform support. Some votes were close. But closeness reflected not principled objection to the racist ends of the measures but doubt about their efficacy in achieving widely shared segregationist goals. Virginia's 1956 tuition grant law passed the upper house by just four votes. There were legislators willing to speak out against tuition grants—but for pro-segregationist reasons, such as expressing their fear that the “massive resistance” approach would make federal court challenge more likely. For example, Senator Bob Wilson of Walker County, Alabama, argued that federal courts would force private schools to accept black students as long as white pupils received state aid.Footnote 50 Revealingly, support for tuition grants was concentrated among members with the largest proportion of black residents in their districts. These were the districts that would feel the impact of desegregation most keenly.Footnote 51
1.3. Tuition Grant Rhetoric: Veneer of Color-Blindness
The earliest segregation tuition grant efforts employed notionally color-blind arguments about “freedom of choice” and “freedom of association.” Mindful of the risk of judicial challenges, politicians publicly justified their tuition grant policies without recourse to race. In Alabama, for instance, the tuition grant law made no mention of race or color, providing that children could qualify for grants if, in the judgment of their parents, it would be detrimental to their “physical or emotional health” or subject them to “hazards to personal safety” if they attended public school.Footnote 52 These supposedly race-neutral frames formed part of a broader “freedom of choice” response to desegregation, purportedly allowing black children to transfer to white schools, but in practice subjecting would-be transfer students to harassment or intimidation and rejecting their applications on notionally race-neutral grounds. This language fits with the racial orders framework.
Some policymakers changed the designation of the vouchers to help minimize the association between racist purposes and state action. For example, Virginia relabeled its tuition grants “scholarships” in 1959, and Mississippi christened its grants “loans” a decade later.Footnote 53 In Virginia's Prince Edward County, local segregationists closed the public school system for five years rather than submit to desegregation. Officials justified public funding of tuition grants for students at the whites-only Prince Edward Academy in terms of opaque “patriotic constitutionalism” rather than full blown “diehard segregation.” In this view, it was merely black parents’ irksome rejection of tuition grants for African American private schools that prevented black children in the county from receiving an education. This perverse logic exposes the segregationist intent of tuition grants beneath the superficial color-blind framing.
The thread between segregation and the modern era is palpable, as we show next. The sociologist Chris Bonastia makes this link, too: “In their views that tax money primarily should benefit the largest taxpayers, that government should fund private school education, and that segregation could be justified in non-racial terms, Prince Edward whites anticipated the ‘color-blind,’ conservative strain of rhetoric that gained currency in the late 1960s and the 1970s, and that continues to strive.”Footnote 54 The racialized nature of the rights of taxpayers over how funds are spent persisted in America's racial orders.Footnote 55
Even in states such as Arkansas and North Carolina that passed but did not distribute tuition grants, the passage of tuition grant legislation had powerful symbolic functions for segregationist elites. It rallied supporters, roused segregationists, and placated fears of federal takeovers. In Arkansas, Governor Orville Faubus—famous for refusing to protect black children at Little Rock in 1957—deployed the individualized rhetoric of color-blindness to express confidence that his tuition grants proposal would not be overturned by the courts: “It is just carrying a little bit further the rights of an individual. All students have constitutional rights—not just members of one race or group, although the present Supreme Court seems interested in only one race.”Footnote 56 Grants were justified on the grounds of “individual liberty” of association for parents and students.Footnote 57
Despite this homage to color-blindness, policymakers in the Jim Crow South were not always circumspect about their segregationist purposes. Representative Risley C. Triche of Assumption Parish, Louisiana, for instance, argued in the Louisianan House of Representatives in December 1960 that the grant-in-aid system was the most effective weapon against the integration of public schools.Footnote 58 Alabama Governor George C. Wallace called for tuition vouchers in order to hold the line against the threat of integration.Footnote 59
The racist motives of the sponsors of these state schemes did not escape some judges’ attention. A federal district court noted in its 1967 Poindexter ruling that Louisianan officials enacted tuition grants to deny black students equal educational opportunities: “For a hundred years, the Louisiana legislature has not deviated from its objective of maintaining segregated schools for white children. Ten years after Brown, declared policy became undeclared policy.”Footnote 60 Justice Wisdom added: “Open legislative defiance of desegregation orders shifted to subtle forms of circumvention although some prominent sponsors of grant-in-aid legislation have been less than subtle in their public expression. But the changes in means reflect no change in legislative ends.”Footnote 61 The federal courts in this case, and in other segregation voucher cases, saw through the color-blind justifications proffered by Southern politicians and struck them down as unconstitutional.
1.4. White Supremacist Policy Design and Administration
The educational expense grants were directed according to racial criteria to support segregation academies, entangling the state with racist purposes. Several tuition grant programs paid state funds not only to parents but also to the schools directly. New segregation academies were “private in name only.”Footnote 62 Their boosters’ notionally color-blind “freedom of choice” rhetoric notwithstanding, these earliest voucher programs were designed specifically to sustain the racial hierarchies of the Jim Crow era by embedding racial categories in the design and administration of policy.
Subsequent iterations of tuition grant laws excised explicit mentions of race, but the racial purposes of the statutes were clear. Under threat of court action, states attempted to camouflage the connection between government and segregated academies by funding parents and not schools directly. A key rationale was first articulated in Borden v. Louisiana (1928).Footnote 63 The court allowed parents a “free choice” as to where they use their state-funded tuition grant. This trope made the program “constitutional” by benefiting the child rather than the school directly (even if the school ultimately banked the money and thereby benefited “incidentally,” the benefit to the student was the statute's primary purpose).Footnote 64 In another effort to shield their program from legal challenge, lawmakers in Louisiana transferred administrative authority from the state Board of Education to a new arms-length agency, the Louisiana Financial Assistance Commission.Footnote 65
But these efforts to suppress the connection between state and school did not deceive federal courts, as revealed by cases such as Griffin v. County School Board of Prince Edward County in 1964. In Griffin, the “personal, parental, and race-conscious choice to discriminate was rendered de jure by virtue of state funding, which was used to support the voucher program.” In effect “the Supreme Court thus determined that this “exercising of school choice” with a voucher was a violation of Brown’s desegregation mandate.”Footnote 66
In Hall v. St. Helena Parish in 1961, the court said that tuition grant programs were a “transparent artifice” designed to circumvent blacks’ “constitutional right to attend desegregated public schools.”Footnote 67 In 1967, in Poindexter the court stated explicitly: “The United States Constitution does not permit the State to perform acts indirectly through private persons which it is forbidden to do directly.”Footnote 68
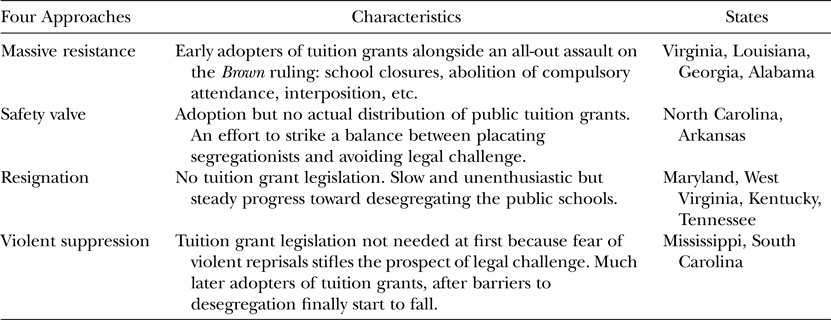
The temporality of early tuition grant vouchers reveals four different legal and political strategies on the part of southern states to stop desegregation using both direct and indirect methods (Table 3). Vouchers were an element in each strategy.
Vouchers in the Era of Segregation

First, states such as Virginia and Louisiana pursued immediate “massive resistance” policies in response to Brown, a belligerent, all-in, up-front approach that included school closings, outlawing public school desegregation, and espousing tuition grant payments and open defiance, and that ran the greatest risk of legal challenge. Vouchers were one part of the miasma of violent incidents and legal challenges by white segregationists.
Second, other states, such as North Carolina, deployed a measured approach to slow the pace of desegregation, placate segregationists, and reduce the likelihood of court override by authorizing (but not implementing) tuition grants.
Third, the border-south states—Maryland, West Virginia, Kentucky, and Tennessee—did not pursue tuition grants because they were resigned to at least token integration, particularly those with a small African American population.
Fourth, states such as Mississippi and South Carolina did not pursue tuition grants at first because, at least initially, they were unnecessary. Policymakers were committed to absolute school segregation and “most blacks understandably feared violent or fatal repercussions if they chose to press their case legally.”Footnote 69 This last group of states did eventually adopt tuition grants, but many years later than the massive resistance group and only when these states’ bulwarks against desegregation had begun to crumble at last.
In summary, vouchers were part of the general white supremacy effort to get white children out of the public school system to avoid inter-racial contact. This imperative was most acute in states such as Virginia that overlapped the southern Black Belt, which had adopted a defiant position to federal desegregation lawsuits but could not rely upon sheer brute suppression to prevent public school desegregation.
To a free market economist such as Milton Friedman, it made perfect economic sense that racist legislatures would enact measures such as vouchers to prop up segregation in schools (and logically in other policies such as housing and labor markets);Footnote 70 indeed, Friedman encouraged the arguments developed by University of Virginia economist James Buchanan in favor of opposing Brown by using vouchers.Footnote 71 But the practice and the theoretical argument were products of and integral to the political supporters of the segregationist racial order. Their chief opponent was the National Association for the Advancement of Colored People (NAACP), and the NAACP's chief weapon in the fight against segregation tuition grants was the courtroom.
2. Shifting Racial Regimes: Vouchers for Liberals and Race Targeting
2.1. The Origins of Midwestern Voucher Programs
In Mississippi, South Carolina, Alabama, Virginia, and Louisiana, lawsuits ended the segregation vouchers. Congress and the courts became more decisive in embedding civil rights in the decade between 1964 and 1973. As these laws and rulings took effect, the blatant use of publicly financed tuition grant vouchers for white students to escape desegregation was finally defeated. By 1970, segregation tuition grants had been struck down as unconstitutional across the South,Footnote 72 though segregated institutions, including private segregated academies, remained.Footnote 73
More broadly, segregation was legally displaced by the civil rights legislation in the 1960s enacted in response to the demands of the reform movement.Footnote 74 Legal and federally upheld segregation encountered decisive legislative defeat in the 1960s as Congress eventually passed laws against it in the mid-1960s. Combined with busing programs and new federal funding made available as a condition of desegregating schools, Southern states made dramatic strides to integrate schools between 1968 and 1973.Footnote 75
Court orders were also crucial in ending vouchers as tools of segregated schools. In the north, the voucher cause experienced further setbacks during the 1970s. Segregation was mostly not de jure in the North, but de facto present and resistance to school integration was fierce, and often violent.Footnote 76
A federal effort to institute a voucher program in New Hampshire foundered on local-level resistance in 1976.Footnote 77 A public school voucher demonstration project lasted just five years in the Alum Rock district, California. Voter referenda quashed voucher plans by large majorities. Scattered tuition reimbursement programs in Illinois, Nebraska, New York, Ohio, and Pennsylvania were struck down as unconstitutional between 1972 and 1974 on the grounds that they violated the separation of church and state. Unlike segregation tuition grants, these tuition reimbursement programs had incorporated the Catholic schools, which constituted a large section of all private schools then in existence.
Despite support for the idea of vouchers among members of the Office of Economic Opportunity during the Great Society Era, the Nixon and Reagan administrations, and even liberal academics such as Diane Ravitch and sociologist Christopher Jencks, no major voucher tuition programs were instituted during the 1970s and 1980s.Footnote 78 This was an era in which the race-conscious policy alliance's commitment to activist federal policy to advance racial equality enjoyed national political support, even if voter resentment toward affirmative action and related measures was brewing.Footnote 79
2.2. Voucher Designs as Race Targeting
The reinvented place of vouchers in America's racial hierarchies seemed to arrive in the early 1990s when two major voucher programs passed. Each targeted large urban school systems. The trajectory of America's racial hierarchies subsequently gave a new role to vouchers as part of a color-blind approach to policy. But first, some advocates for racial equality were drawn to the potential efficacy of vouchers as a race-targeted instrument. These two phases of race-conscious controversies correspond to the expansion and subsequent retrenchment of minority political rights within the larger trajectory of racial politics in the United States.Footnote 80
Responding to a perceived crisis of city schools, high drop-out rates, low test scores, and a growing urban African American population still enduring segregation and discrimination, the Wisconsin and Ohio legislatures passed the Milwaukee Parental Choice Program (1990) and the Cleveland Scholarship Program (1995), respectively. Amid mounting disillusionment and an expanding racial achievement gap, Republican politicians saw a wedge issue on which they could ally with nonwhite Democrats.
The racial dynamics of predominantly African American cities within overwhelmingly white states, combined with anger at stalling desegregation, weak public school performance, and growing black political power at municipal level, generated sufficient support for change.Footnote 81 Polls in the 1990s generally found that African American support for vouchers exceeded that of other racial groups (although responses varied with question wording).Footnote 82
In 1990 Milwaukee and Cleveland were 30 percent and 47 percent African American, respectively, compared to statewide populations that were 92 percent and 88 percent white (Table 4).
Racial Characteristics of Milwaukee and Cleveland's Populations, 1990

*State as a whole. Source: U.S. Census Bureau. 1990 Census of Population: General Population Characteristics (Washington, DC: U.S. Department of Commerce, Economics and Statistics Administration, Bureau of the Census: 1990).
Population data in Table 4 underestimate the percentage of African American enrollment in Milwaukee's and Cleveland's public schools because many white students had left the system for parochial schools over the preceding four decades.
The Milwaukee program initially excluded religious schools, but in 1995 the legislation was amended to include them. The program started to grow. From an initial enrollment of 258 students in the 1990–91 school year, the Milwaukee program swelled to 27,606 by 2016–17. In Ohio, the Cleveland program temporarily outstripped the Milwaukee program in enrollments but grew more modestly to 8,594 by 2017.
As vouchers moved into a new phase during the 1990s, the separation between the state and the private schools became sharper than it had been even during the era of Jim Crow. Since the Wisconsin and Ohio vouchers allowed religious schools to participate (unlike the segregation vouchers), it was essential to disguise the connection between state and school by the intervention of private parental choice. Both Wisconsin and Ohio have state constitutional provisions known as “no-aid provisions” that prohibit public funding of denominational institutions.Footnote 83 To avoid running afoul of these constitutional provisions, policymakers designed programs that funded parents rather than schools directly.
In the Supreme Court's 2002 Zelman v. Simmons-Harris case, this indirect program design acquired legal significance.Footnote 84 The majority justices held that “Our decisions have drawn a consistent distinction between government programs that provide aid directly to religious schools … and programs of true private choice, in which government aid reaches religious schools only as a result of the genuine and independent choices of private individuals.”Footnote 85 Although 96 percent of recipients used the Cleveland voucher at religious schools, the Court found “no evidence that the State deliberately skewed incentives toward religious schools” in the way that the Jim Crow segregationists had skewed the administration of tuition grants toward segregated schools. In the most extreme case— Griffin v. County School Board of Prince Edward County—there had simply been no nonsegregated in-county options for tuition grant recipients.
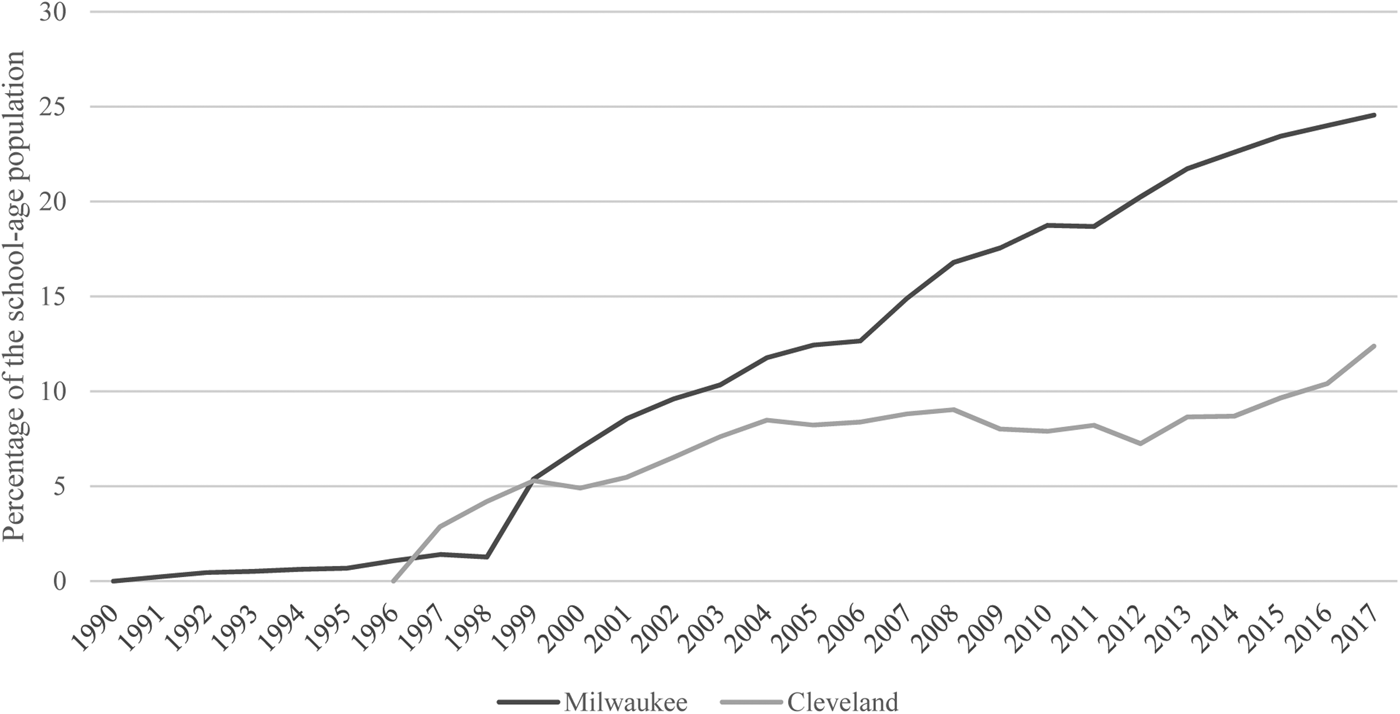
Immediately challenged in court by plaintiffs acting for public school administrators, teacher unions, and students, both voucher programs survived Supreme Court review and continued to expand. Figure 3 displays the expansion of voucher enrollments in these two programs as a proportion of the school-age population in each city. A quarter of Milwaukee's school-age population used a voucher in 2017.
Enrollment in the Milwaukee and Cleveland Voucher Programs as a Proportion of the 5- to 18-Year-Old Population in Each City.

2.3. Patterns of Support for Race-Targeted Vouchers
Wisconsin's program is an important punctuation in the movement from conservative Democrat to overwhelmingly Republican patterns of voucher support. It rested on a “strange-bedfellow” alliance launched in the late 1980s by Wisconsin state Representative Polly Williams. Williams, an African American Democrat, sponsored the Milwaukee Parental Choice Program legislation, allied with conservatives and the state's Republican governor, Tommy Thompson, to pass Wisconsin's first voucher program in an effort to improve an urban school system wracked with weak results and growing poverty rates.Footnote 86
A native of Mississippi whose family had moved to Wisconsin prior to school integration, Williams's advocacy of vouchers was unusual. Her colleague, former schools superintendent and founder of the pro-vouchers group Black Alliance for Educational Options (BAEO) Howard Fuller, recalled in a 2014 interview: “In ’88 being a black Democrat saying ‘I support vouchers,’ that was an unbelievably brave stand.”Footnote 87
Williams proved to be an outlier from most supporters of activist policy for racial equality, who campaigned for more spending on public schools in general, rather than selective voucher schemes. Although the use of vouchers as a mechanism for maintaining racial segregation did not appear explicitly in voucher discussions of the 1990s, the presence of race-conscious alliance members within the pro-voucher camp may have helped counter the impression that school choice was “a white, conservative movement that takes advantage of unwitting minority families.”Footnote 88
Representative Williams's work on behalf of the voucher cause was an instance in voucher history when the alignment of vouchers with the color-blind racial policy alliance broke down. While Republican conservatives never wavered in their support for vouchers—Governor Thompson had included a voucher proposal in his 1988 budget, and Governor George Voinovich pushed Catholic dioceses to join his voucher effort in OhioFootnote 89—Representative Williams's stance broke the race-conscious alliance's opposition to vouchers and helped give birth to a new constellation of race-conscious groups seeking to boost vouchers for race-conscious ends. Launched in 2000, BAEO was the lynchpin of that race-conscious pro-voucher alliance. They found some judicial support.
2.4. Judicial Patterns of Support for Vouchers
Patterns of political support shifted during the era of race-conscious controversies, and these shifts were mirrored in changing patterns of support by judges in voucher cases. Throughout the 1960s and 1970s, courts often found voucher programs unconstitutional. But from the mid-1980s and particularly since Zelman v. Simmons-Harris in 2002, courts became more likely to uphold vouchers’ constitutionality, a vital legal prop for programs enduring fierce criticism from many race-conscious alliance members including the NAACP. This legal imprint complements the post-1970s Supreme Court majority's dilution of affirmative action, set aside hiring and even voting rights.Footnote 90
To examine patterns of support for vouchers among judges, we collected and analyzed information on all judicial opinions in voucher cases from 1955 to 2017, unearthing several empirical trends. First, Republican justices (and those appointed by Republican executives) have been consistently more sympathetic to vouchers than Democratic justices, mirroring Republican policymakers’ support for voucher bills. Second, Southern justices were more sympathetic to vouchers than western ones. Third, justices have become more likely to uphold vouchers as constitutional over time, a finding consistent with Hackett's analysis of the broader universe of religious school aid programs.Footnote 91 This last trend extends the judicial patterns of the 1960s.
These findings show how during the transition of racial regime from segregation to the civil rights era, judicial decisions played a key role in facilitating the revival of vouchers despite their earlier rulings. This is part of America's racial trajectory. It illustrates how racial hierarchies are reconfigured along new divisions between active racial equality reformers and those opposing the use of federal policies for equality, a dichotomy along the lines of King and Smith's race-conscious versus the color-blind policy alliances.
Our database contains 229 individual justice votes on voucher cases, including opinion writers, concurring decisions, and dissents. This is the universe of cases. We subjected our database to logistic regression with standard errors clustered by court to examine the effect of justice and state characteristics upon judges’ likelihood of voting in favor of vouchers (Table 5). The dependent variable is coded 1 if the justice voted to uphold a voucher as constitutional, and 0 otherwise.Footnote 92
Judicial Decisions in Voucher Cases, 1955–2017: Logistic Regression with Standard Errors Clustered by Court

N = 231, pseudo R 2 = .280
*p < .1. **p < .05. ***p < .01.
Our regression shows that the patterns of support in courtrooms mirror patterns of support among policymakers, with Republicans most likely to vote in favor of vouchers even when controlling for sex, race, and other variables. Compared to Southern judges, we find that Westerners are less likely to uphold voucher programs as constitutional. Voucher bills have been held constitutional at a much faster rate in recent years, as the statistically significant result for the date of program challenge indicates. Republican-appointed judges are more likely to uphold voucher programs than Democratic-appointed judges.
The key difference between legislative and judicial realms before the breakdown of Jim Crow is that Democratic justices struck down policies passed by Democratic majorities. This split reflects the division between the Democratic Party's Northern and Southern wings during that racial epoch. Most baldly, Democratic federal court judges confronted measures passed by racially conservative Democratic majorities in Southern legislatures.
The clash between segregationist and anti-segregationist racial policy alliances is amply illustrated in decisions such as Harrison v. Day (1959), Hall v. St Helena Parish School Board (1961), and Lee v. Macon County Board of Education (1964), which found Virginian, Louisianan, and Alabaman tuition grant programs, respectively, unconstitutional.Footnote 93
Since the Jim Crow era, as partisan distinctions between race-conscious and color-blind alliances have inflamed, the Republican Party has continued to move toward racial conservatism and the Democratic Party broadened its racial liberalism.Footnote 94 Republican justices remain more sympathetic to voucher programs than Democratic justices, but they now mostly confront Republican rather than Democratic legislation. During the era of race-conscious controversies from the 1980s onward, judges became more supportive of voucher programs.
2.5. The Switch from the Freedom of Choice Frame to the Racial Equality Frame (and Back Again)
Although the Cleveland voucher program was held constitutional in the U.S. Supreme Court case Zelman v. Simmons-Harris in 2002, voucher bills grew at an indifferent rate during the following decade.Footnote 95 Enrollments in the Milwaukee and Cleveland programs continued to rise (Figure 3), but surprisingly few voucher bills were introduced in other state legislatures or passed by referenda. During George W. Bush's time in office, just eleven voucher programs were created at the state level, and a federally funded voucher program was inaugurated for Washington, DC. Several were struck down in court on First Amendment grounds, including programs in Colorado and Florida (see Figure 1). This period of sluggish growth extended to the 2000s.
James Forman concluded in 2007 that school vouchers failed to expand after Zelman because the sorts of arguments mustered in favor of vouchers did not resonate among the constituencies whose support they needed. In Forman's formulation, early advocates framed their pro-voucher arguments as a “values claim.”Footnote 96 Vouchers protected the right of parents to send their children to a school that reinforced their values. This framing rallied Christian conservatives to the voucher cause between the 1970s and the 1990s. It was also a core element of southern segregationists’ “freedom of association” framing during the 1950s and 1960s, a color-blind facade to conceal their racist purposes.
Beginning in the 1990s, Forman argues that supporters of vouchers switched from the values claim to a racial-justice claim that emphasized the right of low-income and minority parents to send their children to academically rigorous private schools.Footnote 97 The Wisconsin program fits this characterization. Representative Williams criticized public school desegregation plans for making black children “get up at 5 a.m., standing out in the dark and cold, so they can be bused to some faraway place where no one teaches them anything. [The white establishment] controls everything. White bus companies, white businesses, white suburbs … they get millions upon millions on account of Chapter 220 [the then 25-year-old desegregation plan].”Footnote 98
Forman concludes that, “the racial-justice claim asserted that vouchers provided educational emancipation for poor students, mostly black, trapped in dysfunctional urban districts.”Footnote 99 A switch in the “public face, intellectual rationale, and legal defense” of the voucher movement toward explicitly race-conscious arguments made the legal defense of the Cleveland voucher program easier, although it failed to resonate with white constituencies.
The new focus on helping minorities, rather than First Amendment issues, appealed to a majority of the Supreme Court. In his concurring opinion in Zelman, Justice Clarence Thomas wrote that “the failure to provide education to poor urban children perpetuates a vicious cycle of poverty, dependence, criminality, and alienation that continues for the remainder of their lives.” He declaimed: “If society cannot end racial discrimination, at least it can arm minorities with the education to defend themselves from some of discrimination's effects.”Footnote 100
In the 1962 reprint of his essay “The Role of Government in Education,” Milton Friedman removed the footnote that had positively identified the Southern programs designed to circumvent desegregation after the Brown ruling as leading examples of vouchers.Footnote 101 Friedman could obviously scent the political times and the racial equality tilt in national politics. His caution was shared widely by voucher advocates. When vouchers re-emerged as a major force in the 1990s, proponents now advanced a different set of rationales based on race-consciousness and targeting rather than the defense of racial inequality.
Members of the pro-voucher coalition advanced the framing of school vouchers as “the civil rights issue of our time.”Footnote 102 It was a deliberate strategy on the part of voucher supporters and their legal team in the Zelman decision, headed by Clint Bolick, co-founder of the pro-voucher organization Institute for Justice.Footnote 103 Their aim was to expand the base of support for vouchers and to help shore up its legal defense by claiming the mantle of the civil rights struggle in education.Footnote 104 Dr. Martin Luther King Jr.’s niece Alveda King endorsed school choice as a civil right in a Wall Street Journal op-ed.Footnote 105 Pennsylvania Governor Tom Corbett echoed Louisiana Governor Bobby Jindal, also a Republican, in calling vouchers “the civil rights issue of the twenty-first century.”Footnote 106
One signal of the extent to which vouchers had been re-imagined since their origins as instruments of segregation came in 2011, when the Pennsylvanian Democrat State Senator (and African American) Anthony H. Williams compared opponents of vouchers to segregationists: “Standing in the way of school choice for needy kids in failing urban schools is like Gov. George Wallace standing in the doorway of a classroom to continue the segregation of the ’60s.”Footnote 107 Historian Martha Minow concludes that, “Clint Bolick's strategy … paid off. Identifying poor black and Hispanic children as beneficiaries and aligning school choice with civil rights rather than against it seemed to work.… Public attitudes about school choice depended in no small part on the framing of the issue.”Footnote 108
Yet despite these efforts to claim the mantle of the civil rights movement, voucher growth was tepid into the first decade of the twenty-first century. Forman argues that such race-conscious claims repelled white conservatives.Footnote 109 The true voucher renaissance was still to come, nourished by the ascendance of the increasingly confident color-blind alliance.
3. Vouchers in the Civil Rights Era: The Color-Blind Resurgence
3.1. Modern Voucher Growth and Racial Spillover in the Obama Era
The real push for vouchers by state legislatures came midway through Barack Obama's first term as newly elected Republican legislatures started to exploit the Zelman clearance. This new thrust was a direct response to the heightened racial polarization of Obama's presidency and not confined to education policy. It was abetted by a shift in governance toward Republican control of state government after 2010 in legislatures across the country. Newly unified Republican governments in Indiana, Wisconsin, Alabama, Pennsylvania, North Carolina, and New Hampshire all passed voucher bills in the two years following the 2010 elections.
Just as his health care reform divided voters by race, so the Obama presidency galvanized opponents of racial equality to use vouchers as a means to keep education segregated.Footnote 110 The striking rise of vouchers is not causally explained by America's increasing racial polarization, but the correlation is hardly racially neutral. Tesler explains a similar contagion as racial spillover.Footnote 111 In the era of an African American president, public policies—notably health care and gun control regulation—become racialized in that voters viewed these issues through the prism of their racial policy preferences. Racial spillover spread into vouchers.Footnote 112
The use of race-conscious frames may have aided the legal defense of vouchers, but the literature on racialization demonstrates that the general public is negatively disposed to race-conscious measures aimed at aiding blacks.Footnote 113 Using racial-justice claims weakened the voucher cause by focusing on school underperformance. This emphasis opened the door for greater regulation of private schooling and alienated white conservative Christians, thus dooming the voucher cause as former supporters deserted it.Footnote 114 But other support was at hand. When vouchers were rediscovered again by Republican state legislatures after 2010, color-blind frames were ascendant nationally, even though these advocates felt the need to gesture toward potential race-targeted gains from vouchers.
The year 2011 was declared “the year of school choice.” It was merely a starting gun. Seven programs were created in 2011 alone, six in 2012, nine in 2013, and twelve more by the end of 2016. Designs varied: Some utilized tax credits and intermediary organizations for the distribution of grants. Other programs took an individualized savings account model. And all of them subsidized parents’ choice of private school tuition.
Southern legislatures embraced vouchers enthusiastically. Mississippi and Virginia passed their first modern voucher programs in 2012; Alabama and both Carolinas in 2013. By 2016 all seven of the original segregation tuition grant states had passed new voucher bills. Indeed, Alabama, Georgia, Louisiana, Mississippi, and South Carolina each had more than one such program. These were impeccably color-blind initiatives.
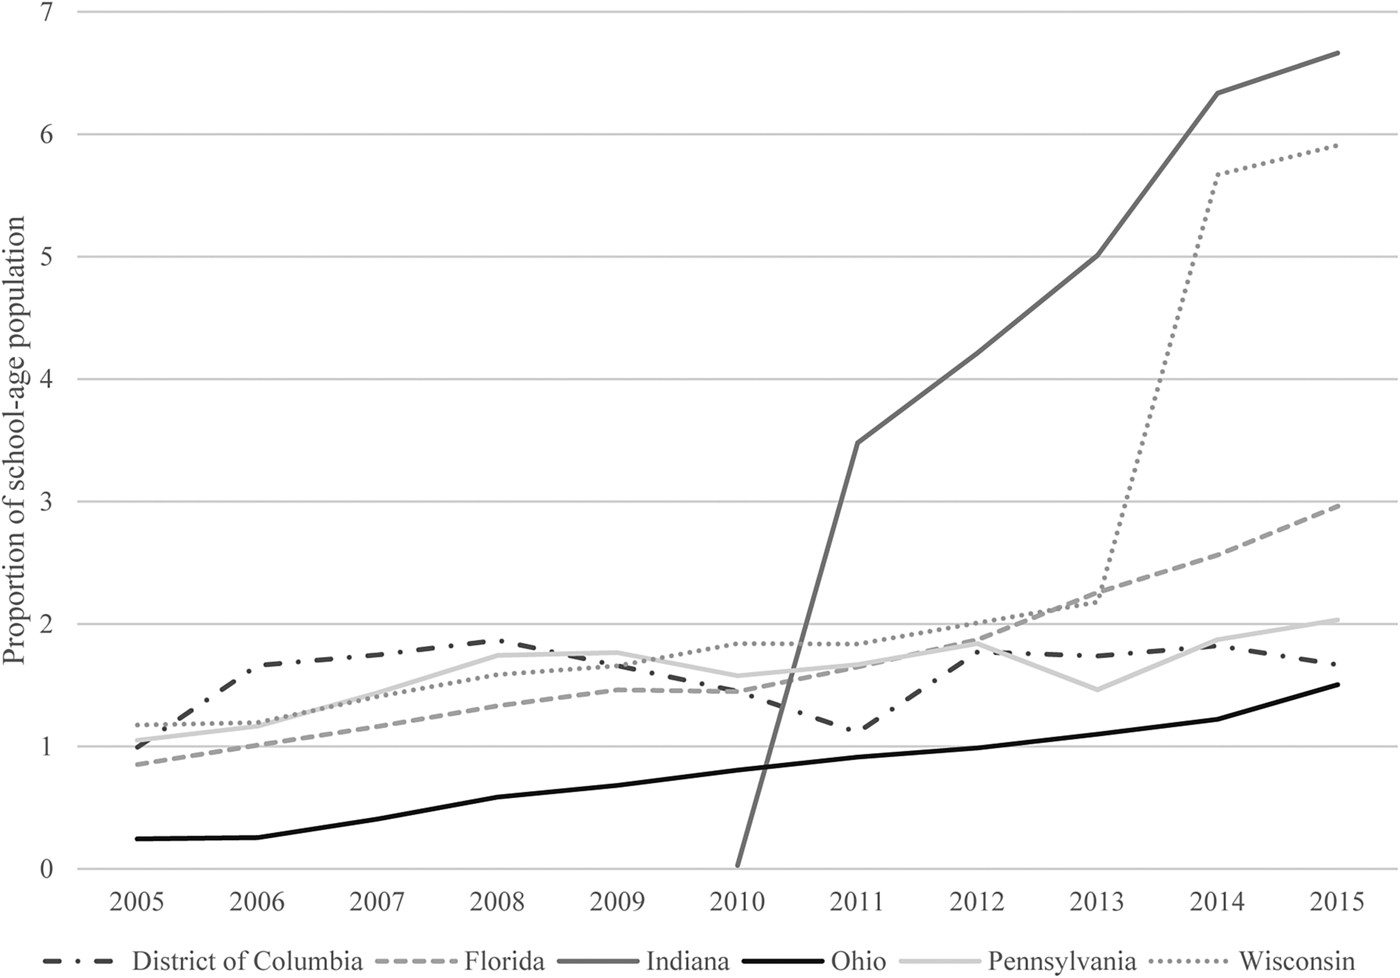
In this modern period, voucher programs stretched from Montana to Maryland and from New Hampshire to Nevada. Western states were generally less receptive to vouchers, although states such as Arizona and Nevada embraced them. Enrollments grew to more than half a million children nationwide across thirty states. In 2015, by our estimate, 665,760 students used some form of voucher. Figure 4 displays the growth of enrollments in voucher programs as a proportion of the school-age population in selected states.
Enrollments in Voucher Programs as a Proportion of 5- to 19-Year-Olds in Selected States, 2005–2015.

As Figure 4 shows, vouchers serve around 6 to 7 percent of the school-age population in school choice hotspots Indiana and Wisconsin, three times as many, proportionately, as were served by tuition grants in the Deep South after Brown.
The take-up of modern voucher programs varies depending upon the characteristics of the program and the state. By 2018 we calculate that there were eighteen programs targeted at disabled students (most in the South), sixteen programs targeted at low-income groups (most in the Midwest), two programs for students in failing schools, twelve programs with multiple eligibility requirements, and twelve universal programs with no eligibility limits.Footnote 115 Compensatory programs (those with income limits for participation) and those targeted at cities tend to attract a greater proportion of black participants. “Universal” programs such as those enacted by Indiana place no income or geographical limits on voucher participation and so tend to be dominated by whites, mirroring the disproportionate take-up of public tuition grant funds during the era of segregation.Footnote 116
Some states conspicuously failed to pass such programs, however. None of the three most populous states (California, Texas, and New York) had passed vouchers by 2017. New York and California were bastions of the liberal, increasingly Democratic race-conscious alliance, so their absence is unremarkable. In Texas at least six legislative efforts to enact vouchers failed in committee or on the floor, defeated by a strange-bedfellow state-based coalition of Democrats, rural Republicans fearing the loss of public school provision, and homeschoolers and Baptist groups fearful of governmental intrusion into religion, which has (so far) repelled federal pro-voucher organizations by campaigning for a distinctively Texan approach.Footnote 117, Footnote 118
3.2. Racial Alliances and Patterns of Support for Vouchers
The race-conscious alliance's opposition to vouchers looked precarious during the 1990s. But the mainstream civil rights organizations mobilized and prevailed. The NAACP and its local chapters organized vigorous opposition to vouchers. Aside from BAEO, the number of race-conscious proponents of vouchers remained small, with a mere handful of state- and local-level groups, such as Hispanics for School Choice (a Wisconsin group) and Black Clergy of Philadelphia, which mobilized on behalf of school vouchers during the most recent push for vouchers starting in 2011.Footnote 119 BAEO disbanded in 2017.
Well over 90 percent of voucher bills passed since Representative Williams's efforts in Wisconsin were created by color-blind alliance members and opposed by race-conscious alliance members. Between 1990 and 2017, seven programs passed Democratic-controlled legislatures, including in states such as Louisiana and Maryland with large African American populations, but they were dwarfed by the forty-eight programs that passed under unified Republican control.
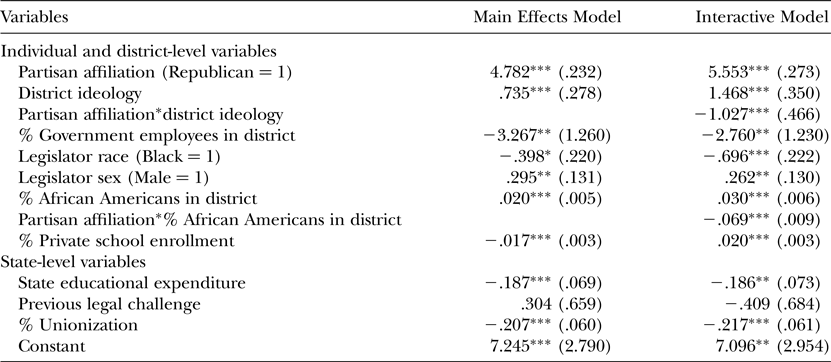
To examine patterns of voucher bill support, we collated an original data set of all state legislative votes on the forty-seven voucher bills passed in the twelve years from 2005 to 2017.Footnote 120 Our data set contains the universe of state legislators who voted on those bills in 6,693 votes plus twelve voucher bills that were brought to a vote before July 2017 but failed to become law because they were vetoed or voted down, yielding a total of 7,851 state legislator votes. We subjected our data to multilevel logistic regression to identify those factors that affect policymaker support for vouchers, modeling state legislators’ votes in terms of their individual and district-level characteristics (partisan affiliation, race, sex, district ideology, private school enrollment, racial district characteristics, and government employees) and state-level characteristics (educational expenditure, unionization rates, and previous legal challenges).
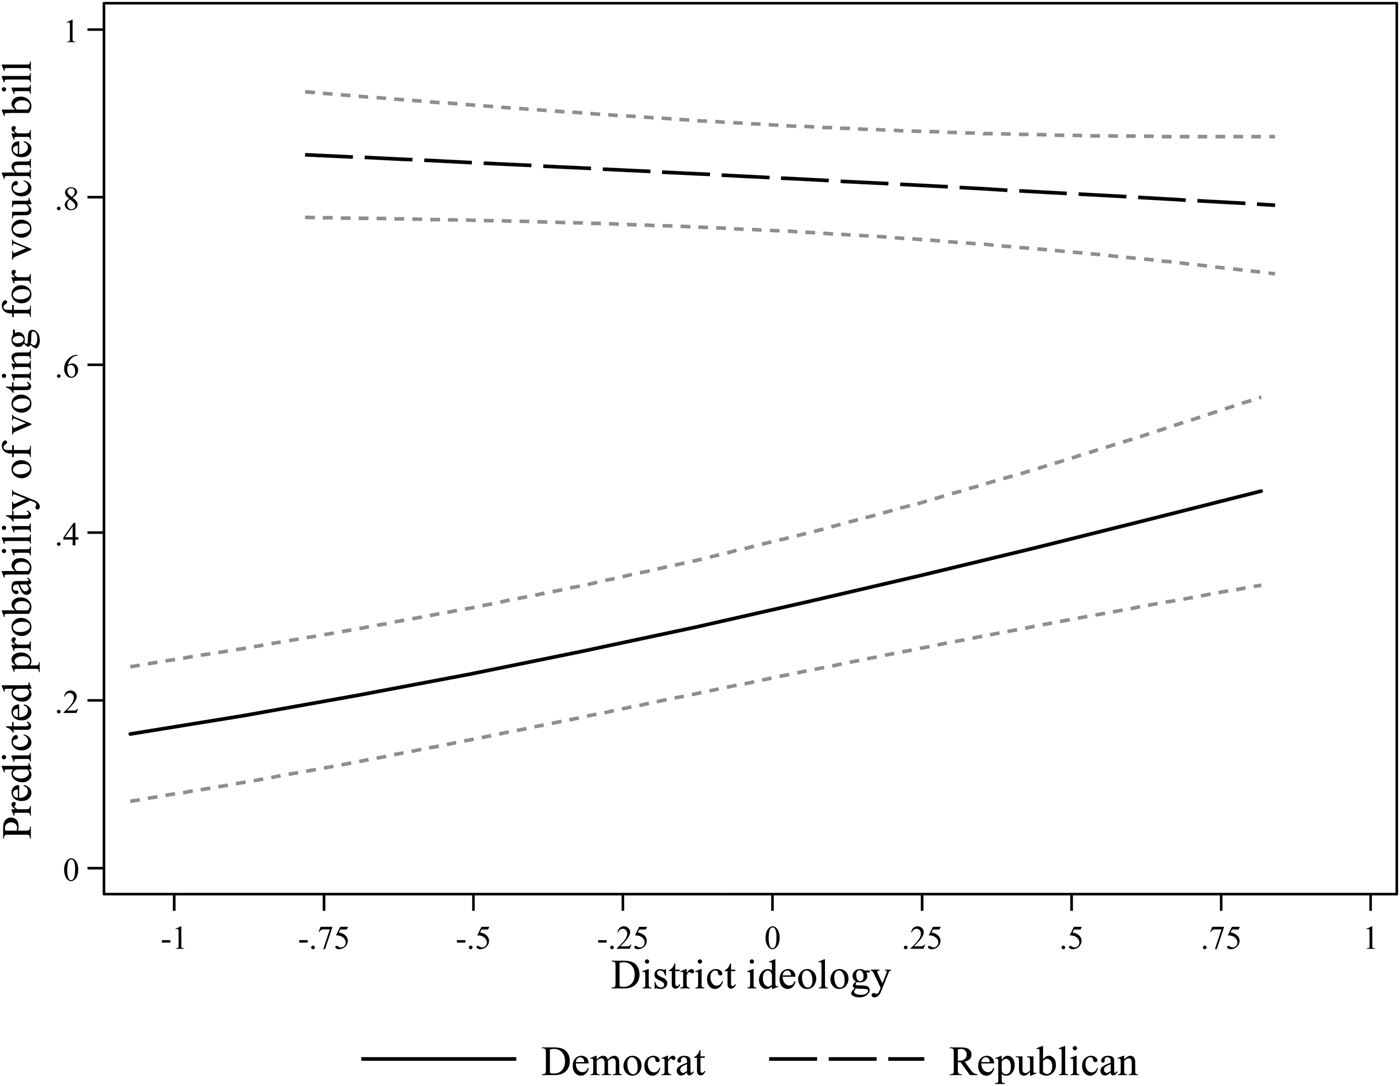
Our findings in the main effects model (Table 6) underline the extent to which race-conscious and color-blind patterns of support have become polarized. As expected, Republicans are much more likely to vote for a voucher bill than Democrats, but there is a statistically significant interaction with their state legislative district ideology, displayed in the interactive model in Table 6.
State Legislator Votes on Successful and Unsuccessful Voucher Bill Votes Held 2005–2017: Multilevel Logistic Regression with Robust Standard Errors Clustered by State

N = 6,026
*p < .1. **p < .05. ***p < .01.
To pinpoint state legislative district ideology, we used the American Ideology Project (2015) MRP (multilevel regression and poststratification) scoresFootnote 121 on district ideology after the 2010 census redistricting.Footnote 122 The more conservative their district, the more Democratic legislators are likely to vote in favor of vouchers. The effect is substantial and asymmetrical. A Republican state legislator has around an 85 percent chance of voting in favor of a voucher bill regardless of his or her district's ideology. By contrast, a Democratic state legislator with the most conservative district is more than twice as likely (42 percent) to vote in favor of a voucher bill than a Democratic legislator with the most liberal district (18 percent), as Figure 5 shows.
Interaction between Partisanship and District Ideology.

But Figure 5 finds that even a Democrat representing a conservative district still has a much smaller chance of voting in favor of vouchers than a Republican. Color-blind alliance members—Republicans and conservatives—overwhelmingly predominate among voucher supporters. Greater rates of unionization also have a statistically significant negative effect upon legislators’ chances of voting for vouchers. This finding underlines the teacher union presence as part of the Democratic coalition and race-conscious voucher opposition movementsFootnote 123 and union concern about vouchers’ potential to damage public schools.Footnote 124
We have already noted how racial and ideological polarization has intensified in the last decade and a half,Footnote 125 a trend reflected in the results. This growing polarization between the racial policy alliances means that voucher support aligns along partisan lines more sharply than during the era of Jim Crow, when Democratic judges struck down Democratic voucher legislation. Formerly enthusiastic liberal supporters of vouchers, such as Diane Ravitch, began to turn against the voucher cause after 2010.Footnote 126 They have become some of vouchers’ fiercest critics.
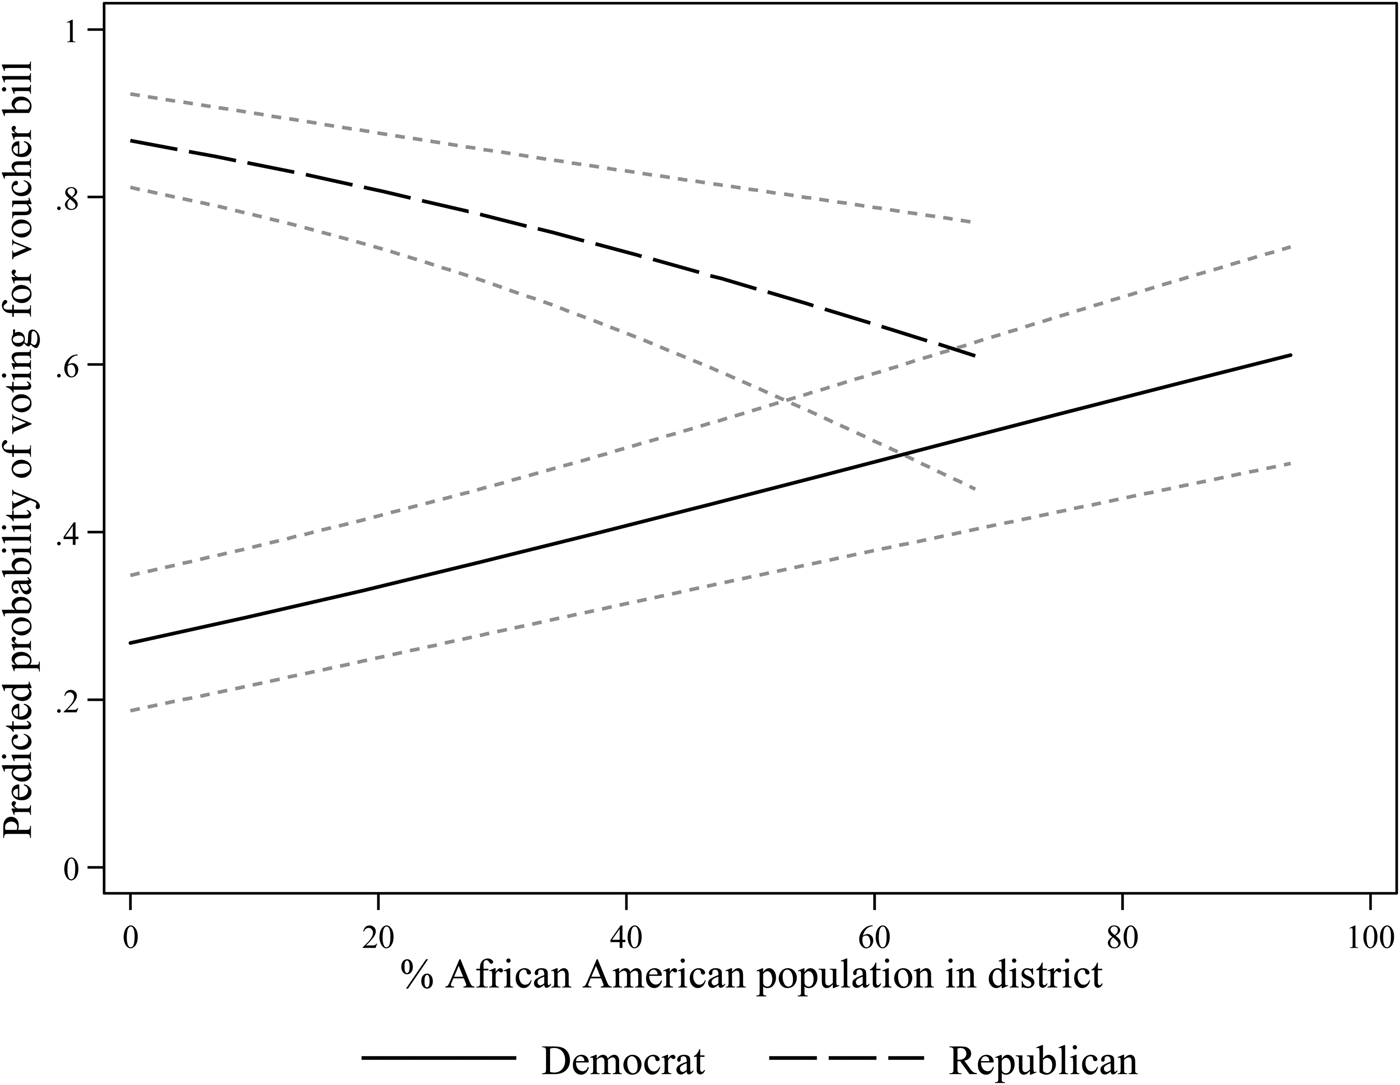
The color-blind alliance on school vouchers is complicated by the characteristics of legislators’ districts. White legislators (and males) are statistically significantly more likely to vote in favor of vouchers than nonwhite legislators and females. But our data show that the proportion of African Americans in a legislator's district is positively related to a vote in favor of vouchers (Table 6). Despite the opposition of most civil rights organizations and the dominance of conservative organizations such as the American Federation for Children, Cato Institute, Institute for Justice, and Goldwater Institute within the pro-voucher movement, the main effects model shows that legislators with the highest proportion of African Americans in their districts are 15 percentage points more likely to vote in favor of vouchers (77 percent chance) than legislators with the highest proportion of whites (62 percent chance). This striking datum recalls the patterns of support for tuition grant legislation in the Jim Crow South. Legislators with the whitest districts were, and still are, the least enthusiastic about the voucher cause.
One explanation for white districts’ relative reluctance is Forman's argument that racial-justice claims for vouchers fail to resonate with core white voucher constituencies.Footnote 127 Another possibility is that, despite their color-blind presentation, the race-conscious reimagining of vouchers during the first decade of the civil rights era activates feelings of racial threat among whites.Footnote 128
We cannot distinguish between these two explanations here but note the interaction between a legislator's party and his or her district racial characteristics. Republican legislators representing districts with a larger proportion of African American voters are less likely to support voucher legislation than Republicans representing whiter districts; Democratic legislators representing districts with a larger proportion of African American voters are more likely to support vouchers than Democrats in whiter districts (Figure 6).
Interaction between Legislator Partisanship and Racial District Characteristics.

Figure 6 suggests that at least some Democratic legislators perceive demand for vouchers from black constituents—an inference we cannot make firmly on the basis of this data—but the elite politics of vouchers remains resolutely framed by the race-conscious/color-blind distinction. Nonwhite legislators and Democrats are significantly less likely to support vouchers than white legislators and Republicans. The racial dimensions of vouchers tend to remain implicit in the contemporary racial order and buried beneath color-blind frames, to which we now turn.
3.3. Back to Freedom of Choice Frames
Modern arguments for school vouchers tend to be color-blind, at least on the surface. Legislators argue in favor of vouchers for poor children, implying that racial minorities are the target population without emphasizing race directly.Footnote 129 Gooden et al. find: “Contemporary case law, state statutes, and politicians who are proponents of vouchers have tended to adopt a race-neutral approach to using vouchers to address equity. This does not, however, mean that race is not a part of this debate.”Footnote 130 In the context of America's modern racial hierarchies and post-2008 intensified racial and ideological polarization, color-blind claims for vouchers may be promoted as impartial, but few voters or lawmakers can fail to grasp their racial implications.
Drawing upon a sample of 526 broadsheet newspaper articles drawn from Factiva for the twelve states that passed voucher programs in 2011 and 2012, the first years of the most recent voucher expansions, we find color-blind rationales overshadow race-conscious ones. A full description of method and coding procedures is available in the footnotes.Footnote 131 Seven of these twelve states had no reporting of explicit racial claims for or against vouchers at all. In the remaining five, claims for vouchers as a remedy for racial inequality were infrequent compared to choice, quality, and efficiency arguments.
In all states, color-blind framings predominated, focusing on individual parents rather than racial groups and eschewing racial language. The most common arguments cited in favor of vouchers were that they save money, improve educational quality, and increase access to educational opportunity for students and choice for parents. The most common arguments against vouchers were that they drain money from the public school system, defy the legislature's obligation to provide a good, uniform system of public education, and violate the separation of church and state by providing funds to religious schools. Explicitly race-conscious arguments that vouchers would address racial inequality were rare. Vouchers are framed in color-blind ways.
3.4. The Rise of Color-Blind Policy Design
The rise of the color-blind racial policy alliance is associated not only with color-blind patterns of support and rhetorical frames but also with color-blind policy designs. A race-conscious policy design uses explicit racial categories to confront racial inequalities directly through government action (what Justice Sonia Sotomayor calls “race targeting” measures), whereas color-blind policy designs favor a market-driven “free choice” approach by individual consumers. President Obama's Department of Justice fought some modern voucher programs in the South on the grounds that the programs had the potential to undermine existing court-ordered desegregation plans by enabling parents to opt out for private schools.Footnote 132
Modern, “universal” voucher programs—such as the tax credit vouchers in Arizona and Georgia—place no income limits on student eligibility and, in some cases, no requirement to have spent time in the public school before taking up a voucher. Race-conscious policy alliance members argue that targeting is required to ensure that children of color benefit and that public money is not distributed to economically advantaged households, who would have sent their children to private school regardless. When Representative Polly Williams and former Milwaukee superintendent Howard Fuller championed vouchers in 2010, they argued that the programs should not be extended to higher-income groups but instead should focus only on low-income minorities, a further cooling in race-conscious support for the new vouchers and the surge of color-blindness.Footnote 133
The rise of the color-blind policy design tends to obscure the state's role in the provision of a social benefit by directing funds through private third-party organizations or through the tax system.Footnote 134 Voucher policy designs became more “submerged,” utilizing private organizations or the tax system to deliver benefits. By funding parents rather than schools directly and utilizing tax credits and “educational savings accounts,” modern voucher programs individualize social policy decisions and obscure the relationship between state action and the confrontation of racial inequalities that is the hallmark of race-conscious policymaking.
The fight between advocates of compensatory vouchers and those who favor universal vouchers mirrors the clash between race-conscious and color-blind forces. It has been sharpened by the recent finding that color-blind voucher statutes provide insufficient protection against racial discrimination in private school admissions.Footnote 135 In May 2017, under questioning from members of the House Appropriations Committee, U.S. Secretary of Education Betsy DeVos declined to say if the federal government would step in to prevent voucher-receiving private schools from discriminating against students.Footnote 136 DeVos argued that decisions should be left to parents, an approach to voucher politics that is quintessentially color-blind in its elevation of individual choice over direct and purposeful state action.
Reducing the traceability of the connection between government and policy administration is a characteristic of color-blind policymaking. Individuals make choices in private markets that are officially color-blind, and the state is merely a neutral umpire. This submerged form of governance is the opposite of race-conscious policymaking, which involves direct state action to remedy racial disadvantage.
The Trump administration's 2018 fiscal year budget includes federal grant money to pay for school vouchers, delivering money indirectly, but faces opposition from Democrats and rural Republicans. A Department of Education spokesperson stated: “To be clear, there is no federal voucher program. The [private school voucher] grant program would support states who apply for funding to develop school choice programs, and those States’ plans must adhere to Federal law.”Footnote 137 This color-blind arms-length form of governance is increasingly characteristic of voucher politics.
4. Conclusion
Are vouchers truly color-blind or race-conscious? We have argued that the answer depends upon the historical context of America's racial hierarchies under examination. We have employed and refined the racial orders theoretical framework to account for the trajectory of vouchers since their origin in the 1950s.
Although the voucher schemes differ across the three eras discussed here, there are significant resonances because of the way in which public policy is shaped by America's racial orders. One such parallel between Jim Crow–era tuition grants and modern vouchers is that, when allowed to do so, parents who already send their children to private schools will tend to consume vouchers to a greater extent than parents whose children are in public schools. For example, 86 percent of Georgian tuition grant recipients in 1962 had already been enrolled in private schools before the fight over desegregation.Footnote 138 Thus grants tended to benefit those parents, principally whites, who already had the means to fund private education.
We argue that to understand the voucher renaissance observable since 2008, these measures must be located historically in America's racial hierarchies. This approach reveals how vouchers were directed toward white supremacist ends, briefly harnessed by the race-conscious alliance, and are now part of the conservative ideology of color-blindness that has surged since the Reagan era, bursting into the presidential election in 2016. This historical legacy illustrates the nonlinear trajectory of vouchers in America's shifting racial orders.
This trajectory is more than the layering of new policies onto existing schemes, one form of American political development that scholars identify. It qualifies the process of displacement described by Skowronek and Orren, of which the “overthrow of Jim Crow was a major” instance.Footnote 139 Yes, Jim Crow was displaced in national institutions, laws, norms, and routines, but unremarkably, the resilience of racial orders ensures that the contemporary voucher programs echo the racial hierarchies prompting their origin.
We identify multiple concurrent and consecutive transformations in voucher politics over time in three arenas of racial policy alliance conflict: multiplication of color-blind policy designs, growing legal and political support from a conservative alliance, and a smorgasbord of voucher rationales rooted in color-blind framing. Vouchers have never been racially neutral, but have served key roles with respect to the evolving racial politics of the post-Brown era. By examining the roles vouchers have played in the making and unmaking of racial hierarchies over time, we deflate the myth of their racial neutrality and reveal their contribution to the rise of color-blind ideology in national U.S. politics.