INTRODUCTION
The relationship between hydrology, geomorphology and riparian vegetation has long been of interest to ecologists. It is well known that riparian plant community composition varies as species respond to longitudinal changes in geomorphological processes, channel constraint and fluvial regimes. The topographical variation of transverse stream profiles determines water table access during low flows and the period and depth of inundation during high flows (Hupp & Osterkamp Reference HUPP and OSTERKAMP1996), and influences disturbance regimes, particularly fire and flooding (Busch & Smith Reference BUSCH and SMITH1995, Pettit & Naiman Reference PETTIT and NAIMAN2007). These patterns have been observed worldwide, although most studies focus on the moist temperate regions of Europe and North America (Cordes et al. Reference CORDES, HUGHES and GETTY1997, Hupp & Osterkamp Reference HUPP and OSTERKAMP1996, Naiman et al. Reference NAIMAN, DECAMPS and MCCLAIN2005, Tabacchi et al. Reference TABACCHI, CORRELL, HAUER, PINAY, PLANTY-TABACCHI and WISSMAR1998); arid, semi-arid and subtropical regions of Europe, Africa, Australia and south-western North America (Bendix Reference BENDIX1994a, Busch & Smith Reference BUSCH and SMITH1995, Friedman et al. Reference FRIEDMAN, AUBLE, ANDREWS, KITTEL, MADOLE, GRIFFIN and ALLRED2006, Harris Reference HARRIS1988, Hughes Reference HUGHES1988, Hupp & Osterkamp Reference HUPP and OSTERKAMP1996, Pettit et al. Reference PETTIT, FROEND and DAVIES2001, Tabacchi et al. Reference TABACCHI, PLANTY-TABACCHI, SALINAS and DECAMPS1996, Van Coller et al. Reference VAN COLLER, ROGERS and HERITAGE1997), or the moist tropics of South America (Junk Reference JUNK1999, Mertes et al. Reference MERTES, DANIEL, MELACK, NELSON, MARTINELLI and FORSBERG1995, Salo et al. Reference SALO, KALLIOLA, HAKKINEN, MAKINEN, NIEMELA, PUHAKKA and COLEY1986). Longitudinal studies of the riparian vegetation in the Earth's largest biome, the tropical savannas, has been largely overlooked.
Bendix (Reference BENDIX1994b) proposed that the scale and strength of transverse (across channel) and longitudinal (parallel to channel) stream processes can be inferred from the composition of riparian vegetation. Bendix (Reference BENDIX1994a) predicted that where longitudinal processes operate hierarchically over a larger scale than transverse processes, vegetation will vary in distinct homogeneous zones moving from the headwaters to lower reaches. Conversely, domination by transverse processes will result in the formation of narrow bands of distinct vegetation running parallel to the watercourse, but homogeneous across the watershed. Generally, where processes operate hierarchically over multiple scales, the relative strength of transverse and longitudinal processes as well as the scale at which various processes operate can be inferred from the resulting patterns of vegetation.
In this paper we investigate vegetation patterns within a tropical river system that spans four geomorphologically distinct zones (constrained upland, braided valley, and unconstrained lowland and floodplain regions) that vary in the strength of the link between transverse and longitudinal processes. In zones where longitudinal processes predominate we predict that stream order will correlate strongly with vegetation, and vegetation composition will vary longitudinally but not transversely. Where the transverse dimension is strongly linked to stream processes we expect vegetation patterns to correlate with transverse variables (e.g. transverse profile and distance to main channel), and for distinct transverse bands of vegetation to co-vary along a gradient from headwaters to floodplain.
Our study site is located within the South Alligator River system in Kakadu National Park (KNP), a World Heritage site situated within the mesic tropical savanna zone of Northern Australia. The South Alligator River drains a relatively undisturbed 9000-km2 catchment almost entirely contained within the boundaries of KNP. To our knowledge, this is the first comprehensive longitudinal study of vegetation patterns in a mesic (> 1200 mm mean annual rainfall) tropical savanna river system.
METHODS
Study area
The riparian communities of Kakadu National Park exist amongst annual disturbance cycles of flood and fire. Rainfall is highly seasonal – over 90% of the 1100–1500 mm mean annual rainfall falls between November and March and water levels commonly exceed stream bank height (Finlayson Reference FINLAYSON2005). Riparian vegetation exists within a matrix of savanna dominated by Eucalyptus miniata and E. tetrodonta (Wilson et al. Reference WILSON, BROCKLEHURST, CLARK and DICKINSON1991). The 1–2-m-high grass layer cures in the dry season and can then carry surface fires that burn 50% of the landscape annually (Russell-Smith et al. Reference RUSSELL-SMITH, RYAN and DURIEU1997).
The flora of the region lies along a moisture and topographic gradient that varies with dry-season access to the water table and the depth and length of wet-season inundation (Bowman & McDonough Reference BOWMAN and MCDONOUGH1991, Finlayson Reference FINLAYSON2005), although soil (Bowman & Dunlop Reference BOWMAN and DUNLOP1986, Franklin et al. Reference FRANKLIN, BROCKLEHURST, LYNCH and BOWMAN2007) and fire (Russell-Smith et al. Reference RUSSELL-SMITH, WHITEHEAD, COOK and HOARE2003) also contribute significantly to the complex patchwork of ecological communities. Broadly speaking, the hydrological gradient extends from low-lying annually submerged floodplains, then intermittently flooded woodlands, and finally more elevated woodlands that are not inundated.
The South Alligator River catchment is oriented along a south–north elevational gradient that crosses three land-system types: the Arnhem Land Plateau, the Gimbat Valley and the lowland plains (Figures 1 and 2). These elements are analogous to the erosional, transitional and depositional river provinces described by Tabacchi et al. (Reference TABACCHI, CORRELL, HAUER, PINAY, PLANTY-TABACCHI and WISSMAR1998) but with two important qualifiers: (1) the gradient across the Arnhem Land Plateau is slight compared to the headwaters of the river systems described by Tabacchi et al. (Reference TABACCHI, CORRELL, HAUER, PINAY, PLANTY-TABACCHI and WISSMAR1998) and the rate of upland erosion is extremely low (Saynor & Erskine Reference SAYNOR and ERSKINE2006); (2) most deposition comes from downstream (via tidal influx, which extends 105 km inland; Woodroffe et al. Reference WOODROFFE, CHAPPELL, THOM and WALLENSKY1989), rather than from upstream sources.
Map of the South Alligator River catchment and study locations.

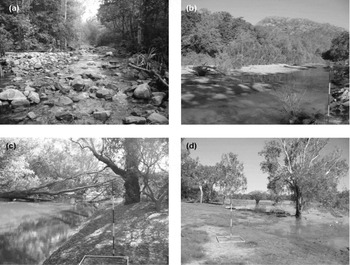
Photographs illustrating stretches of the South Alligator River catchment within each of four regions where vegetation was sampled, including a tributary within a ravine of the Arnhem Land Plateau, with forest dominated by Melaleuca leucadendra and Xanthostemon eucalyptoides (a); a depositional stretch containing sand bars in the Gimbat Valley with numerous Melaleuca leucadendra saplings growing along the sandbar and more developed riparian forest in the background (b); a typical section of the South Alligator River in the lowland plains with large Melaleuca argentea and M. leucadendra trees intermixed with Barringtonia acutangula abundant along the stream edge (c); and a perennial backwater lagoon (billabong) fringed with Melaleuca viridiflora that connects to the South Alligator River in the wet season (d).

The headwaters of the South Alligator River are located on the Arnhem Land Plateau, a mass of uplifted Proterozoic sandstone lying 150–250 m above the surrounding lowlands (Figures 1 and 2a). Soils are generally veneers of sand seldom more than 150 mm thick (Russell-Smith et al. Reference RUSSELL-SMITH, NEEDHAM, BROCK, Press, Lea, Webb and Graham1995). Creeks are typically confined within very narrow channels bounded by steep, sometimes vertical, sandstone banks. The porous sandstone also supports a large aquifer and numerous fissures produce springs that maintain dry-season flow within the major channel of the South Alligator River and some tributaries. However, most of the lower-order streams in the catchment are seasonal and cease flowing during the dry season.
The South Alligator River descends from the Plateau into the Gimbat Valley, a large valley running roughly south-east–north-west (Figures 1, 2b). Stream structure within the Gimbat Valley is often braided and complex with alternating depositional and erosional reaches. Step-pools are more abundant in the upper reaches in the valley, and pool-riffle-bar structures (Church Reference CHURCH2002) are common in the lower reaches. Much of the watercourse is constrained to alluvial channels by vegetated sandy ridges (Wende & Nanson Reference WENDE and NANSON1998).
After the Gimbat Valley the river crosses into large undulating lowland plains with highly eroded and laterized soils. Flow is constrained by a deeply incised channel bounded with alluvial ridges that are regularly breached in the wet season (Figures 1 and 2c). Some 120 km from the coast, the river joins two major tributaries, Jim Jim and Barramundie creeks, and the active river channel increasingly interconnects with a series of palaeochannels and cracking-clay floodplains that fill during the wet season and remain underwater for a substantial portion of the year (typically 4–7 mo; Finlayson Reference FINLAYSON2005) (Figure 1d). Below its confluence with Jim Jim Creek, the active river channel drains into a vast floodplain. A tidal channel reforms some 10 km downstream but most wet-season flow is carried as surface flow across floodplains that reach up to 20 km wide.
Riparian-zone community structure
We surveyed 28 sites (Figure 1) along either active channels of the South Alligator River and its tributaries or backwater depressions on floodplains that connect to the South Alligator River in the wet season and retain water throughout the dry season (perennial billabongs). Surveys were conducted from April to September in 2003 and 2004. Sites were selected on the basis of interviews with both Aboriginal residents and Park staff to reflect a representative sample of communities throughout the Arnhem Land Plateau, Gimbat Valley and lowlands.
Within each site we established four to six transects of 200 m length, each running parallel to the main direction of the channel. We typically ran three transects on each side of a channel although if the opposite bank was inaccessible we established an additional three transects 1–2 km along the stream from the initial transects. Two transects were established within riparian forest that was >10 m wide, one adjacent to the main water-bearing channel and the second at a distance marking the midpoint of the forest community. In forests narrower than 10 m (22 out of 59) only one transect was used, and placed within the midpoint of the forest community. At all sites an additional transect was placed within the mid-point of the woodland community adjacent to the riparian forest (or 50 m from the forest boundary if the width of the woodland community was >200 m and hence immeasurable in the field).
At the site of each set of transects we recorded the widths of the riparian forest and woodland communities, the distance to the opposite bank of the water-bearing channel, the bank slope, the slope of the riparian forest and woodland communities (measured orthogonally to the active channel), and the aspect of the active channel. Where we were unable to calculate the riparian woodland distance in the field, we estimated the distance from 1:25 000 aerial photos taken in 2004. Woodland distances were positively skewed and were logarithmically transformed to approximate normality. A-horizon soil type was determined at each transect using the ribbon test of McDonald et al. (Reference MCDONALD, ISBELL, SPEIGHT, WALKER and HOPKINS1998) and then classified into five textural groups: clay, clay-loam, loam, sand-loam and sand.
We recorded the species, diameter at breast height (dbh), and distance of the four closest trees >5 cm dbh along each transect at 20-m intervals (the point-centre-quarter method; Mueller-Dombois & Ellenberg Reference MUELLER-DOMBOIS and ELLENBERG1974). For multi-stemmed trees, individual stems were recorded and basal area summed. Each tree was also scored for the presence or absence of charring on the trunk. At each 20-m interval we also recorded canopy cover using a densitometer, and scored each interval as burnt or unburnt. Strahler stream order (Strahler Reference STRAHLER1952) of the channel associated with each transect was calculated from 1:100 000 topographic mapsheets covering the South Alligator catchment (Royal Australian Survey Corps 1997).
Data analysis
Nomenclature, species groups and classification of transects. Nomenclature follows Kerrigan & Albrecht (Reference KERRIGAN and ALBRECHT2007). Some species shared highly similar functional attributes with other species and/or were difficult to distinguish in the field. These were aggregated as follows and treated as unique species for the purposes of community analysis: Acacia spp. – Acacia aulacocarpa, Acacia difficilis, A. gonocarpa, A. hemignosta, A. holosericea, A. lacertensis, A. mountfordae, A. plectocarpa, A. sericoflora, A. torulosa, A. tropica; Calytrix spp. – Calytrix arborescens, C. brownii; Corymbia spp. – Corymbia foelscheana, C. latifolia; Ficus spp. – Ficus brachypoda, F. coronulata, F. racemosa, F. virens; Ficus aculeata/scobina – Ficus aculeata, F. scobina; Gardenia spp. – Gardenia fucata, G. kakaduensis; Pavetta spp. – Pavetta brownii, Pavetta sp.
Each transect was attributed based on (1) vegetation structure (riparian closed-forest and woodland) and (2) region (Plateau, Gimbat Valley, lowland). To test for transverse variation in riparian closed-forests, transects occurring within the forest were further classified by whether they were closest to the watercourse (‘stream’) or in the middle of the riparian zone (‘middle’). Where there was only one forest transect it was attributed as ‘stream’. All transects within sites at backwater depressions were simply classified as ‘floodplain’ without further classification as all occurred in the lowlands and were typically surrounded by homogeneous vegetation without a distinct fringe around the billabong.
Multivariate analyses. We used two techniques to test for differences in community composition across transverse and longitudinal gradients: (1) Ordination using non-metric multidimensional scaling (NMDS) with the packages MASS 7.2–29 and Vegan 1.8–5 in R 2.4.0 (http://cran.r-project.org). Bray–Curtis dissimilarity was calculated between the fourth-root-transformed dominance scores within each transect. (2) The percentage of similarity between each transect class (stream, middle, savanna and floodplain) and the contribution of each taxon to the overall similarity between classes was quantified by the SIMPER routine in PRIMER (Version 6.1.2, Plymouth Marine Labs, Plymouth, UK; Clarke & Warwick Reference CLARKE and WARWICK1994). These differences were statistically tested using one-way analysis of similarities (ANOSIM) to non-parametrically test the average rank similarities of samples between classes.
To test for correlation between dominant vegetation and other environmental variables we first divided the environmental data set into two groups: (1) Soil type: a categorical environmental variable. (2) Width of the riparian woodland and forest zones; distance to the opposite bank; slope of the bank, riparian forest zone and riparian woodland zone; channel aspect; stream order; per cent of trees charred and per cent of quadrats burnt. These continuous environmental variables were normalized so that comparisons between variables of different scales and origins were meaningful. This was achieved by subtracting from the mean and dividing by the standard deviation for each variable, giving each variable the same mean (0) and variance (1).
Environmental variables were selected that maximized the rank correlation between a similarity matrix of the variable set and the transformed dominant vegetation scores (the BEST procedure in PRIMER 6.1.2). Subset similarity matrices of taxa that contributed >10% to total dominance in any transect were also correlated with the overall vegetation matrix to determine the subset of taxa that best explained the variation between communities. Soil was fitted to the MDS ordination scores as a generalized additive model (GAM) using the R package vegan.
The BEST procedure is considered more robust than other methods that typically rely on linear regression (Clarke & Ainsworth Reference CLARKE and AINSWORTH1993). However, it is difficult to visually interpret. We decided to use BEST to select the most important variables and then present those variables here as linearly correlated vectors. This is useful for interpretation, but can be misleading when it masks non-linear patterns. To avoid misinterpretation we also separately plotted each variable as a fitted two-dimensional GAM surface. Where there were significant deviations from the linear pattern implied by fitted vectors we discuss them in the explanatory text with each figure.
RESULTS
Dominant vegetation structure
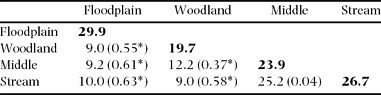
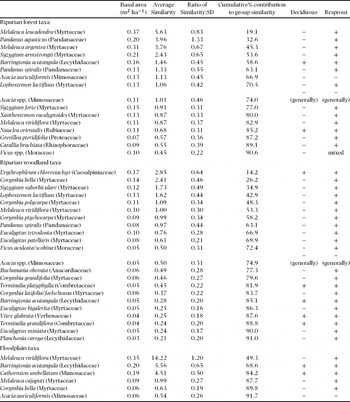
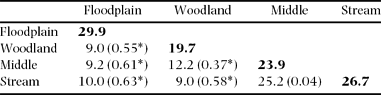
A total of 125 woody species >5 cm dbh were recorded, including species that were later aggregated into groups for analysis (see Appendix 1 for a complete list of species recorded). The SIMPER-derived measurement of similarity within transect groups was very low, indicating a high degree of diversity between sites (the most similar group, floodplains, had a within-group similarity of only 30%, Table 1). Moreover, despite a very clear structural distinction between forest, woodland and floodplain vegetation communities, there was intergradation of taxa between community types, and most transect groups shared about 10% of their species with other groups. There was no distinguishable difference between the dominant taxa of stream and middle transects within riparian forest.
Per cent similarity of mature woody species between and within groups (within-group similarities are indicated by bold). Parentheses indicate the level of difference between groups using the ANOSIM non-parametric test statistic R in Primer 6.1.2 (0 indicates complete similarity, 1 indicates complete dissimilarity). The significance of R against the null hypothesis of no difference (R = 0) is indicated by an asterisk (P < 0.001).
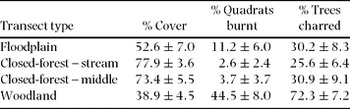
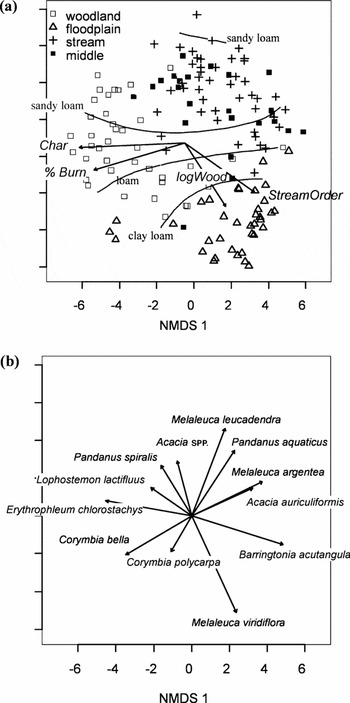
Forest and woodland vegetation segregated by cover and the occurrence of fires, as well as floristic composition (Table 2, Figure 3; see Appendix 2). Soil texture segregated with community type along both longitudinal and transverse axes: woodlands were typically found on sandy loams or sands, riparian communities on sand, and floodplains on clay and clay loams (Figure 4).
Fire history and cover by transect type. ‘Quadrats burnt’ indicates the mean percentage of quadrats scored as burnt during field surveys. ‘Trees charred’ indicates the mean percentage of trees with indications of charring scored during field surveys. The standard error is provided after the mean.

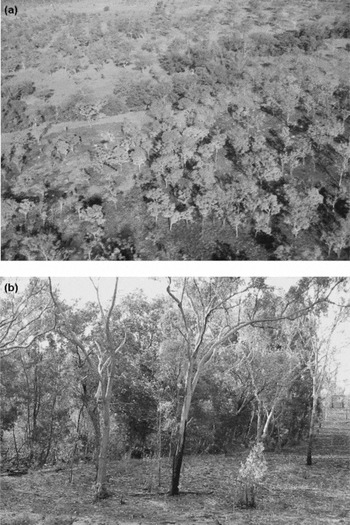
Fire along the woodland–closed-forest boundary. An aerial view of Gerowie Creek, a small tributary of the South Alligator River. A fire through upland and riparian woodland in the foreground stopped short of the darker band of closed-forest following the creek horizontally across the upper third of the photo (a). The adjoining riparian woodland in the background is unburnt. A fire along a different section of Gerowie Creek stopped after burning into the edge of the riparian forest (b).

NMDS ordination of all transects (N = 144, stress = 24.5). A best-fit of environmental vectors provided a Pearson's correlation of ρ = 0.42 from four variables: stream order, the logarithmic distance of the riparian woodland zone (logWood), percentage of trees charred (Char) and percentage of quadrats burned (PctBurn) (a). Also shown is a GAM fit of soil type. A vector fit of 11 species provided a Pearson's correlation of ρ = 0.90 (b). Lophostemon lactifluus and Pandanus spiralis do not follow the gradient indicated by their vectors but their greatest abundances are centred on the tip of their respective vectors, and generally decline away from that point.

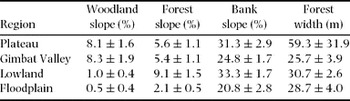
The transverse profile of streams differed amongst regions (Table 3). Bank slope was relatively similar across regions, but this was an inadequate indication of the transverse profile. Floodplain banks often had a very slight profile (on the order of 10 cm), whereas lowland banks along the main channel of the South Alligator River were frequently 5–10 m high. A better indicator of vertical relief was the slope within the forest vegetation zone, which typically abutted the dry-season watercourse and rarely extended more than 10 m beyond the channel bank. Average slope within forest vegetation was similar between the Plateau and Gimbat Valley, and then increased dramatically in the lowland plains. By contrast, the average slope of the adjacent woodland vegetation declined, and the width of the woodland vegetation zone increased, an overall indication of the increased extent of the seasonal inundation zone in the lowlands. Closed-forests along the more developed banks of lowland plains did not differ in width from their upstream counterparts.
Transverse stream profiles and dominant species richness by region. All slopes are perpendicular to the main direction of the channel. The standard error is provided after the mean.

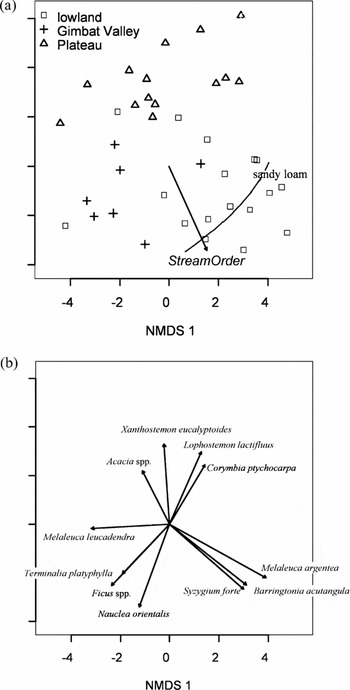
The species composition of riparian closed-forests was largely independent of the transverse profile, and varied with stream order (Figure 5). Forests were generally dominated by Melaleuca leucadendra in the Plateau and Gimbat Valleys and co-dominated by Melaleuca argentea and M. leucadendra along lowland forests. Plateau riparian forest sites were more likely than other regions to contain species otherwise associated with woodland (Lophostemon lactifluus, Grevillea pteridifolia, Erythrophleum chlorostachys and Corymbia ptychocarpa, Figure 5b). Two riparian-forest sites were floristically distinct from each other and all other sites and contained neither Melaleuca spp. nor species associated with woodland or floodplain sites. These are indicative of the highly diverse, but relatively small, pockets of non-Melaleuca-dominated closed forest that line streams in monsoonal north Australia.
NMDS ordination of riparian transects (N = 39, stress = 17.2). Basal area scores of stream and central transects were combined within each site. Data points are displayed according to biogeographic region. A best-fit of environmental vectors provided a Pearson's correlation of ρ = 0.45 from one variable, stream order (a). Also shown is a GAM-fit of soil type. A vector fit of 11 species provided a Pearson's correlation of ρ = 0.75 (b). The gradient of Melaleuca leucadendra does not follow the gradient indicate by its vector, but is most abundant towards the centre-left of the ordination and declines away from that position.

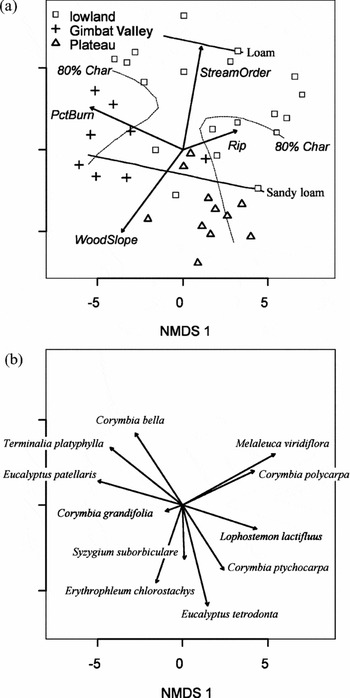
The composition of open woodland varied greatly. Stream order and woodland slope were negatively correlated (Figure 6) such that high-order lowland streams often had low woodland profiles, and hence were particularly susceptible to flooding. Low-order streams on the Plateau were frequently abutted by Eucalyptus tetrodonta woodlands (Figure 6b), the dominant upland plant community in the region. Syzygium suborbiculare, Erythrophleum chlorostachys and other upland taxa were also more common within woodlands on high slopes. Corymbia bella, C. ptychocarpa, C. polycarpa, C. grandifolia and Lophostemon lactifluus occupied lower positions. At the lowest point of the topographic gradient, Melaleuca viridiflora commonly occupied poorly drained depressions within lowland woodlands.
NMDS ordination of woodland transects (N = 38, stress = 21.9). Data points are displayed according to biogeographic region. A best-fit of environmental vectors provided a Pearson's correlation of ρ = 0.41 from six variables: stream order, width of the riparian forest zone (Rip), percentage of quadrats burnt (PctBurn), percentage of trees charred (Char) and slope within the riparian woodland zone (WoodSlope) (a). Also shown is a GAM fit of soil type. The gradient of riparian width is non-linear, with higher values trending towards the upper right and lower centre of the ordination. Char is also non-linear, and the GAM contour line representing 80% of trees charred is shown in place of a vector to avoid misinterpretation. A vector fit of eleven species provided a Pearson's correlation of ρ = 0.91 (b). The gradient of Erythrophleum chlorostachys is non-linear with the greatest abundance tending toward the centre of the vector.

The composition of floodplain vegetation along backwater depressions varied according to stream order, with little transverse zonation. Dense Melaleuca viridiflora and M. cajuputi forests tended to dominate closed-forests along depressions connected to high-order streams while sparse Vitex glabrata and Corymbia bella open-woodlands were associated with lower-order streams.
Fire
Fire occurrence was strongly associated with woodland communities and within woodland communities formed an orthogonal axis to slope (Figure 6a). Judging from the occurrence of burnt quadrats and charred trees, fire occurrence is relatively rare within riparian forests (Table 2). The percentage of charred trees in woodlands was generally very high (>60%) and was not correlated with other fire indicators. Rather sites split bimodally into one group positively correlated with frequent fires and another negatively correlated (Figure 6a). Woodland communities in the Plateau were the least burnt amongst woodlands, possibly reflecting topographic protection. In woodland sites overall, species found along high-order streams and low slopes were associated with lower fire frequencies. Likewise, floodplains associated with lower-order streams had a higher fire frequency than high-order floodplains.
DISCUSSION
We observed variation in riparian vegetation across three different directions and scales: transversely across the woodland/forest boundary, longitudinally within the forest community, and longitudinally within the woodland community. The boundary between woodland and forest riparian communities was structurally distinct and persisted from the headwaters to the lower reaches, only breaking down in the floodplains. This implies large-scale control by transverse processes across most of the catchment. At a smaller scale, forest vegetation segregated into distinct communities based on longitudinal position, and stream order was the strongest correlate of community composition (Figure 5), implying strong dominance by longitudinal processes within riparian forests. Finally, woodland communities varied either independently or dependently of longitudinal variables depending on the strength of the transverse connection between woodland and stream.
We propose that the woodland forest boundary is formed by declining dry-season access to groundwater away from the active channel and the impact of regular fires carried from woodland towards the water channel that limit the recruitment of forest species within the woodland zone, and this has been observed in comparable river systems in Australia and elsewhere. Lamontagne et al. (Reference LAMONTAGNE, COOK, O'GRADY and EAMUS2005) indicated that dry-season access to water was the most important factor in the establishment of closed-forest vegetation along the Daly River, a larger river system 300 km to the south-east of the South Alligator River. Groundwater access has also been linked to vegetation distribution in arid and semi-arid river systems (Hupp & Osterkamp Reference HUPP and OSTERKAMP1996, Van Coller et al. Reference VAN COLLER, ROGERS and HERITAGE1997).
The nearly universal dominance of Melaleuca along streams in this study contrasts a study by Douglas et al. (Reference DOUGLAS, TOWNSEND, LAKE, Andersen, Cook and Williams2003) of small intermittent streams along lower reaches of the South Alligator River. There, streamside vegetation primarily comprised woodland species (e.g. Erythrophleum chlorostachys, Corymbia polycarpa, Lophostemon lactifluus, Melaleuca nervosa, M. viridiflora and Terminalia platyphylla) and had lower cover than that reported for riparian forests here. Our study did not include smaller intermittent streams, and taken together both studies suggest that a minimum level of stream size is needed to form Melaleuca closed-forest. Both M. leucadendra and M. argentea are relatively fire-tolerant (Franklin et al. Reference FRANKLIN, BROCKLEHURST, LYNCH and BOWMAN2007) and may establish the closed canopy under which other, less fire-tolerant vegetation can develop; both species are absent from the riparian vegetation described by Douglas et al. (Reference DOUGLAS, TOWNSEND, LAKE, Andersen, Cook and Williams2003). Once a closed Melaleuca canopy establishes, higher humidity and lower grass cover inhibit the incursion of fires into the closed-forest zone (Pettit & Naiman Reference PETTIT and NAIMAN2007), and may encourage the establishment of fire-intolerant species. Indeed, species elsewhere associated with closed-forest, fire-intolerant ‘rain-forest’ communities (as described by Russell-Smith Reference RUSSELL-SMITH1991) were common within most Melaleuca-dominated riparian forests. In Plateau regions, topographic protection from fire may also explain why the riparian forest is wider on average than for other regions, despite smaller stream sizes (Table 3).
Longitudinal variation within riparian closed-forest communities may be the result of increased scouring or depth and duration of flooding at lower reaches. However, the increased topological complexity of stream channels in lower reaches (Table 3) would suggest that there should be greater transverse differentiation in lower reaches than in upper reaches. Franklin & Bowman (Reference FRANKLIN and BOWMAN2004) find evidence of topographic differentiation along high-profile streams that support bamboo, but our own results indicate that transverse differentiation of other species is not pronounced.
Alternatively, longitudinal variation in riparian forest may be due to vicariance in species distributions or to edaphic changes across regions that were undetected by this study. Some evidence for vicariance is given by the close affinity between the geographic location of non-Melaleuca riparian forest species within this study and rain-forest species of similar geographic provenance (Russell-Smith Reference RUSSELL-SMITH1991), regardless of their affinity for moist or dry soils.
The transverse profile of woodland sites co-varied with region, with higher woodland slopes found on sites in the Gimbat Valley and the Plateau than on the lowlands. Fire frequency was strongly correlated with Gimbat Valley sites and less so with Plateau sites, and varied orthogonally to stream order. There was a higher abundance of upland savanna species within both Gimbat Valley and Plateau sites than in lowland sites. This indicates weak transverse linkages between stream processes and adjacent woodland communities in the Gimbat Valley and Plateau, and suggests that differences in vegetation composition between these two regions are due more to fire frequency than hydrology. The close affinity between the vegetation of lowland woodland sites and floodplain sites, both of which predominantly have low slopes and lie along high-order streams, suggests that transverse linkages between stream processes (i.e. flooding) and woodland communities are much stronger in the lowlands. Interestingly, those lowland woodland communities adjacent to wider riparian forests also had a higher abundance of Melaleuca viridiflora which is strongly associated with floodplain communities (Appendix 2).
The development from headwaters to coastal plain of stronger transverse linkages between vegetation and stream processes fits patterns described for large floodplain systems in the Amazon basin (Junk Reference JUNK1999, Mertes et al. Reference MERTES, DANIEL, MELACK, NELSON, MARTINELLI and FORSBERG1995, Salo et al. Reference SALO, KALLIOLA, HAKKINEN, MAKINEN, NIEMELA, PUHAKKA and COLEY1986) and the south-eastern USA (Hupp Reference HUPP2000). These studies all demonstrate a tight linkage between stream processes and vegetation and conclude that riparian vegetation composition is a function of length of inundation and geomorphological structure. However, in these regions riparian closed-forest is extensive and rainfall more consistent throughout the year than in our study region. Studies of xeric savanna systems in Africa (Hughes Reference HUGHES1988, Pettit & Naiman Reference PETTIT and NAIMAN2007, Van Coller et al. Reference VAN COLLER, ROGERS and HERITAGE1997), mesic savanna systems in South America (Kellman et al. Reference KELLMAN, TACKABERRY and RIGG1998) and arid systems in the south-western USA (Busch Reference BUSCH1995) are also consistent with this study and others (Dwire & Kauffman Reference DWIRE and KAUFFMAN2003, Pettit & Naiman Reference PETTIT and NAIMAN2007) in finding that upland processes, particularly fire, can be as significant as hydrology and geomorphology in structuring streamside vegetation.
Although the potential exists for a comprehensive linkage of upland, riparian and fluvial processes into one coherent theory of riverine structure and function (Poole Reference POOLE2002), there have been few attempts to directly link riparian vegetation models with models developed for fluvial processes such as nutrient transfer, productivity and aquatic patterns of biodiversity. However, the similarities between the interaction of longitudinal and transverse processes within riparian communities described here and similar interactions in fluvial systems are telling. For example, the river continuum concept (Vannote et al. Reference VANNOTE, MINSHALL, CUMMINS, SEDELL and CUSHING1980) postulated that river processes vary continuously along a gradient from headwaters to floodplain. This was later refined to a ‘patchy’ gradient or ‘discontinua’ (Townsend Reference TOWNSEND1989). Later observations of large tropical rivers and unmodified temperate rivers prompted the development of the flood-pulse concept (Junk Reference JUNK1999) to explain temporal and transverse variation in rivers subjected to repeated flooding. Recent models (Poole Reference POOLE2002, Thorp et al. Reference THORP, THOMS and DELONG2006) combine both flood-pulse and discontinua models where the strength of the connections between hydrological and geomorphological processes at different scales determines which ecological processes apply in particular zones. Thus, along the unconstrained lowland reaches of a large river where there are strong transverse linkages between systems, the flood-pulse concept may adequately describe observed ecological patterns, however upstream where channels are geomorphologically constrained and longitudinal processes predominate, the river continuum concept may apply (Poole Reference POOLE2002).
We have demonstrated a pattern of variation in vegetation across scales and directions in a large mesic savanna river system. At the largest scale, the opposing processes of fire and groundwater delineate a sharp transverse boundary between woodland and forest. At a smaller scale, variation in hydrology and geomorphological constraint create a gradient in transverse linkages between stream processes and riparian vegetation. Transverse linkages are relatively weak in the Plateau and the Gimbat valley, and variation in riparian forest may be described as a patchy longitudinal gradient between plateau and valley flora. In the lowlands, transverse links are stronger due to low relief and an annual pulse of floodwater that increases with stream order. It would be of interest to test whether in-stream patterns of diversity, nutrient availability and productivity vary similarly to the variation in vegetation across regions.
ACKNOWLEDGEMENTS
This paper is extracted from Aaron Petty's PhD dissertation, which can be downloaded from http://savanna.cdu.edu.au/education/aaron_petty.html. The research reported here would have been impossible without the extensive support of Kakadu National Park, particularly the Weeds Management Team and Jim Jim and Mary River district staff who facilitated access to sites, provided housing and supplied transport during many breakdowns of the research vehicle. We would like to acknowledge the traditional owners and other Aboriginal residents of Kakadu who graciously welcomed this research on their country, assisted with plant identification, and were the backbone of the field research itself. In particular, Violet Lawson was a patient mentor who introduced Aaron Petty to the daunting diversity of Top End vegetation, and Rocky Cahill hugged thousands of trees while helping a confused neophyte find his way through the bush. Rod Kennett, Kakadu Projects Officer at the time of research, facilitated the permits process and assisted with research design. David Bowman provided valuable research advice. This project was funded by a University of California Pacific Rim Research Foundation Grant, National Science Foundation Dissertation Improvement Grant #211377, and the Tropical Savannas Cooperative Research Centre. This manuscript benefited from careful comments from Donald Franklin, Neil Pettit, Peter Bayliss and several anonymous reviewers.
List of all woody species >5 cm dbh recorded. The number of records and mean basal area (m2 ha−1) are also provided. Nomenclature follows Kerrigan & Albrecht (Reference KERRIGAN and ALBRECHT2007).

The contribution of each taxon to similarity within each vegetation community. Some species were grouped (see methods for details). Average basal area (m2 ha−1), average within-group similarity, the ratio of mean similarity to standard deviation, the contribution of each taxa to total within-group similarity, and the cumulative per cent contribution are shown for each taxa. Deciduousness and the ability to resprout after fire are derived from the Tropical Savannas Fire Response Database (http://www.landmanager.org.au/view/index.aspx?id=327234). Nomenclature follows Kerrigan & Albrecht (Reference KERRIGAN and ALBRECHT2007).