I. INTRODUCTION
The new Al–Li alloys possess the merits of low density, high elastic modules, superior damage tolerance, excellent fatigue, and corrosion resistance.Reference Dursun and Soutis1,Reference Starke, Prasad, Gokhale and Wanhill2 Thus, they are widely used in aircraft structures such as fuselage and wings.Reference Wanhill, Prasad, Gokhale and Wanhill3 Some studies have been conducted on the novel Al–Cu–Li X2A66 alloy, one of the new-type Al–Li alloys, to produce the integral panel of aircraft using the technology of nonmachining integral extrusion. However, the process of precise extrusion is very complicated and is notably affected by the process parameters such as temperature, strain rate, and strain.Reference Dong, Zhang, Zhao, Guan, Gao and Sun4,Reference Chen, Zhao, Yu and Zhang5 Thus, it is very important to completely investigate the elevated temperature flow behavior of X2A66.
To reduce production cost and shorten development cycle, finite element method (FEM) has been extensively used to analyze the hot forming behavior and optimize the deformation parameters. The constitutive model is usually used to describe the rheological behaviors of metals and alloys and treated as an input to the FEM code for simulating the process of hot working under diverse deformation conditions.Reference Paturi, Narala and Pundir6,Reference Rezaei Ashtiani, Parsa and Bisadi7 Accordingly, an accurate constitutive model is crucial for the reliable numerical simulation. At present, lots of different constitutive models, such as phenomenological, physically based, and artificial neural network (ANN) models,Reference Lin, Li, Xia and Li8–Reference Shu, Lu, Wang and Li11 have been developed. Under the given conditions, each type of constitutive models has their respective strength and weakness. Phenomenological models are widely applied to describe the hot deformation behaviors of metals and alloys because of its form in mathematical equations and the material constants which are convenient for calculation.Reference Lin and Chen12 Among them the Arrhenius equationReference Zener and Hollomon13–Reference McQueen and Ryan16 is most broadly used to express the correlation between strain rate, flow stress, and temperature particularly at elevated temperatures. However, the precision of the Arrhenius equation needs to be further improved. On the one hand, the negative effects of the interfacial friction between two ends of the sample and anvils and the heat of deformation on the flow stress are often ignored.Reference Lin, Xia, Chen and Chen17,Reference Li, Zhou and Duszczyk18 On the other hand, the influence of strain is frequently not incorporated into the Arrhenius equation.Reference Slooff, Zhou, Duszczyk and Katgerman19 Some literatureReference Ebrahimi and Najafizadeh20,Reference Roebuck, Lord, Brooks, Loveday, Sellars and Evans21 have systematically described the measurement of flow stress of metallic materials in hot compression experiments and the method for friction and temperature corrections of flow stress. The strain-dependent constitutive equations have been put forward to describe the high temperature rheological behavior in AA6N01 aluminum,Reference Dong, Zhang, Zhao, Guan, Gao and Sun4 AZ41M magnesium,Reference Cai, Chen and Guo22 34CrNiMo steel,Reference Xia, Zhang, Zhang, Shen and Xu23 and TC4-DT titanium.Reference Peng, Guo, Shi, Qin and Zhao24 In addition, lots of researchers have investigated such microstructural evolution as strain hardening, dynamic recovery (DRV), dynamic recrystallization (DRX), and grain growth of many different materials during hot deformation. Chen et al.Reference Chen, Liu, Liu, Zhou and Li25 studied the hot deformation behavior and the effects of temperature and strain rate on the extent of DVX and the size of DRX grains of a low-carbon (reduced activation ferritic/martensitic) steel. Jiang et al.Reference Jiang, Yang, Dong, Zhang and Yao26 researched the DRX and grain growth behaviors of an austenitic nickel-base alloy 690 and used the FEM to validate the established models. At present, there are few research studies about hot forming behavior of the Al–Cu–Li X2A66 alloy; hence, further investigations of the constitutive relationship of X2A66 are necessary, especially including the effects of interfacial friction, deformation heating, and strain.
The primary purpose of this work is to investigate the microstructure characteristics and derive an accurate strain-compensated constitutive model for high temperature flow behavior of the alloy X2A66. Toward this objective, hot compression tests were implemented in a broad range of temperatures and strain rates to get the measured true stress–true strain data and the deformed specimens for microstructure observation. The material constants of the Arrhenius equation were determined basing on the corrected stresses and considering the compensation of strain. Finally, the predictive ability of the developed constitutive equation was evaluated in the whole testing range.
II. MATERIALS AND EXPERIMENTAL PROCEDURES
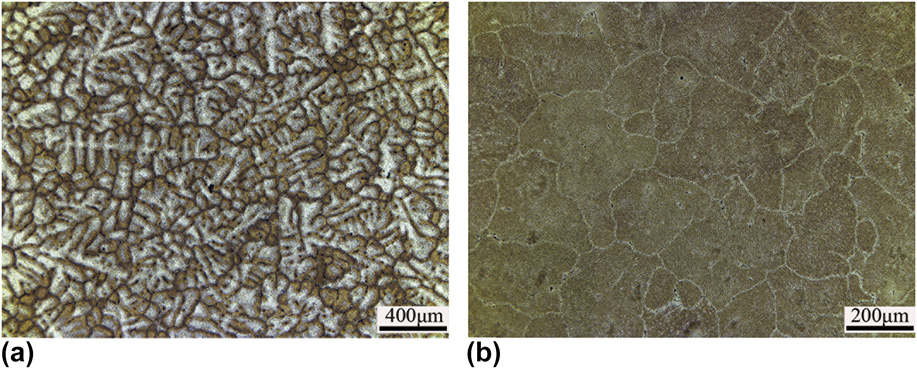
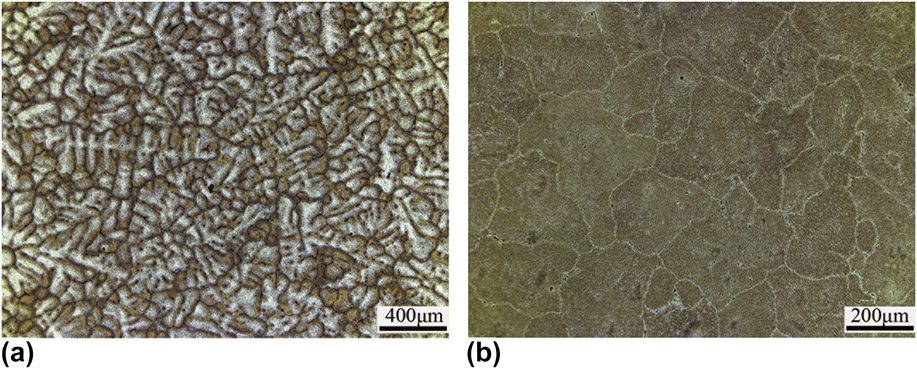
The actual chemical composition of the testing Al–Cu–Li X2A66 alloy, as listed in Table I, was determined by inductively coupled plasma atomic emission spectroscopy (ICP-AES). The semi-continuous casting ingot of X2A66 was treated by two-stage homogenization treatment (683 K/10 h + 773 K/36 h) before the compression experiments. The optical micrographs of the experimental alloy are shown in Fig. 1. By comparative analysis, we found that after the homogenization treatment, the dendritic segregation was basically eliminated, and the non-equilibrium eutectic phases which distributed along the grain boundaries mostly dissolved into the matrix. Cylindrical samples with 10 mm in diameter and 15 mm in height were machined from the homogenized ingot and then the two ends and the side of the specimen were grinded by grinders to obtain a fine surface finish.
Chemical composition of the X2A66 alloy in the present work (wt%).

The original microstructure of the X2A66 alloy: (a) as-cast and (b) homogenization treatment.
The hot compression experiments were carried out on a (Dynamic Systems Inc., Poestenkill, New York). The thermocouple was welded on the surface of the sample at the mid-height to give the feedback of the actual temperature and ensure that the tests were conducted under the preset temperature. Graphite flake and high temperature grease were used to minimize the adverse effect of interfacial friction between both ends of the sample and anvils. The isothermal compression experiments with the reduction in height of 50% (true strain of about 0.7) were conducted at different temperatures (573–773 K, with an interval of 40 K) and strain rates (0.01, 0.1, 1, 10 s−1). Before each compression, the sample was heated up to deformation temperature at a rate of 10 K/s and held for 180 s to obtain uniform temperature distribution. After compression, the samples were quickly water-quenched to room temperature to avoid the unwanted microstructure evolution including precipitation, recrystallization, or grain growth.
The deformed specimens were sectioned along the compression axis, and the central zone of the sectional plane was chosen for microstructure analysis. Optical microstructures (OMs) of these specimens were observed on the (Leica Microsystems Inc., Wetzlar, Germany) after etching in Keller’s reagent composed of 2 mL HF, 3 mL HCl, 5 mL HNO3, and 90 mL H2O. Transmission electron microscope (TEM) microstructure observations of the samples prepared by twin-jet electrothinning in a solution of 70% methanol and 30% HNO3 at 20 V and at 243 K were performed on the (FEI Company, Almelo, the Netherlands).
III. RESULTS AND DISCUSSION
A. Analysis of flow behavior base on corrected flow curves
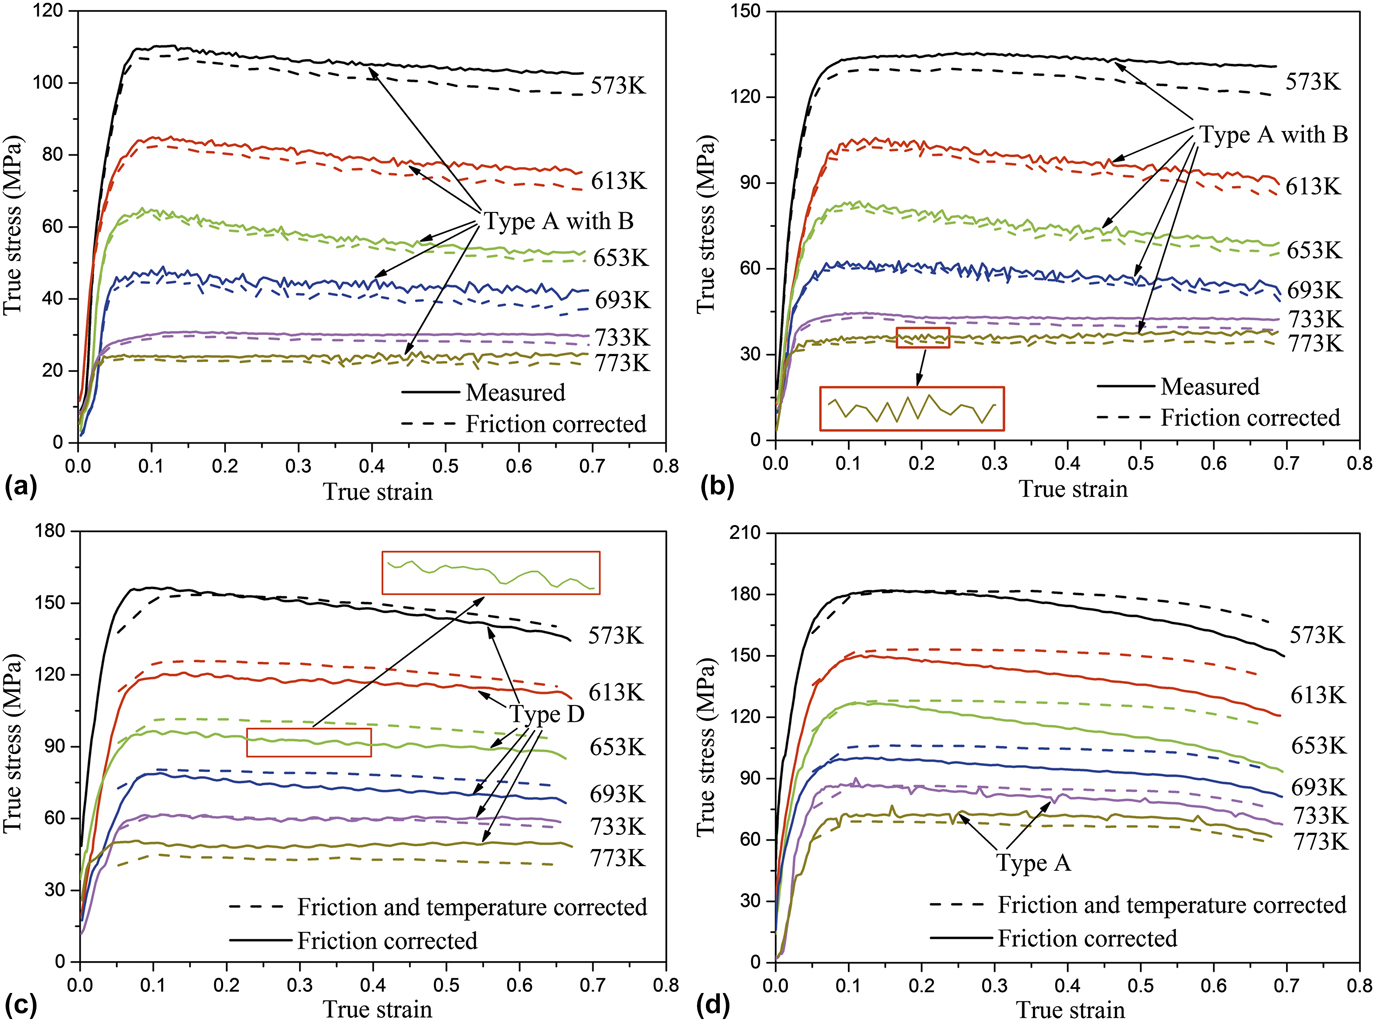
In this study, graphite sheet and high temperature grease were used to minimize the interfacial friction between both ends of specimen and anvils, but the friction cannot be completely eliminated. As the strain increases, the effect of friction becomes more significant and makes the deformation more inhomogeneous, leading to the barrel-shaped samples. This will also affect the accuracy of the measured flow stress. Besides, the strain rates of 1 and 10 s−1 are so fast that the heat of deformation has not enough time to dissipate into the environment, and the heating system cannot regulate the temperature in time. As a result, the deviations between measured and preset temperatures are more than 5 K. Thus, the measured flow stress needs to be corrected first to reduce the negative effects of friction and deformation heat according to the method in the relevant literature.Reference Ebrahimi and Najafizadeh20,Reference Roebuck, Lord, Brooks, Loveday, Sellars and Evans21,Reference Qian, Fang, Zeng and Wang27 Comparisons between the measured and friction-corrected flow stresses are shown in Figs. 2(a) and 2(b). The results indicate that the flow stresses after friction correction are less than the measured ones, and the difference between them is greater with the increase of true strain because the contact area between both ends of specimen and dies increases with the increasing strain. From Figs. 2(c) and 2(d), it can be clearly found that the friction-temperature corrected flow stresses are basically greater than the friction-corrected ones, and the gap increases with the increase of strain or strain rate. This is because the temperature rise of deformation increases with the increase of strain or strain rate. Besides, when the strain is greater than 0.1, the true stress–true strain curves after temperature correction [Figs. 2(c) and 2(d)] appear, the more obvious characteristic of dynamic balance which is consistent with the feature of DRV.
Comparisons of the true stress–true strain curves before and after different corrections: (a) 0.01 s−1, (b) 0.1 s−1, (c) 1 s−1, and (d) 10 s−1.
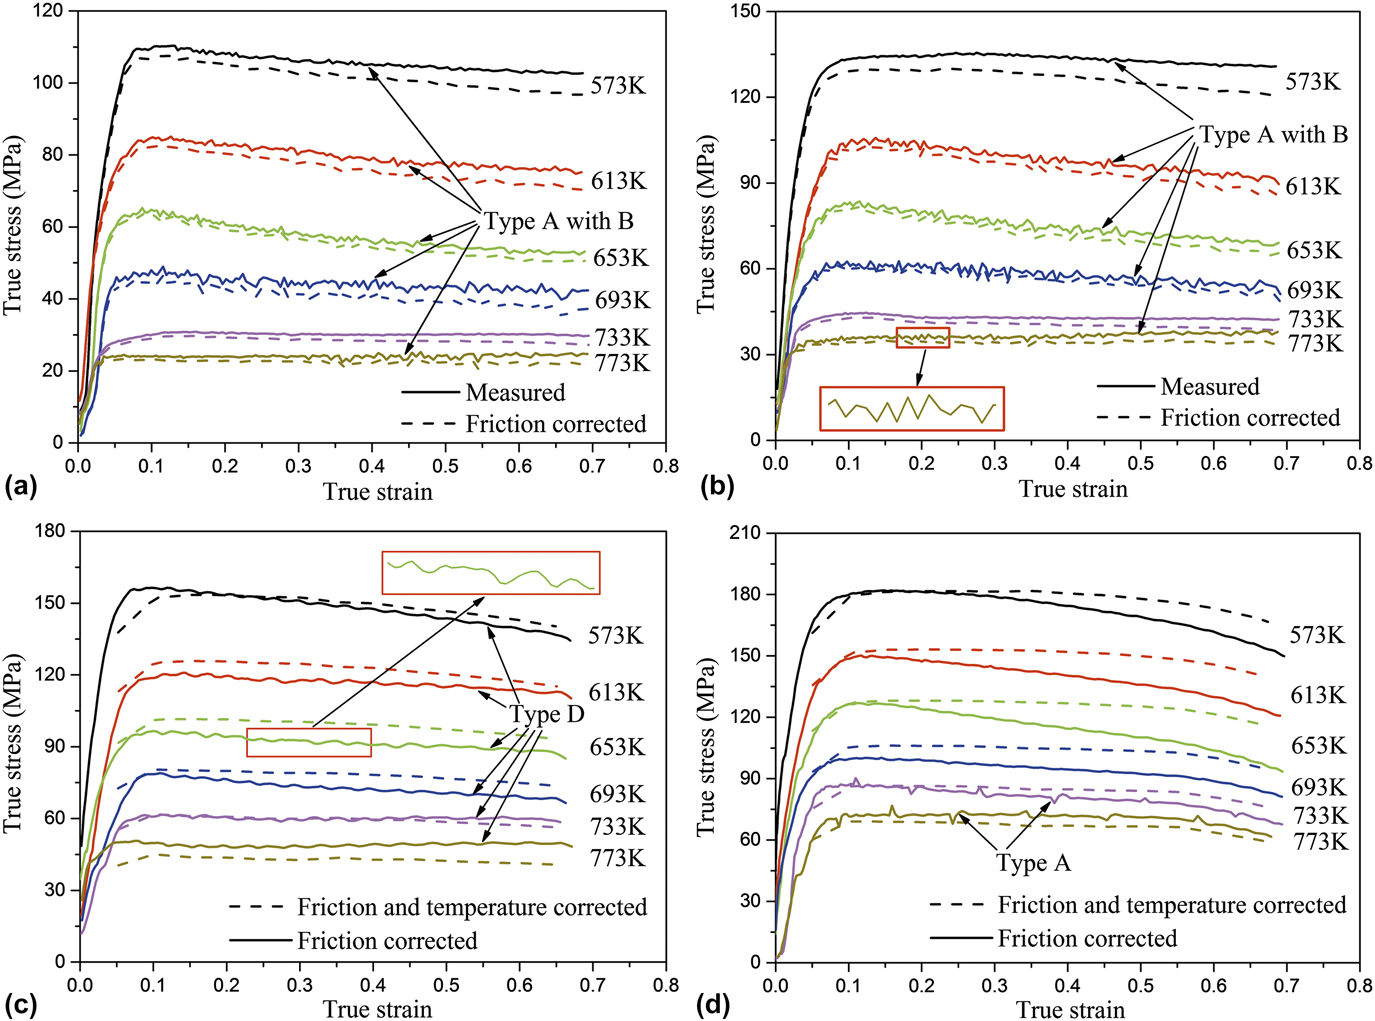
As an overall regularity of the results shown in Fig. 2, the flow stress reduces with the increase of temperature or the decrease of strain rate. When the temperature rises, first, atoms of alloys are more likely to diffuse under the effect of thermal activation and some precipitates will dissolve into the matrix, therefore it is convenient for dislocation movement. Second, the increase of temperature promotes the dynamic softening which includes DRV or DRX. Both of these points lead to the decrease of deformation resistance. As the strain rate decreases, there is enough time for dynamic softening and accordingly dislocation has enough time for the motion of slipping and climbing. Thus, the dislocation density decreases which leads to the reduction in flow stress.Reference Zhou and Clode28 As observed in Fig. 2, on the whole, the flow stress initially quickly increases with the increase of strain, owing to the work hardening induced by the rapid growth of dislocation density. Then the flow stress increases slowly and gradually reaches the maximum value which is caused by the occurrence of dynamic softening. In the end, the flow stress maintains an approximate steady-state value due to the dynamic equilibrium between work hardening and dynamic softening.Reference Lin, He, Chen, Chen, Zhao, Ma and Long29,Reference Ning, Wang, Fu, Li, Wang and Zhao30 Therefore, the deformation temperature, strain rate, and strain have an important influence on the flow stress.
It is worth noting that serrated plastic flow of alloy X2A66 during hot deformation was observed at the strain rates of 0.01 and 0.1 s−1 with all tested temperatures except 733 K, strain rate of 1 s−1 with all tested temperatures, and strain rate of 10 s−1 with temperatures high than 693 K, as marked by arrows in Fig. 2. Serrated plastic flow is widely considered as one of the indications of dynamic strain aging (DSA) which is caused by the interactions between diffusing solute atoms and mobile dislocations during plastic flow.Reference Rodriguez31 Although five different kinds of serrations (termed Types A, B, C, D, and E) have been observed in different materials,Reference Rodriguez31 three kinds, i.e., types A, B, and D, were found in alloy X2A66 in this study. Serrations of type A are periodic and marked by a sudden rise above the general level of the flow curve followed by a drop or in reverse order, as shown in Fig. 2(d). Type B serrations vibrate about the mean true stress–true strain curve in rapid sequence, as indicated in Fig. 2(b). From Fig. 2(c), type D serrations fluctuate continuously about the general flow curve with smaller amplitude and lower frequency. According to the above content, different types of serrations can be interpreted as the alternating process between pinning and unpinning of dislocations. In addition, the serrated plastic flow caused by DSA is considered as an instable flow, which may result in inhomogeneous deformation and reduce the surface quality and may have a significant effect on the mechanical properties of materials.Reference Pu, Zheng, Song, Feng and Dong32 Therefore, to obtain stable plastic flow, it is best to avoid deforming in DSA regimes if possible.
B. Microstructure characteristics
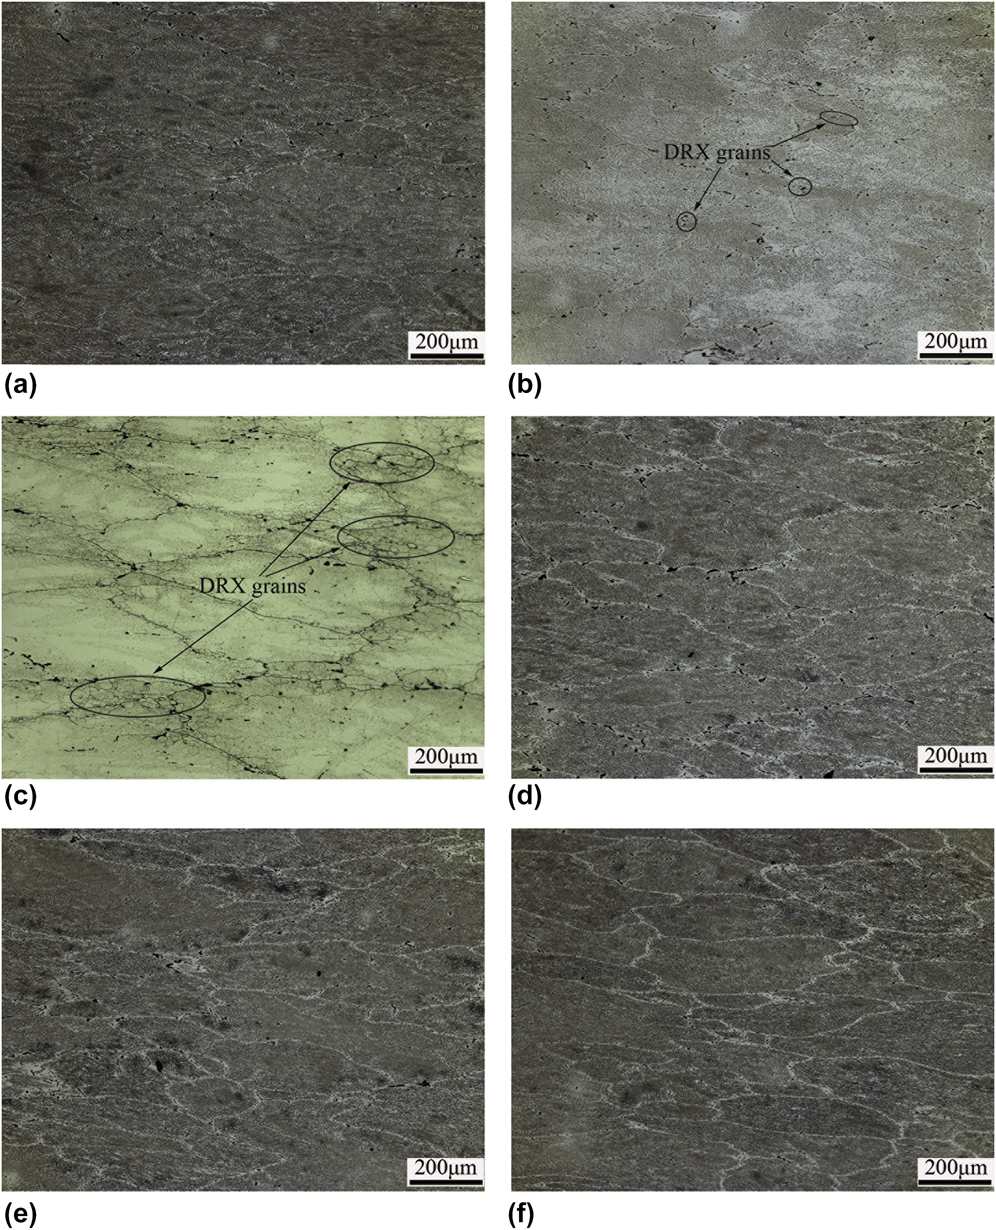
The optical metallographs of the specimens under different deformation conditions are shown in Fig. 3. At the given strain rate of 0.01 s−1 [Figs. 3(a)–3(c)], when the deformation temperature is 573 K [Fig. 3(a)], the microstructure is composed of elongated grains and any DRX grains are not found because of lower temperature. As the temperature increases to 733 K, very few DRX grains generated at the grain boundaries as marked with black circles are shown Fig. 3(b). When the temperature reaches 773 K [Fig. 3(c)], more fine DRX grains formed along the original grain boundaries and elongated grains remain, which indicates incomplete DRX. This is because the increase of temperature strengthens the effect of thermal activation, which makes the atoms more active and reduces the resistance of crystal defects on dislocation motion, and thus promotes the nucleation and growth of DRX grains at grain boundaries where the energy is high.Reference Li, Guo, Guo, Peng and Wu33 From Figs. 3(d)–3(f), at a constant temperature of 693 K and strain rates of 0.01–10 s−1, the grains at three different strain rates are elongated along the direction perpendicular to the compression axis. When the strain rate is 0.01 s−1 [Fig. 3(d)], there is enough time for DRV at lower strain rate, therefore the ratio of long to short axis of deformed grain is relatively small. With the increase of strain rate, the deformation time becomes shorter and there is not enough time for DRV, which results in the increase of the ratio of long to short axis.
Optical micrographs of alloy X2A66 deformed under different conditions: (a)  $\dot{\varepsilon }$ = 0.01 s−1, T = 573 K, (b)
 $\dot{\varepsilon }$ = 0.01 s−1, T = 733 K, (c)
 $\dot{\varepsilon }$ = 0.01 s−1, T = 773 K, (d) T = 693 K,
 $\dot{\varepsilon }$ = 0.01 s−1, (e) T = 693 K,
 $\dot{\varepsilon }$ = 0.1 s−1, and (f) T = 693 K,
 $\dot{\varepsilon }$ = 10 s−1.
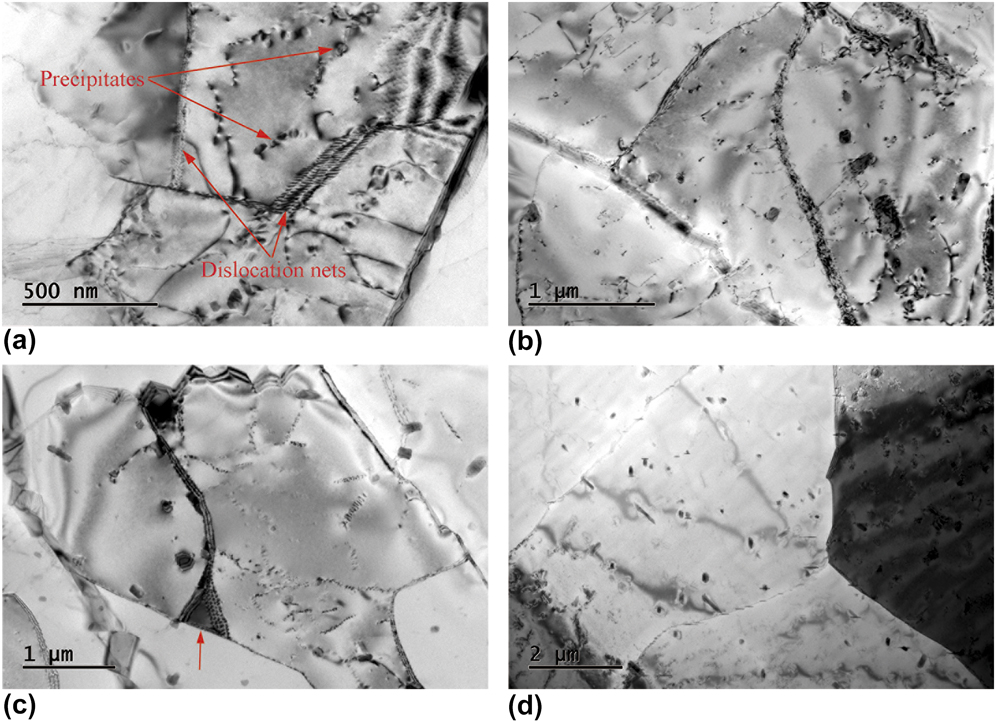
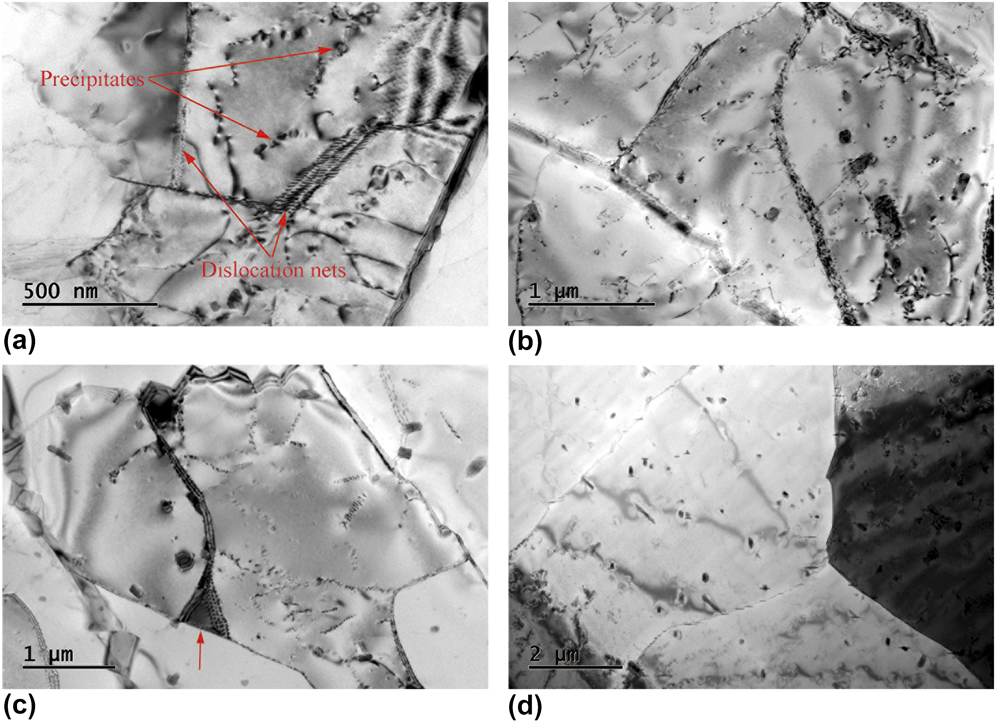
The TEM images of alloy X2A66 deformed at a strain rate of 0.01 s−1 and temperatures of 573–773 K are shown in Fig. 4. At the lower temperature of 573 K [Fig. 4(a)], the dislocation density is relatively high and the parallel dislocation nets with a certain width form. Besides, the pinning effect of precipitates on dislocations can be obviously found, as labeled by red arrows. When the deformation temperature increases to 653 K [Fig. 4(b)], the mobility of atoms and dislocations increases, leading to the decrease of dislocation density and the formation of sub-boundaries. This manifests the occurrence of DRV. When the temperature reaches 693 K, a small triangle sub-grain is found as indicated by the red arrow in Fig. 4(c). At the deformation temperature of 773 K [Fig. 4(d)], the grain boundaries become clear and straight, and the low angle grain boundaries transform into high angle grain boundaries through the migration of sub-boundaries. These microstructural analyses, including OM and TEM, indicate that the main dynamic softening mechanisms are DRV and partial DRX.
TEM images of the experimental alloy deformed at a strain rate of 0.01 s−1 and temperatures of (a) 573 K, (b) 653 K, (c) 693 K, and (d) 773 K.
C. Strain-compensated constitutive model
Constitutive equations are often used to describe the deformation behaviors of metals and alloys in the process of hot working.Reference Lin and Chen12 The Arrhenius-type equation is widely used to represent the relationship between strain rate  $\left( {\dot{\varepsilon }} \right)$, flow stress (σ), and deformation temperature (T), especially at elevated temperatures.Reference Sellars and McTegart14 In addition, the Zener–Hollomon parameter (Z) in an exponent-type equation is used to express the influences of strain rate and deformation temperature on rheological behavior.Reference Zener and Hollomon13 These equations can be expressed in the following formReference Zhou, Lin, Deng and Jiang34:
 $$Z = \dot{\varepsilon }\exp \left( {{Q \over {RT}}} \right) = {A_1}{\sigma ^{{n_1}}}\left( {\alpha \sigma \lt 0.8} \right)\quad ,$$
 $$Z = \dot{\varepsilon }\exp \left( {{Q \over {RT}}} \right) = {A_2}\exp \left( {\beta \sigma } \right)\left( {\alpha \sigma > 1.2} \right)\quad ,$$
 $$Z = \dot{\varepsilon }\exp \left( {{Q \over {RT}}} \right) = A{\left[ {\sinh \left( {\alpha \sigma } \right)} \right]^n}\left( {{\rm{for}}\;{\rm{all}}\;\sigma } \right)\quad ,$$
where Z is the Zener–Hollomon parameter,  $\dot{\varepsilon }$ is the strain rate (s−1), Q is the activation energy (J/mol), R is the universal gas constant [8.314 J/(mol K)], T is the absolute temperature (K), and A 1, A 2, A, β, n 1, n, and α (α = β/n 1) are material constants.
The corrected flow stresses under different deformation conditions can be used to determine the material constants in the constitutive model. However, the influence of strain on the flow stress, which can be represented by the material constants, is not taken into account in Eqs. (1) and (2). Therefore, the material constants at different deformation parameters were studied, and the solution process at the strain of 0.1 is given as an example.
For the high-stress level (ασ > 1.2) and low-stress level (ασ < 0.8), taking the natural logarithm of both sides of Eqs. (1) and (2) and then rearranging them can obtain, respectively,
 $$\ln \sigma = {1 \over {{n_1}}}\ln \dot{\varepsilon } + {1 \over {{n_1}}}\left( {{Q \over {RT}} - \ln {A_1}} \right)\quad ,$$
 $$\sigma = {1 \over \beta }\ln \dot{\varepsilon } + {1 \over \beta }\left( {{Q \over {RT}} - \ln {A_2}} \right)\quad .$$
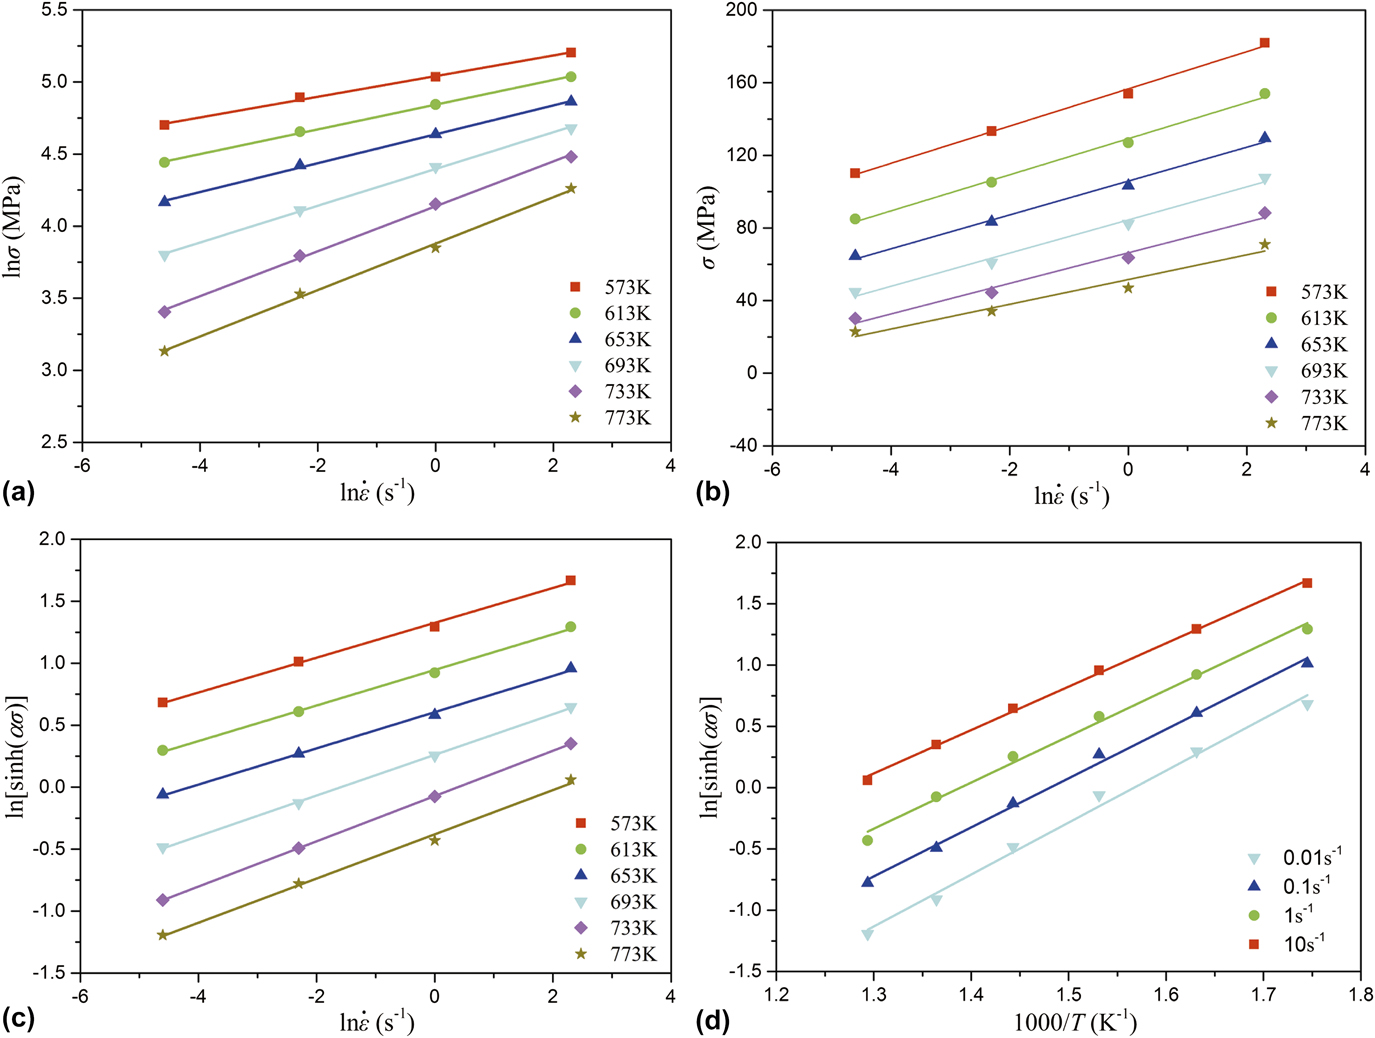
The values of strain rates and corresponding friction-temperature corrected stresses at the true strain of 0.1 at various deformation temperatures are substituted into Eqs. (4) and (5), and the relationships of ln σ–ln  $\dot{\varepsilon }$ and σ–ln
 $\dot{\varepsilon }$ under different deformation temperatures are obtained by linear fitting, as shown in Figs. 5(a) and 5(b). It can be seen that these straight lines in Figs. 5(a) or 5(b) are approximately parallel to each other, and the small difference in slopes of lines which may be attributed to the dispersion of data pointsReference Peng, Guo, Shi, Qin and Zhao24 can be neglected in this study. Accordingly, the approximate values of n 1 and β can be determined by computing the reciprocals of the average values of slopes of the lines in Figs. 5(a) and 5(b), respectively. After the calculation, the values of n 1 and β are 8.5466 and 0.1113 MPa−1, respectively. Furthermore, the value of α can be calculated by the formula mentioned previously: α = β/n 1 = 0.0130 MPa−1.
Relationships of (a) ln σ–ln  $\dot{\varepsilon }$, (b) σ–ln
 $\dot{\varepsilon }$, (c) ln[sinh(ασ)]–ln
 $\dot{\varepsilon }$, and (d) ln[sinh(ασ)]–1000/T.
For all stress levels, taking the natural logarithm of both sides of Eq. (3) and then rearranging it can obtain
 $$\ln \left[ {\sinh \left( {\alpha \sigma } \right)} \right] = {{\ln \dot{\varepsilon }} \over n} + {Q \over {nRT}} - {{\ln A} \over n}\quad .$$
For a fixed deformation temperature, differentiating Eq. (6) gives
 $${1 \over n} = {\left\{ {{{\partial \ln \left[ {\sinh \left( {\alpha \sigma } \right)} \right]} \over {\partial \ln \dot{\varepsilon }}}} \right\}_T}\quad .$$
For a constant strain rate, differentiating Eq. (6) yields
 $${Q \over {nR}} = {\left\{ {{{\partial \ln \left[ {\sinh \left( {\alpha \sigma } \right)} \right]} \over {\partial \left( {{1 / T}} \right)}}} \right\}_{\dot{\varepsilon }}}\quad .$$
Making the slope of ln[sinh(ασ)]–1/T as N, thus the value of Q can be represented as
 $$Q = R \cdot n \cdot N\quad .$$
At the same time, the relationships of ln[sinh(ασ)]–ln  $\dot{\varepsilon }$ and ln[sinh(ασ)]–1000/T can be acquired by substituting the values of material constant α, strain rates, deformation temperatures, and corresponding corrected flow stresses at the strain of 0.1 into Eq. (6) and using the method of linear fitting, as shown in Figs. 5(c) and 5(d). It is obvious that the slopes of straight lines in Figs. 5(c) and 5(d) are almost the same separately. Hence the value of n can be approximately determined by the reciprocal of the mean value of slopes of the lines in Fig. 5(c). In the same way, the value of N can be calculated from the average value of slopes of the lines in Fig. 5(d). Therefore, the value of activation energy (Q) can be computed as 203.0 kJ/mol, which is approximately equal to the reported value of the activation energy of homogenized Al–Cu–Li 2099 alloy at the strain of 0.1 in the temperature range of 573–773 KReference Zhang, Shen, Yan, Sun, Sun, Yang and Liu35 and greater than the self-diffusion activation energy of pure aluminum.Reference Zhang, Jin and Chen36
Taking the natural logarithm of both sides of Eq. (3) yields
 $$\ln Z = \ln A + n\ln \left[ {\sinh \left( {\alpha \sigma } \right)} \right]\quad .$$
The values of n and ln A are the slope and intercept of the relationship of ln Z–ln[sinh(ασ)] separately. By substituting the values of strain rates, activation energy, deformation temperature, and corresponding corrected flow stresses into Eq. (10), the relationship of ln Z–ln[sinh(ασ)] can be obtained. Thus, the values of n and ln A can be obtained as 6.2374 and 33.8586, respectively.
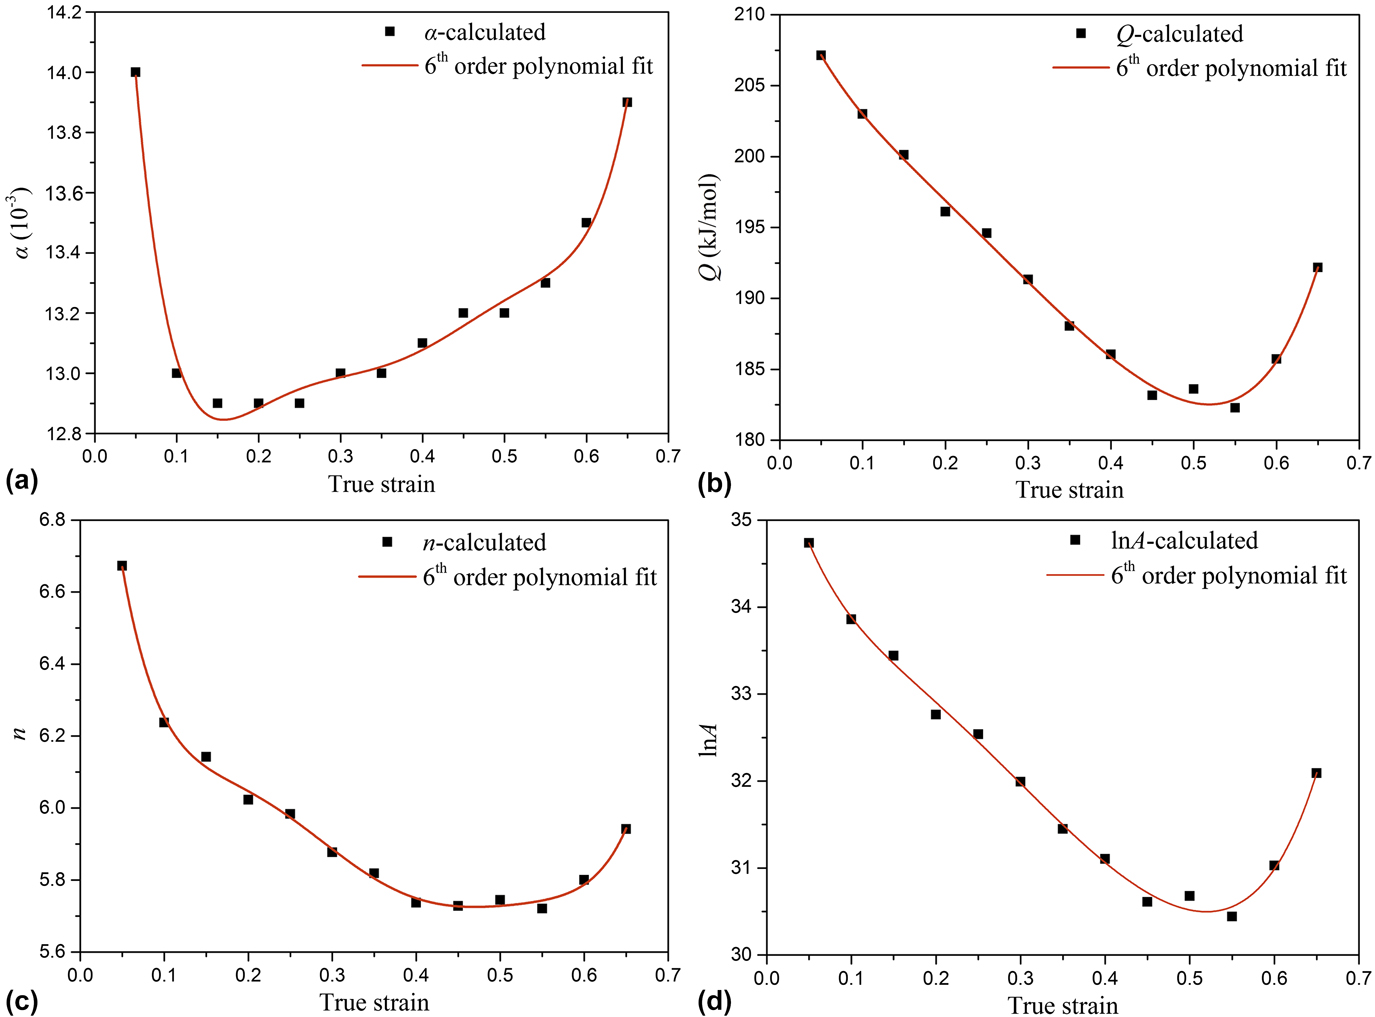
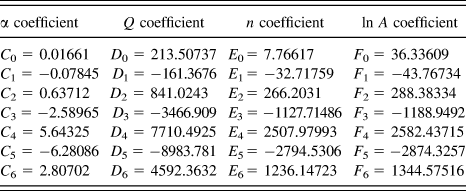
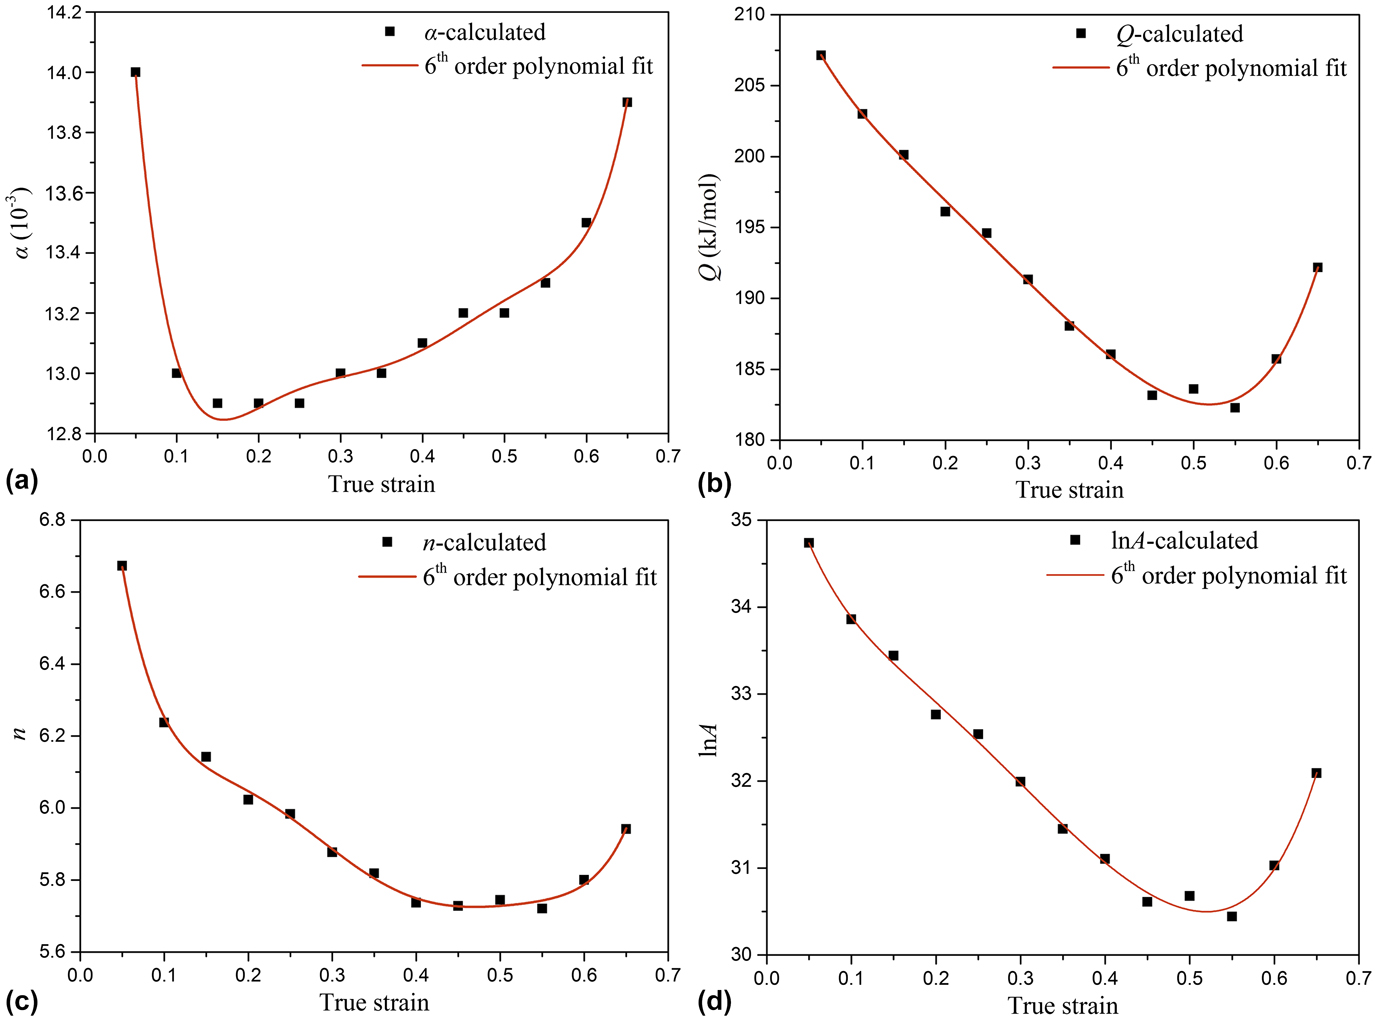
It is widely assumed that strain has less effect on the flow behavior of metals and alloys, and thus the influence of strain is not taken into account in Eq. (3).Reference Cai, Chen and Guo22 However, as observed in Fig. 2, the flow stress varies with the increase of strain, especially at low strain stage. Therefore, it is essential to consider the effect of strain on the flow behavior of the X2A66 alloy to get a more accurate constitutive relationship. To incorporate strain into Eq. (3), material constants (α, Q, n, and ln A) are usually represented as polynomial functions of strain.Reference Cai, Chen and Guo22 The values of material constants were computed at different strains ranging from 0.05 to 0.65 at an interval of 0.05. Then, these values were used for polynomial fitting and the order of polynomial was varied from 2 to 9. Eventually a sixth-order polynomial function, as shown in Eq. (11), was chosen to describe the effect of strain on material constants with a good correlation and generalization, as illustrated in Fig. 6. Lower or higher order polynomials exhibited less or over fitting, respectively, hence losing the competence of true generalization and representation. The values of coefficients of polynomials are listed in Table II. Besides, it can be easily seen from Fig. 6 that material constants change with the variation of strain, which further confirms that strain has nonignorable influence on flow stress,
 $$\left\{ {\matrix{ {\alpha = {C_0} + {C_1}\varepsilon + {C_2}{\varepsilon ^2} + {C_3}{\varepsilon ^3} + {C_4}{\varepsilon ^4} + {C_5}{\varepsilon ^5} + {C_6}{\varepsilon ^6}} \hfill \cr {Q = {D_0} + {D_1}\varepsilon + {D_2}{\varepsilon ^2} + {D_3}{\varepsilon ^3} + {D_4}{\varepsilon ^4} + {D_5}{\varepsilon ^5} + {D_6}{\varepsilon ^6}} \hfill \cr {n = {E_0} + {E_1}\varepsilon + {E_2}{\varepsilon ^2} + {E_3}{\varepsilon ^3} + {E_4}{\varepsilon ^4} + {E_5}{\varepsilon ^5} + {E_6}{\varepsilon ^6}} \hfill \cr {\ln A = {F_0} + {F_1}\varepsilon + {F_2}{\varepsilon ^2} + {F_3}{\varepsilon ^3} + {F_4}{\varepsilon ^4} + {F_5}{\varepsilon ^5} + {F_6}{\varepsilon ^6}} \hfill \cr} } \right.\quad .$$
Relationships between material constants and true strain: (a) α, (b) Q, (c) n, and (d) ln A.
Coefficients of the polynomials about strain for α, Q, n, and ln A for the X2A66 alloy.

After determining the coefficients of polynomials of material constants, the flow stresses under the entire test conditions in this study can be predicted. Based on the definition of hyperbolic sine function, the constitutive relationship that reorganizes Eq. (3) can be written as follows:
 $$\sigma = {1 \over {c\left( \varepsilon \right)}}\ln \left\{ {{{\left( {{{\dot{\varepsilon }\exp \left[ {{{d\left( \varepsilon \right)} / {\left( {RT} \right)}}} \right]} \over {f\left( \varepsilon \right)}}} \right)}^{{1 \over {e\left( \varepsilon \right)}}}} + {{\left[ {{{\left( {{{\dot{\varepsilon }\exp \left[ {{{d\left( \varepsilon \right)} / {\left( {RT} \right)}}} \right]} \over {f\left( \varepsilon \right)}}} \right)}^{{2 \over {e\left( \varepsilon \right)}}}} + 1} \right]}^{{1 \over 2}}}} \right\}\quad ,$$
where c(ε), d(ε), e(ε), and f(ε) are the polynomial equations of strain, which are used to express the material constants (α, Q, n, and ln A) separately.
D. Verification of the developed constitutive model
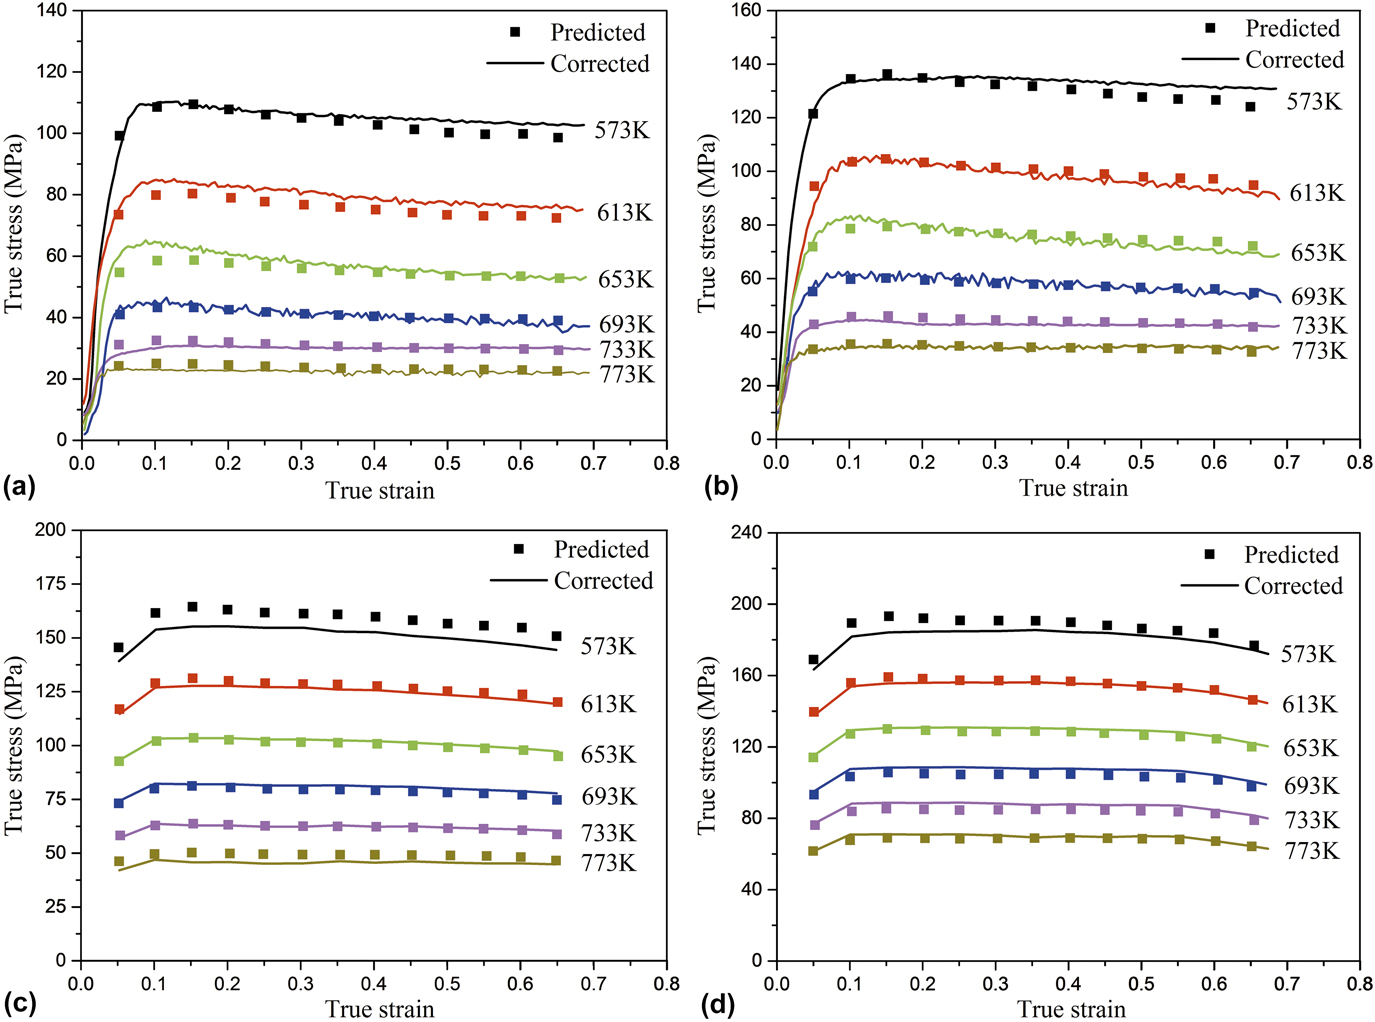
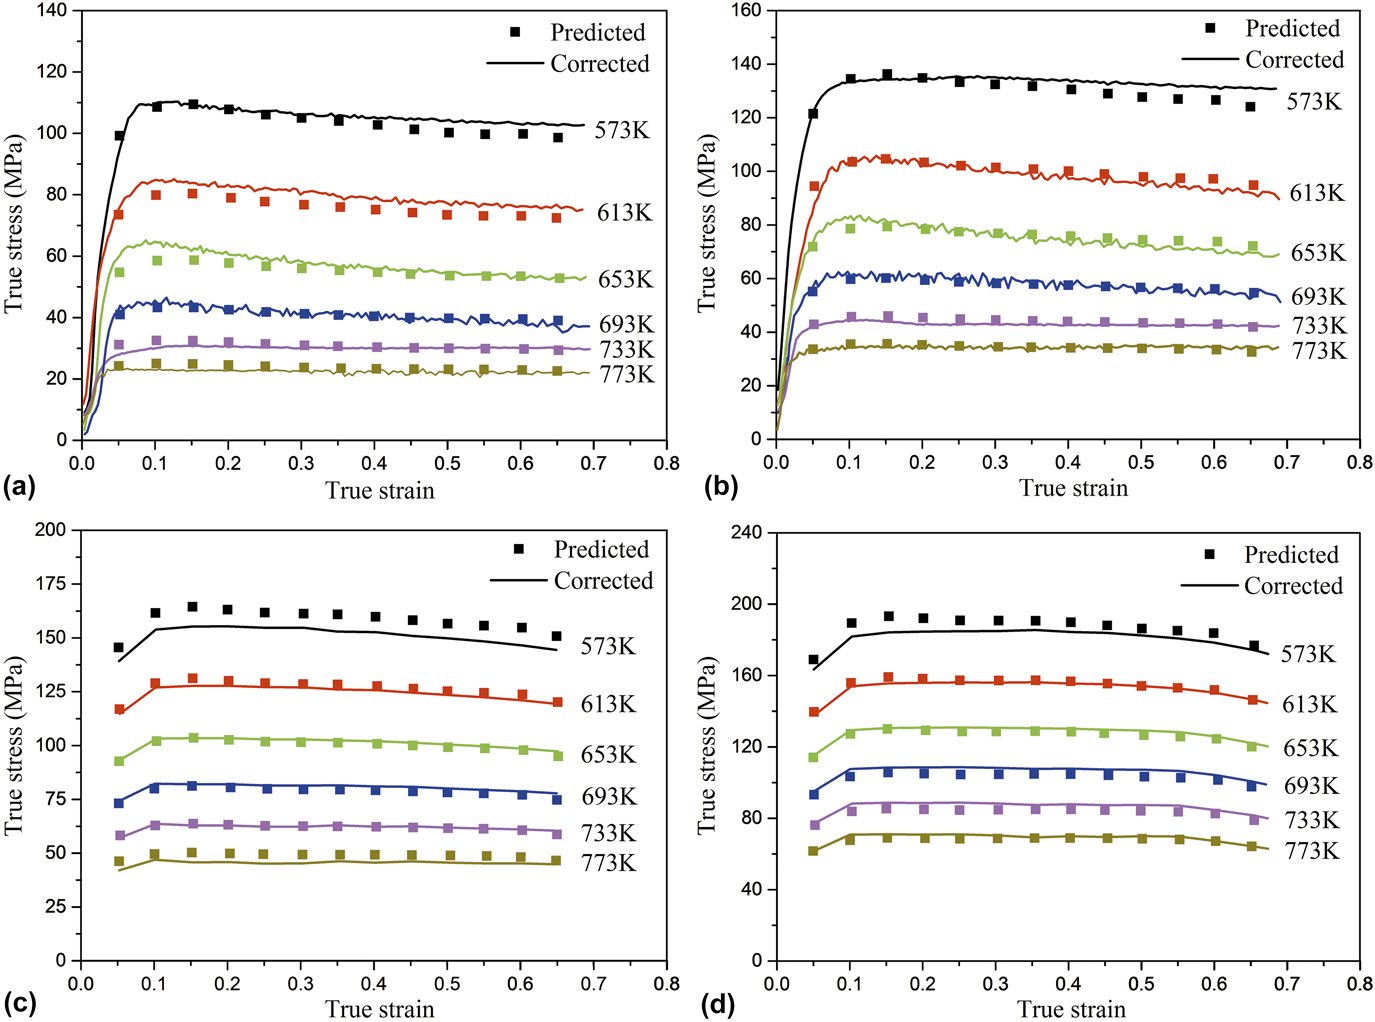
The reliability of the constitutive model is directly related to the accuracy of the predicted results; therefore, it is necessary to verify the reliability of the strain-compensated constitutive model. For this purpose, the flow stress predicted by Eq. (12) was compared with the friction-temperature corrected ones, as shown in Fig. 7. It can be observed that the predicted flow stress agrees well with the corrected flow stress, particularly at higher temperatures. Only at a strain rate of 1 s−1 and a deformation temperature of 573 K, a deviation between the two is obvious, as shown in Fig. 7(c). It should be noted that the flow stress under that deformation condition (at higher strain rate and lower deformation temperature) is at higher stress level. Similar errors were also reported in other literature.Reference Cai, Chen and Guo22,Reference Peng, Guo, Shi, Qin and Zhao24,Reference Cai, Li, Liu, Chen and He37 According to Eq. (12), this deviation between the corrected and predicted flow stress may be caused by the material constants for polynomial fitting. For instance, as discussed in Sec. III.C, Eqs. (1) and (2) are suitable for lower and higher stress, respectively. Thus, some errors may be introduced owing to the calculations of the values of n 1 using Eq. (1) for higher stress and β using Eq. (2) for lower stress. From the formula mentioned above (α = β/n 1), the values of α will also be affected. The material constant α, as presented in Eq. (3), is a stress multiplier. Even if α changes a little, it will also have a great impact on the calculations, especially at high stress values. Finally, the accuracy of the constitutive equation may be affected. But further studies need to be done to draw a definitive conclusion.
Comparisons between predicted and corrected flow stresses of the X2A66 alloy at strain rates of (a) 0.01 s−1, (b) 0.1 s−1, (c) 1 s−1, and (d) 10 s−1.
The predictive capability of the developed constitutive model is further quantified by using standard statistical parameters such as correlation coefficient (R) and average absolute relative error (AARE),Reference Srinivasulu and Jain38 which can be expressed as follows:
 $$R = {{\sum\limits_{i = 1}^N {\left( {\sigma _{\rm{c}}^i - {{\bar{\sigma }}_{\rm{c}}}} \right)\left( {\sigma _{\rm{p}}^i - {{\bar{\sigma }}_{\rm{p}}}} \right)} } \over {\sqrt {\sum\limits_{i - 1}^N {{{\left( {\sigma _{\rm{c}}^i - {{\bar{\sigma }}_{\rm{c}}}} \right)}^2}} } \sqrt {\sum\limits_{i = 1}^N {{{\left( {\sigma _{\rm{p}}^i - {{\bar{\sigma }}_{\rm{p}}}} \right)}^2}} } }}\quad ,$$
 $${\rm{AARE}}\left( \% \right) = {1 \over N}\sum\limits_{i = 1}^N {\left| {{{\sigma _{\rm{c}}^i - \sigma _{\rm{p}}^i} \over {\sigma _{\rm{c}}^i}}} \right|} \times 100\quad ,$$
where σc is the friction-temperature corrected flow stress and σp is the predicted flow stress obtained from the strain-dependent constitutive model and  ${\bar{\sigma }_{\rm{c}}}$ and
 ${\bar{\sigma }_{\rm{p}}}$ are the average values of σc and σp, respectively. N is the total number of data points used in this work.
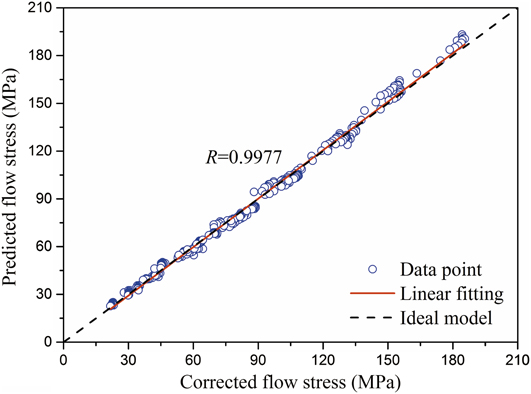
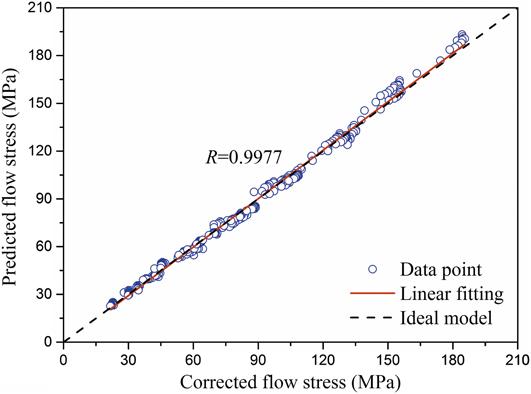
R is a normally used statistical parameter that represents the strength of linear correlation between the predicted and corrected values of flow stress. But in some cases, a higher value of R possibly not necessarily implies a better performance of a strain-dependent constitutive model on account of the trend of the model biased to higher or lower values. The AARE is calculated by a term-by-term contrast of the relative error in prediction with regard to the actual value of the variable. Hence, the AARE is an unbiased statistic parameter for evaluating the predictive capability of the developed constitutive model.Reference Srinivasulu and Jain38 The smaller the value of AARE, the predictive ability of the model will be stronger, and vice versa. The linear relationship between corrected and predicted flow stress values is shown in Fig. 8. The values of R and AARE are calculated as 0.9977 and 2.888%, respectively. Higher R and lower AARE indicate that the constitutive model considering the effect of strain can accurately predict the flow stress for the Al–Cu–Li X2A66 alloy and can be used for numerical simulation and analysis on related problems of the hot deformation of this alloy.
Comparisons between corrected and predicted flow stresses.
IV. CONCLUSIONS
The microstructure characteristic and hot deformation behavior of the Al–Cu–Li X2A66 alloy have been investigated by means of uniaxial isothermal compression tests under a wide range of strain rates (0.01, 0.1, 1, and 10 s−1) and deformation temperatures (573–773 K, with an interval of 40 K). The main conclusions are as follows:
(1) The measured flow stress was corrected due to friction and deformation heat. The friction corrected flow stress is smaller than the measured ones, and the deviation between them increases with the increase of strain. The friction-temperature corrected flow stress is basically greater than the friction corrected ones. The flow stress is sensitive to deformation temperature and strain rate, and it increases with the decrease of deformation temperature or the increase of strain rate. The effect of strain on flow stress cannot be neglected, especially at low strain stage.
(2) When the deformation temperature is greater than 733 K, DRX occurs. The ratio of long to short axis of deformed grain increases with the increase of strain rate. The main dynamic softening behavior of the alloy X2A66 is DRV and partial DRX.
(3) The material constants (α, Q, n, and ln A) considering the effect of strain were calculated as functions of strain by sixth-order polynomial fitting. Accordingly, the developed constitutive relationship coupling strain rate, temperature, and strain was established based on the Arrhenius equation.
(4) The validation results for predictive capability indicate that the strain-compensated constitutive model can predict the flow stress in the whole experimental strain rate and temperature ranges except at 1 s−1 and 573 K. The values of correlation coefficient (R) and AARE were calculated as 0.9977 and 2.888%, respectively, which further illustrates that the proposed constitutive model has good performance.
ACKNOWLEDGMENT
The authors are very grateful to the National Natural Science Foundation of China (Grant Nos. 51374187, 51271076, and 51474101) for its financial support.