


Introduction
The mechanical properties of fresh-water polycrystalline ice have been investigated by a number of workers (e.g. Reference GlenGlen, 1955; Reference DuvalDuval, 1978; Reference JonesJones, 1982; Reference Duval and AshbyDuval and others; 1983; Reference WeertmanWeertman, 1983; Reference JackaJacka, 1984a, Reference Jackab; Reference JackaJacka and Maccagnan, 1984). Recent decades have seen substantial progress in the understanding of the processes involved in glacier flow (Reference NyeNye, 1957; Reference RigsbyRigsby, 1958; Reference RaymondRaymond, 1973; Reference Russell-Head and BuddRussell-Head and Budd, 1979; Reference Paterson and BuddPaterson and Budd, 1982; Reference PatersonPaterson, 1983; Reference Shoji and LangwayShoji and Langway, 1985). However, a full understanding of the constitutive behavior of clean and sediment-laden ice has proven elusive. Understanding how fine particles affect the mechanical behavior of ice is important for the study of glacier flow since low concentrations of debris are common in glacier ice. Although the importance of dislocations in ice deformation is well recognized, a dislocation-based model has been problematic because of the difficulties in quantifying dislocation density. Recently, a method combining cyclic loading and creep experiments has been developed that provides a way to track the dislocation density as a function of the particle content, stress/strain path and thermal history (Reference ColeCole, 1995; Reference Cole and DurellCole and Durell, 2001). Using this approach, Cole and Reference Cole and DurellDurell (2001) found that the flow rate is dislocation drag-controlled for both sea ice and freshwater ice, so that the strain rate is a linear function of the dislocation density. An n = 3 power-law behavior was observed when the applied creep stress controls the effective dislocation density, and n = 1 was found when the dislocation density is effectively independent of stress.
The anelasticity behavior of both fresh-water ice and sea ice has also been widely studied (e.g. Reference VaudreyVaudrey, 1977; Reference DuvalDuval, 1978; Reference Vassoille, Maï and PerezVassoille and others, 1978; Reference ColeCole, 1990, Reference Cole1995, Reference Cole1998; Reference Cole and DurellCole and Durell, 1995). In general, ice exhibits a high level of anelasticity under a wide range of conditions. Previous work (Reference ColeCole, 1995) indicated that both mobile dislocation processes and grain-boundary sliding contribute significantly to ice anelasticity. But how fine particles affect anelasticity, or mobile dislocation processes and grain-boundary sliding, is still unknown. Some studies (Reference Mosher and RajMosher and Raj, 1974; Reference Mori, Kos and MonzenMori and others, 1983; Reference ShigenakaShigenaka and others, 1983) on metals have shown that precipitates at grain boundaries will block grain-boundary sliding and, thus, inhibit grain-boundary relaxation processes. However, there are no studies of the effects of particles at grain boundaries on the anelasticity of polycrystalline ice. One reason is the difficulty in producing ice with the particles spread uniformly along the grain boundaries.
A large number of measurements have been made on the strength of ice with solid inclusions such as sand, silt and clay. However, understanding of the effect of impurities on the rate-controlling deformation process is still incomplete. Reference Hooke, Dahlin and KauperHooke and others (1972) found a high variability in the strain rate for a range of sand concentrations from 0 to 10 vol.%, Reference Baker and Gerberichwhile Baker and Gerberich (1979) found that at temperatures from –20 to –5˚C solid inclusions, in concentrations from 1.3 to 6.6 vol.%, increased the creep strain rate. Later, Reference Shoji and LangwayShoji and Langway (1985) found an increased flow rate for dirty basal ice from Camp Century, Greenland, compared with clean basal ice. Reference Holdsworth and BullHoldsworth and Bull (1970) also observed an enhanced flow rate in the basal amber-colored ice of Meserve Glacier, Antarctica. However, these studies did not clarify the effect of impurities at different microstructural locations, i.e. whether having particles located at grain boundaries or in the grain interiors has the same effect on the creep rate.
As a first step towards understanding the importance of particle location to the flow processes, this study focuses on the effects of particles located at grain boundaries on both the anelasticity and creep behavior of granular ice.
Experimental
Granular fresh-water ice specimens and debris-laden ice specimens (0.1 wt.%, 0.5 wt.%, 1 wt.%, 4 wt.%) with grain-sizes of 3–5mm containing silt-sized particles (average particle size of 0.05 mm) along the grain boundaries were prepared by the method invented by Reference ColeCole (1979). The specimen dimensions were 127mm in length and 50.4 mm in diameter.
Anelasticity experiments employed the reversed direct-stress testing method presented by Reference ColeCole and Durell (1995), and the procedures described by Reference ColeCole (1993). The command signal was a zero-mean-stress sinusoid. A load cell mounted in line with the specimen monitored the axial load, and two displacement transducers mounted on the specimen were used to monitor the displacements. Digitized records provided 200 points per load cycle regardless of frequency. The raw data are smoothed using procedures described by Reference Cole and DurellCole and Durell (1995), and the internal friction and elastic modulus were calculated from the smoothed points.
Staged creep tests, which consisted of alternating periods of uniaxial cyclic and creep loading, were used to examine the creep behavior. As a first step to determine the effects of particles along the grain boundaries, a rather high stress level of 1.45 MPa was used for creep tests at –12˚C, so that a relationship between creep and particle content could be found quickly. Low-stress-level tests are being performed at the time of writing. A set of load cycles was applied prior to creep deformation to assess the initial state of the specimens. Then a constant creep load was applied, followed by load removal, anelastic recovery and sets of loading cycles. This sequence was repeated several times for a given creep stress until the total viscous strain was in the range 0.06–0.08. Because the dislocation density is directly related to the hysteresis loop area, the cyclic loading response is used to track changes in the dislocation density after each creep loading. The cyclic loading frequency used was 0.1 Hz, which was sufficiently low to produce measurable anelastic strain, but high enough to avoid cyclic viscous strain.
The specimens before and after creep were cut into thin sections for microstructural analysis using optical microscopy with polarized light.
Results and Discussion
Anelasticity
Figure 1 shows the relationship between modulus, internal friction and frequency of cyclic loading for particle-free ice and the debris-laden ice with the particles at the grain boundaries. It is clearly seen that the modulus, which increases with increasing frequency, is similar (variation <10%) for all specimens at the low frequencies of 0.001 and 0.01 Hz, but an increase in modulus can be seen for the debris-laden ice when the loading frequency is ∼0.1Hz. At 1 Hz, the modulus of the debris-laden ice is 30% higher than that of particle-free ice. Consistent with the increases in modulus, the internal friction of debris-laden ice decreases compared with particle-free ice.
Modulus and internal friction as function of cyclic loading frequency for particle-free ice and debris-laden ice (before creep).
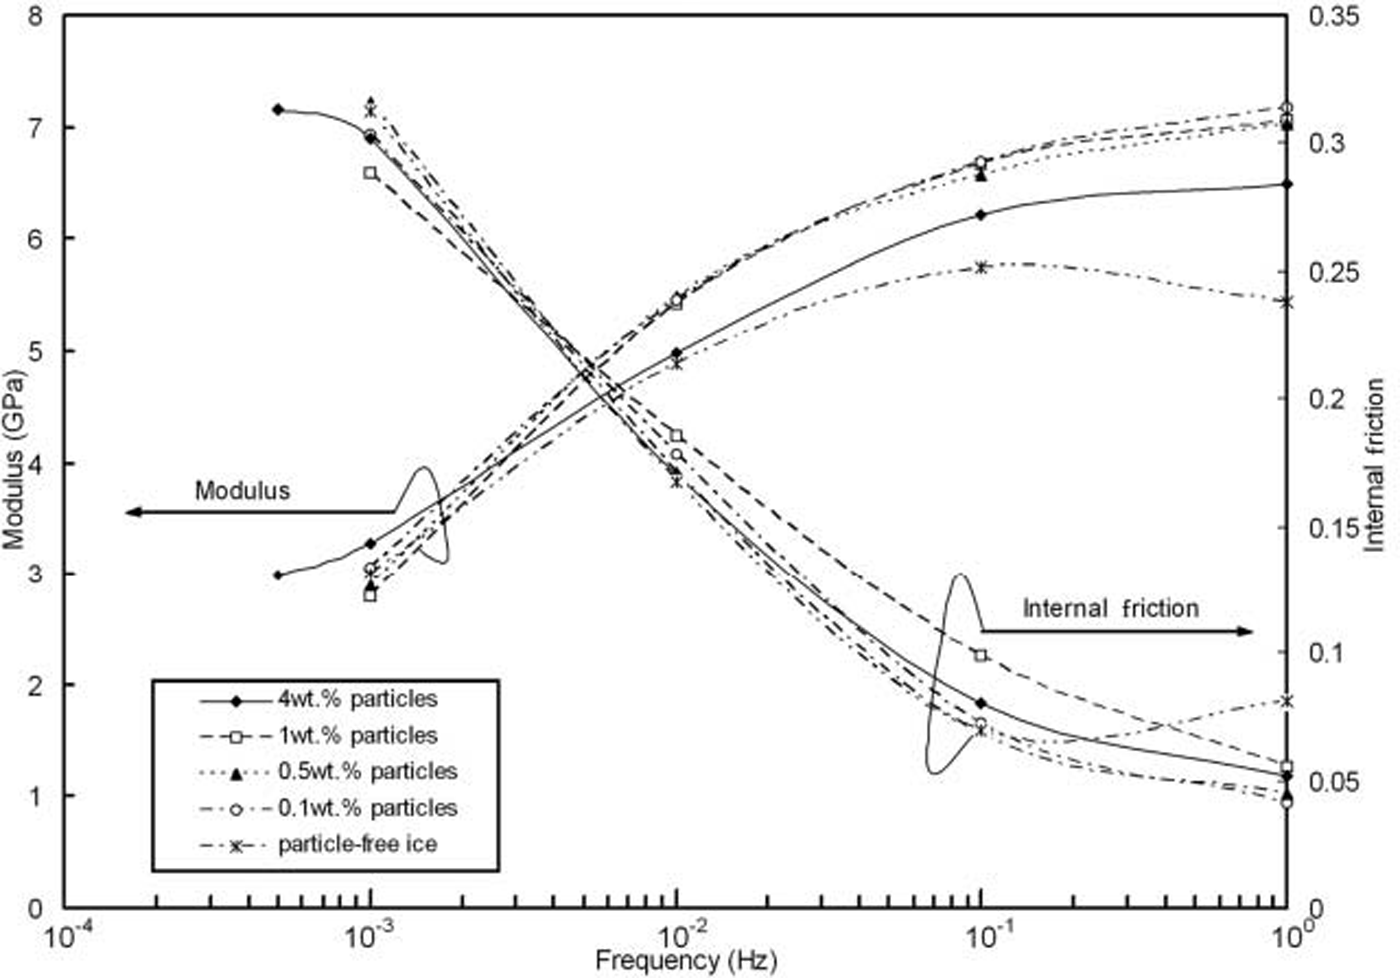
It is known that dislocation relaxation can be an order of magnitude greater than grain-boundary relaxation, and that the grain-boundary relaxation peak occurs at ∼5Hz while the dislocation relaxation peak occurs at about ∼5×10⁻⁴Hz at –12˚C (Reference ColeCole, 1995). Thus, the modulus increase at 1 Hz in the debris-laden ice is due to the particles decreasing the grain-boundary relaxation. Reference ShigenakaShigenaka and others (1983) also observed this phenomenon in metals (Cu-Fe and Cu-SiO2). When the particles are located at grain boundaries, they retard grain-boundary sliding through the development of internal stresses, which decrease the free sliding distance and the relaxation time, thus increasing the modulus and decreasing the internal friction. The physical basis for dislocation relaxation at low frequency is the oscillatory motion of basal plane dislocations under a sinusoidally varying stress. This will not be affected by the particles at the grain boundaries. Hence, the modulus for particle-free ice and debris-laden ice at low frequencies (0.001 and 0.01 Hz) is unaffected by grain-boundary particles.
Creep
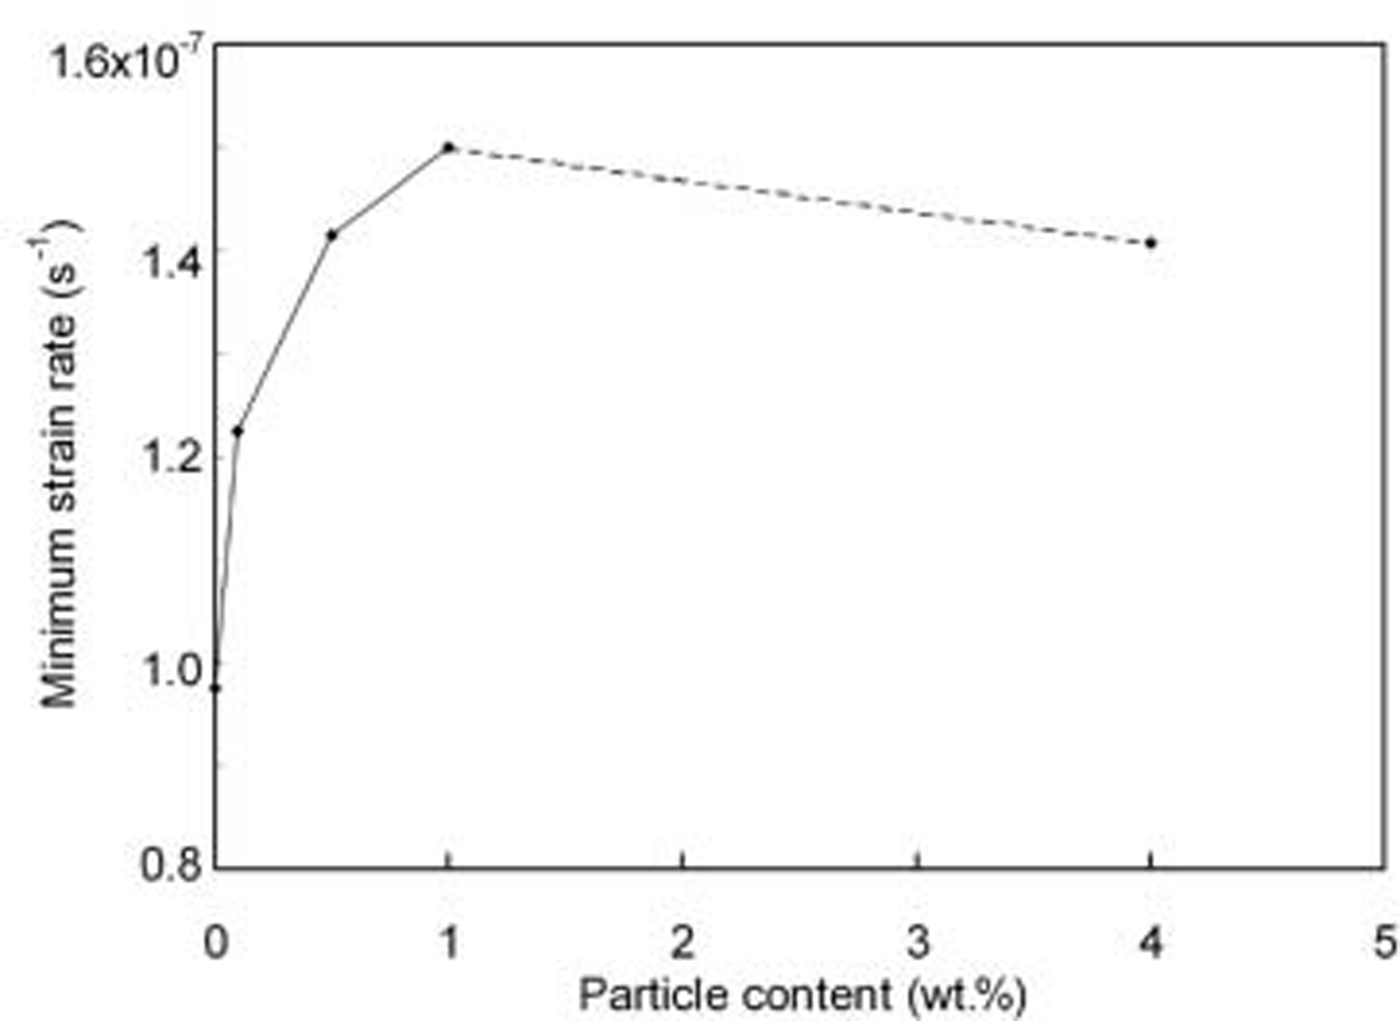
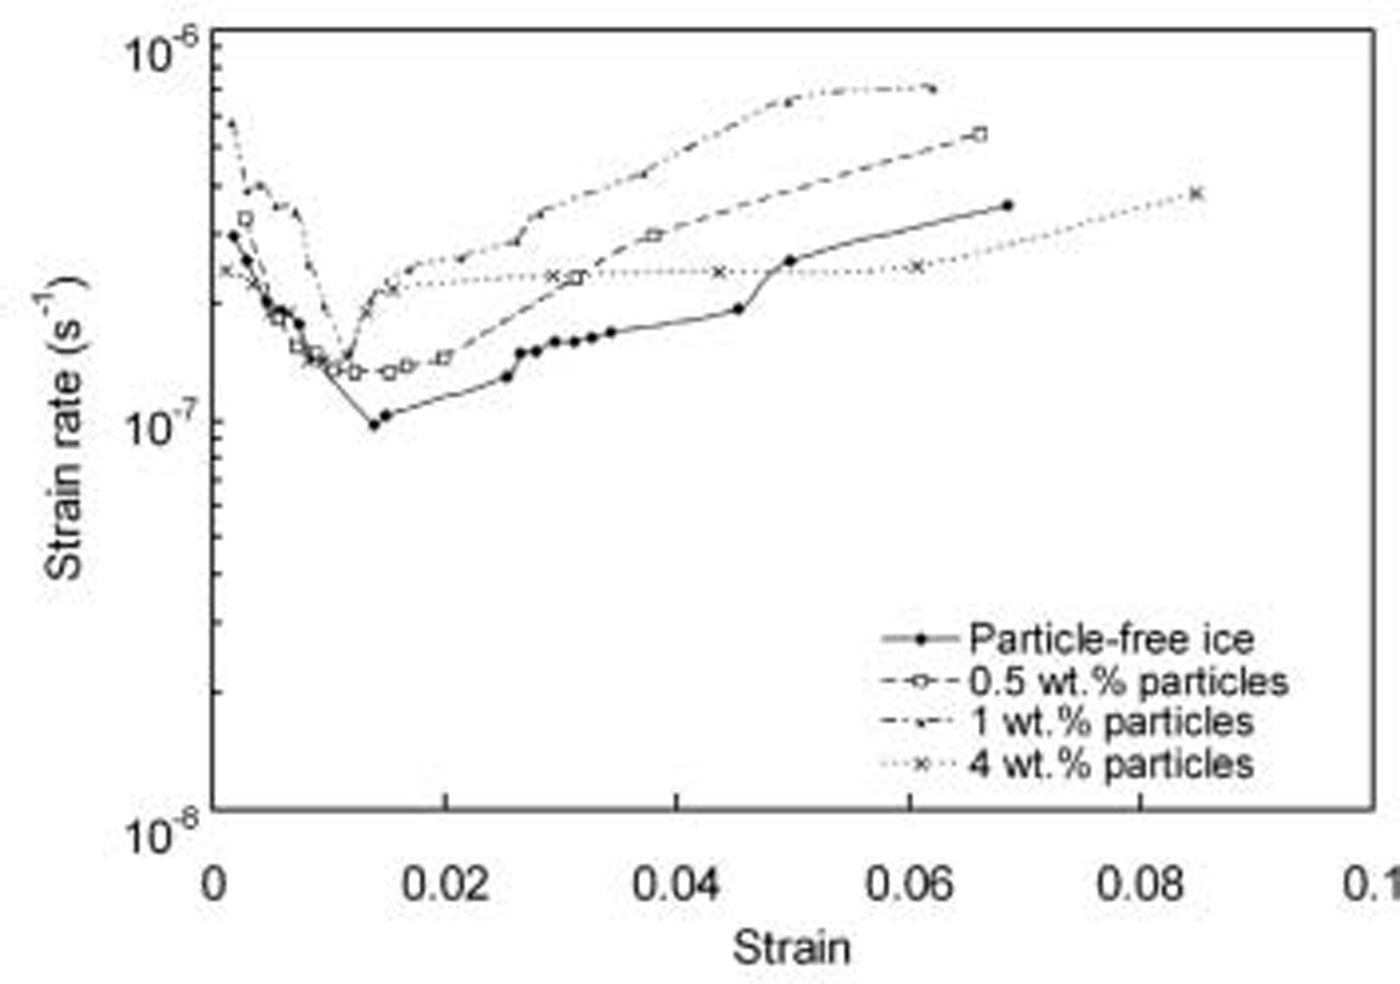
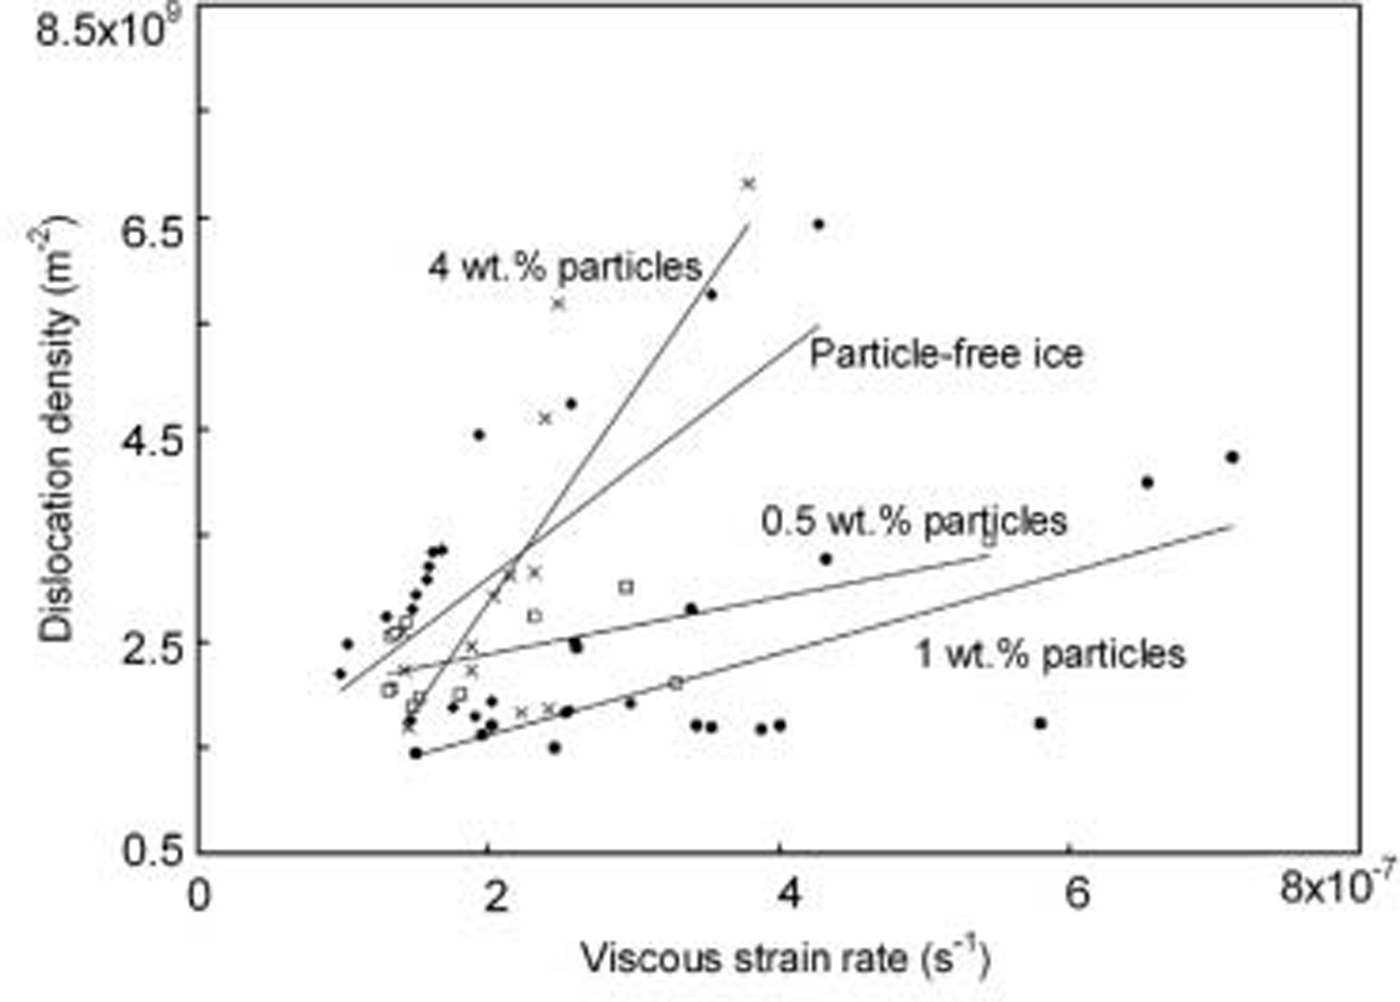
Figure 2 shows the relationship between the minimum creep rate and the particle content. It can be seen that the minimum creep rate increases for low particle contents up to 1 wt.%, after which it decreases. Figure 3 shows the relationship between the creep rate and viscous strain for fresh-water ice and debris-laden ice with 0.5 wt.%, 1 wt.% and 4 wt.% particles. All the curves show a similar trend: the creep rate initially decreases (primary creep regime), reaches a minimum near 1% strain (secondary creep) and subsequently increases as it enters tertiary creep. It is clear that the strain rate for debris-laden ice with 1 wt.% particles at the grain boundaries is higher than the strain rate for both particle-free ice and debris-laden ice with 0.5 wt.% and 4 wt.% particles at the grain boundaries. Reference Hooke, Dahlin and KauperHooke and others (1972) also found an increased creep rate for ice containing a low content of dispersed fine sand. Figure 4 shows the calculated dislocation density for particle-free ice and debris-laden ice during creep, calculated using the model developed by Cole and Reference Cole and DurellDurell (2001).
Minimum strain rate vs debris content for specimens with particles at the grain boundaries.
Creep rate vs viscous strain for particle-free ice and debris-laden ice with particles at the grain boundaries (stress level 1.45 MPa).
Calculated dislocation density vs viscous strain.

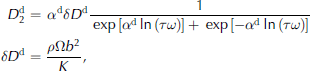
where ω is the angular frequency, τ is the relaxation time,  is the loss compliance, αd is the peak width parameter for the dislocation relaxation, δDd is the strength of the relaxation, K is the restoring stress constant, ρ is the dislocation density, Ω is the orientation factor and b is the Burgers vector. We see that except for some fluctuations during primary creep, the dislocation density increases as the creep rate increases. The calculated mobile dislocation densities of the specimens with 0.5 wt.% and 1 wt.% particles are lower than those of both the particle-free specimen and the specimen with 4 wt.% particles. The reason for this is still unclear. Figure 5 shows the fitted linear relationship between the dislocation density and the creep rate. The fluctuation in dislocation density at low strains could be due to dynamic recovery during primary creep. When the creep rate subsequently increases, the dislocation density also increases. Interestingly, for debris-laden ice with 1 wt.% particles, the dislocation density is lower but the creep rate is higher than for particle-free ice and debris-laden ice with 4 wt.% particles. This indicates that another creep mechanism is possibly aiding creep besides dislocation glide for the 1 wt.% debris-laden ice. One possibility may be that the particles at the grain boundaries act as preferential nucleation sites for recrystallization. This will increase the overall nucleation rate, and many small new grains will be nucleated along the grain boundary, increasing the grain-boundary area. These new recrystallized grains have no particles along their boundaries, and the boundaries are thus free to slide. Reference Baker and GerberichBaker and Gerberich (1979) observed this phenomenon for ice with dispersed solid inclusions.
Relationship between dislocation density and viscous strain. The lines were fitted using linear regression.
Microstructure
Figure 6 shows the microstructures of ice before and after creep deformation for debris-laden ice with 1 wt.% particles. It is clearly seen that dynamic recrystallization occurred during creep, a phenomenon observed in all the specimens. Hence, the average grain-size decreased after creep, compared with the unstrained grain-size. Figure 7 shows how the content of particles at the grain boundary affected recrystallization. Numerous new grains were nucleated at the grain boundaries and grew by consuming the deformed grains. It is seen that the recrystallized grain-size of the debris-laden ice with 1 wt.% particles is smaller than that of the other specimens. Thus, the debris-laden ice with 1 wt.% particles has a larger grain-boundary area, and these new grain boundaries have no particles to inhibit boundary sliding.
Microstructures (a) before and (b) after staged-creep test for ice with 1 wt.% particles (strain 0.07).
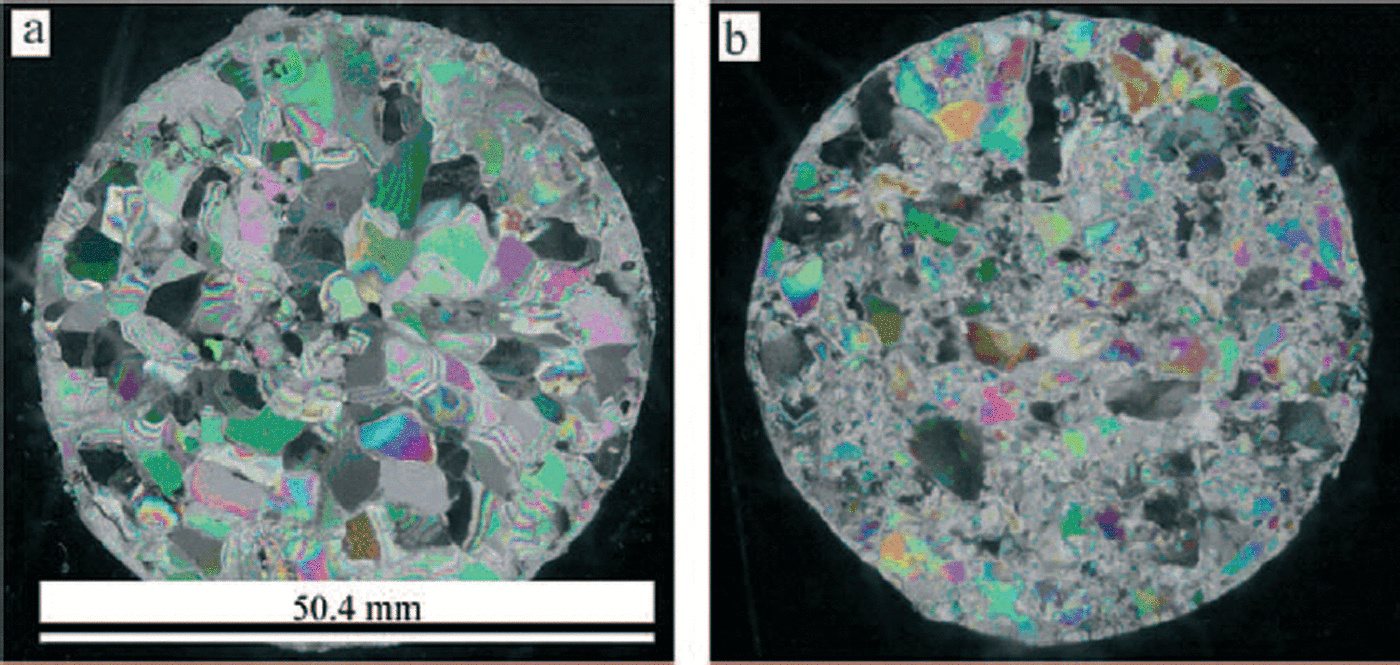
Microstructures after staged-creep test for debris-laden ice with different particle contents. (a) Particle-free ice (strain 0.06); (b) 0.5 wt.% particles ice (strain 0.075); (c) 1 wt.% particles ice (strain 0.07); and (d) 4 wt.% particles ice (strain 0.075).

Summary and Conclusions
A combination of cyclic and constant compression loading was used to study the anelasticity and creep behavior of debris-laden ice and particle-free ice. The results show that the particles increase the modulus at a frequency of 1 Hz but do not affect it at low frequencies. The particles, which are located at the grain boundaries, inhibit grain-boundary sliding during the cyclic loading, which decreases the grain-boundary relaxation time or even stops grain-boundary relaxation completely at 1 Hz.
Staged creep tests show that the dislocation density increases with increasing creep rate for all the specimens. This phenomenon indicates that dislocation glide is the major mechanism of creep for the prevailing conditions. However, the high creep rate observed for the 1 wt.% debris-laden ice without a corresponding increase in dislocation density, compared with particle-free ice, shows that another creep mechanism might also aid creep deformation. Small new recrystallized grains increase the grain-boundary area, which may increase the boundary-sliding contribution to creep.
Acknowledgements
This research was supported by the US National Science Foundation Office of Polar Programs, Arctic Natural Sciences Program (OPP 011737; program manager J. Dionne). We thank G. Durell for his valuable assistance in developing the creep and cyclic loading equipment.



