I. INTRODUCTION
Ceria (CeO2) is commonly exploited for its oxygen-storage capacity (OSC) and oxygen-buffering capacity in solid-oxide fuel cells (SOFCs; da Costa et al., Reference da Costa, da Silva, Noronha and Mattos2012; Kearney et al., Reference Kearney, Hernández-Reta and Baker2012), and automotive three-way catalysis (Kašpar et al., Reference Kašpar, Fornasiero and Graziani1999). For solid-oxide fuel cell applications, CeO2-based anodes have been considered as potential materials owing to their high oxygen mobility, which is necessary for hydrogen oxidation. Similarly, as a three-way catalyst, CeO2 is required to simultaneously reduce NOx and oxidise CO and hydrocarbons; this is achieved through its ability to uptake and release oxygen reversibly. Oxygen pulses are buffered under rich (reducing) or lean (oxidising) conditions as a result of ceria's redox ability (i.e. OSC) such that a corresponding change in Ce4+/Ce3+ valence state occurs.
Catalysts with a high OSC are desirable as this can result in higher catalytic activity and higher stability. In a series of aluminium-doped CeO2–zirconia (ZrO2) supported palladium–alumina catalysts, the high OSC (583 μmol O g−1) of Ce0.5Zr0.3Al0.2O1.9/Pd/γ-Al2O3 was found to correspond with the highest CO oxidation activity and good stability (Dong et al., Reference Dong, Yin, Guo, Wu, Kimura and Sato2013). Similarly, the higher OSC of Tb-doped CeO2–ZrO2 catalysts developed for the steam reforming of propane were also shown to be more durable as carbon formation was minimised because of a greater number of oxygen species able to react and form CO2 at a lower temperature (Harshini et al., Reference Harshini, Kim, Nam, Lim, Hong and Yoon2013).
The ability of CeO2 to act as an effective catalyst is strongly dependent on the synthesis method employed which, in turn, affects factors such as crystallite size and morphology. CeO2 exhibiting enhanced catalytic activity and higher extent of reduction have been associated with nano-sized rather than micron-sized particles (Soykal et al., Reference Soykal, Sohn and Ozkan2012). The higher catalytic ability of nanoparticles is generally attributed to a greater amount of Ce3+ and the associated oxygen vacancies required to balance charge (Hua et al., Reference Hua, Zhang, Fei and Fang2012). An increase in Ce3+ was observed when comparing nanoparticles to micron sized particles; however, for particles below 10 nm the concentration of Ce3+ was found to be independent of particle size or the synthesis precursor (Revoy et al., Reference Revoy, Scott and Grosvenor2013). In addition, Paun et al. (Reference Paun, Safonova, Szlachetko, Abdala, Nachtegaal, Sa, Kleymenov, Cervellino, Krumeich and van Bokhoven2012) determined that for 2–10 nm-sized polyhedrals the concentration of Ce3+ did not change with particle size.
The aforementioned oxygen vacancies can act as potential adsorption sites and have been associated with OSC more so than other properties, such as surface area. Mamontov et al. (Reference Mamontov, Egami, Brezny, Koranne and Tyagi2000) showed CeO2 defect concentrations declined above 760 °C, corresponding to a decrease in OSC from 217 to 62 μmol O2 g−1 at 750 and 800 °C, respectively. At higher temperatures these species are destroyed and consequently result in the reduction of the OSC (Deraz and Alarifi, Reference Deraz and Alarifi2009). Ensuring crystallite growth is minimised may assist in the preservation of vacancies and result in the OSC being maintained.
The morphology of the particles can also alter the extent of defects as nanorods have been found to possess a greater amount of stable Ce3+, defects, and surface active sites, than nanocubes and nano-octahedra (Wu et al., Reference Wu, Li, Howe, Meyer and Overbury2010). The number of these crystal-defect sites is determined by surface terminations where, for the low-index planes, the highest vacancy formation energy follows the trend (111) > (100) > (110) (Nolan et al., Reference Nolan, Parker and Watson2005b). The presence of vacancies was found by Nolan et al. (Reference Nolan, Grigoleit, Sayle, Parker and Watson2005a) not to be linked to the surface stability as the most stable CeO2 surface was (111) followed by (110) and then (100). The more reactive (100) sites disappear when the particle size increases above 10 nm (Wang and Feng, Reference Wang and Feng2003). The dominant exposed planes for nanocubes and nano-octahedra were (100) and (111), respectively (Florea et al., Reference Florea, Feral-Martin, Majimel, Ihiawakrim, Hirlimann and Ersen2013) and the most prominent exposed surface for nanorods are the (100) and (110) planes, which may explain their higher reactivity in CO oxidation (Zhou et al., Reference Zhou, Wang, Sun, Peng and Li2005). Nanorods have also been found to have a higher OSC (554 μmol O g−1) in comparison with nanopolyhedra (318 μmol O g−1) and nanocubes (353 μmol O g−1) (Mai et al., Reference Mai, Sun, Zhang, Si, Feng, Zhang, Liu and Yan2005). Other applications where nanorods have exhibited higher reactivity than nanocubes or nano-octahedra include as a support for vanadia catalysts for the oxidative dehydrogenation of isobutane (Wu et al., Reference Wu, Schwartz, Li, Rondinone and Overbury2012) and as a support for gold in CO oxidation, butadiene hydrogenation, and benzylic alcohol oxidation (Guan et al., Reference Guan, Ligthart, Pirgon-Galin, Pieterse, Santen and Hensen2011).
In this work, we investigated the oxidation of Ce2O(CO3)2·H2O using variable-temperature X-ray diffraction (XRD) under both a flow of nitrogen and air. High catalytic activity and stability are attributed to the presence of a high number of stable Ce3+ vacancies, which are more abundant in nano-sized crystallites and particles with rod morphology. As the generation and preservation of these active sites is largely dependent on the synthesis method employed, understanding the oxidation pathway of the precursor may assist in maximising these species, allowing for catalyst improvement.
II. EXPERIMENTAL
A. Preparation
Cerium oxide was prepared by dissolving Ce(NO3)3·6H2O (Aldrich, 99%) and an excess (15 × the total ion concentration) of urea, CO(NH2)2 (Sigma-Aldrich, 99–100.5%), in deionised water to obtain a 0.1 mol l−1 solution. With vigorous stirring, the solution was heated to 90 °C for 8 h. The resultant precipitate was filtered, and washed with water and ethanol (absolute, Merck) before drying in an oven at 90 °C overnight. Calcination involved heating from ambient to 700 °C at a rate of 2 °C min−1, followed by isothermal treatment at 700 °C for 2 h.
Variable-temperature XRD data were collected on the precipitated material using an Inel Equinox 3000 fitted with a CPS120 position sensitive detector and a Mo tube operated at 40 kV and 40 mA. MoKα was used to significantly reduce the effects of absorption, compared with lower-energy Co or CuKα. Samples were packed into a 0.7 mm quartz capillary and stoppered with glass wool before heating to 750 °C at 5 °C min−1. Data sets were collected at 1 min intervals. To determine the diffractometer zero and instrumental effects on peak width and shape, data were collected for LaB6 (NIST 660b standard reference material). The diffraction domain length (L vol) was determined using whole-pattern fitting implemented in TOPAS (Bruker AXS, 2009).
Thermal gravimetric characterisation of the precipitated material was carried out using a Mettler Toledo TGA/DSC 1. Approximately 15 mg of sample was weighed into an alumina crucible (150 μl) and heated to 800 °C in a flow of nitrogen (35 ml min−1). Scanning electron microscopy (SEM) characterisation of calcined CeO2 particle morphology and size was obtained using a FEI Nova Nano 450 FEG SEM. Samples were prepared by dispersing the powder on an aluminium stub using conductive carbon tape and coating with platinum. Transmission electron microscopy (TEM) characterisation was carried out on an FEI Tecnai G2 T20 Twin TEM fitted with a LaB6 thermal emitter operated at 200 kV. Samples were prepared by dispersing in n-butyl alcohol (ChemSupply, >99%) and ultra-sonicating before dipping a carbon film (400 mesh Cu) into the solution.
III. RESULTS AND DISCUSSION
A. Phase evolution
The combination of Ce3+ and urea resulted in the generation of Ce2O(CO3)2·H2O (PDF No. 00-043-0602, ICDD Reference Kabekkodu2010) and is consistent with the literature (Chen and Chen, Reference Chen and Chen1993; Hirano and Kato, Reference Hirano and Kato1999b). The precipitation of Ce2O(CO3)2·H2O is reported to occur at low pH as Ce3+ is weakly hydrated, allowing for reaction with CO32− (Hirano and Kato, Reference Hirano and Kato1999a). Upon increasing the temperature under a nitrogen atmosphere [Figure 1(a)] this phase begins to decompose at ~430 °C and persists until ~500 °C. Between 430 and 540 °C an intermediate phase is formed which has unknown crystal structure and future work will aim to determine its structural details. Reflections corresponding to the cubic fluorite structure (space group Fm  $\overline{3}$m) of CeO2 are evident at temperatures greater than 500 °C and at temperatures greater than 540 °C all reflections correspond to those of CeO2 (PDF No. 00-034-0394, ICDD Reference Kabekkodu2010). At 750 °C the lattice parameter was determined as a = 5.445(1) Å.
(Color online) Accumulated XRD data collected during heating, at 5 °C min, under (a) nitrogen and (b) air.

Figure 1(b) shows the change in crystal structure of Ce2O(CO3)2·H2O with increasing temperature in air. The formation of CeO2 occurs at approximately 250 °C with reflections corresponding to the cubic fluorite structure. This corresponds well with the oxidation temperature of 245 °C, when heated at 5 °C min−1 in air, as obtained by Oikawa and Fujihara (Reference Oikawa and Fujihara2005). There is no evidence of the formation of an intermediate as observed when the experiment was carried out under a flow of nitrogen. With increasing temperature the widths of individual reflections decrease because of an increase in crystallinity. At 750 °C the lattice parameter in air was a = 5.421(1) Å. As expected, oxidation of Ce2O(CO3)2·H2O occurred at a lower temperature in air in comparison to nitrogen. In Figure 1(b), there is also the presence of an intense low-angle feature, which is first observed when Ce2O(CO3)2·H2O begins to decompose at ~225 °C and CeO2 begins to form, and persists until ~700 °C. A similar, yet much weaker, low-angle feature was also observed in Figure 1(a) for the experiment conducted under nitrogen. These low-angle features are attributed to small-angle scattering, and future in situ work on a dedicated small-angle scattering instrument may allow for determination of nanoparticle size and shape evolution. This, however, is beyond the scope of the present study.
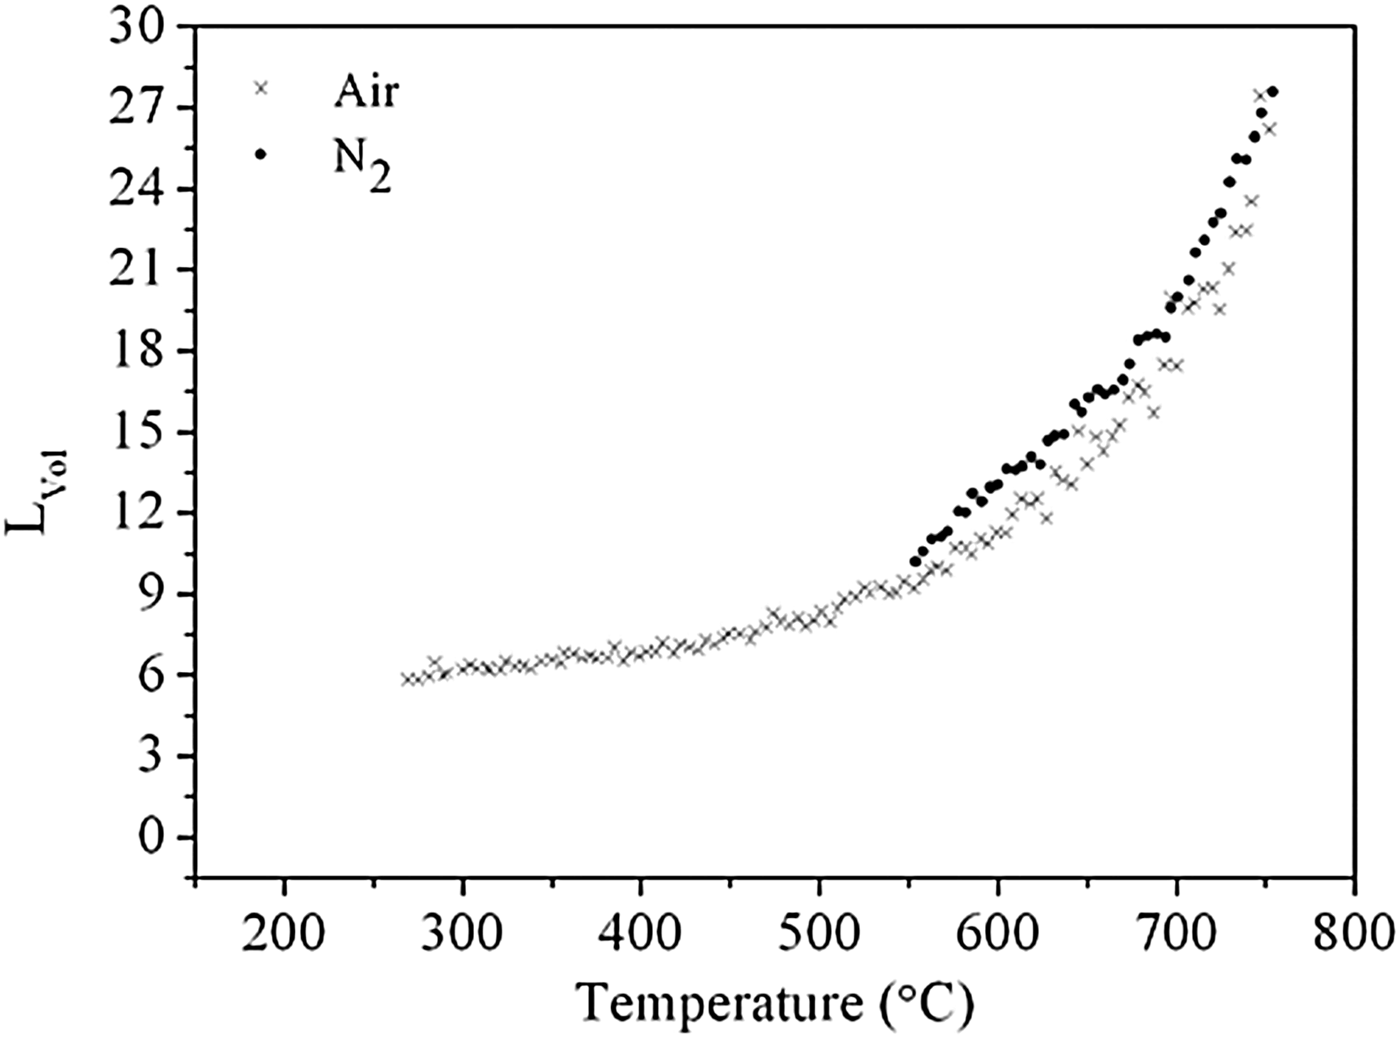
Here, an estimate of CeO2 crystallite size was obtained by calculating L vol, the diffraction domain length, and Figure 2 shows the evolution of L vol as a function of temperature. When heated under nitrogen, values were calculated at temperatures greater than 550 °C only, since at this temperature Ce2O(CO3)2·H2O and the intermediate phase had fully decomposed to form CeO2 [Figure 1(a)]. As expected, L vol increases with increasing temperature. In addition, the rate of increase becomes slightly greater above 700 °C. In air, L vol values were calculated at temperatures greater than 260 °C only, with the rate of increase greater above ~600 °C.
Evolution of the diffraction domain length, L vol, of CeO2 as a function of temperature under both nitrogen (•) and air (×) atmospheres.
The implications of generating larger crystallites from higher calcination temperatures may result in a higher CeO2 reduction temperature. For example, the catalytic activity of CeO2 nanorods and nanoparticles, calcined at both 700 and 900 °C, were evaluated for methane combustion, a proposed fuel for SOFCs, by Sun et al. (Reference Sun, Zou, Xu and Wang2012). A lower half methane conversion-temperature (T 50) was obtained for both the nanorods and nanoparticles calcined at 700 °C (541 and 590 °C, respectively) rather than 900 °C (nanorods at 574 °C and nanoparticles at 645 °C). As the extent of reduction corresponds with the ability of the material to uptake oxygen, the OSC may be inhibited for larger crystallites produced from higher calcination temperatures. It has also been reported elsewhere that crystallite size is dependent on the precursor materials employed (Liu et al. Reference Liu, Ding, Liu, Li, Sun, Xia and Liu2013), and our future work involves investigating CeO2 nanoparticles synthesised by other procedures and from other precursors such as Ce4+/urea, Ce4+/NH4OH, and Ce3+/NH4OH.
B. Thermal gravimetric analysis (TGA)
The TG profile of Ce2O(CO3)2·H2O is shown in Figure 3 and an initial weight loss of 16% is observed at 430 °C with a second of 5.9% at 465 °C. No additional weight loss occurs after 540 °C, since the CeO2 is fully oxidised. The temperature at which weight losses occur correspond well with the structural changes observed in Figure 1(a). The first weight loss may be attributed to the decomposition of the Ce2O(CO3)2·H2O and the second to the oxidation of the intermediate to CeO2. There is a discrepancy between the total observed weight loss (21.9%) and theoretical weight loss (20.7%), indicating the possibility of remaining carbon and the oxide in a non-stoichiometric state (CeO1.84). Complete oxidation to CeO2 may be inhibited as this experiment was carried out in a low-oxygen atmosphere. In an air atmosphere, a lower amount of Ce3+ (ionic radius = 1.14 Å; Shannon, Reference Shannon1976) is expected as these are readily oxidised to Ce4+ (0.97 Å). This is supported by the larger lattice parameter obtained at 750 °C under nitrogen (a = 5.445(1) Å), in comparison with air (a = 5.421(1) Å), and likely attributed to the presence of a higher proportion of larger Ce3+ cations.
(Color online) TG curve of Ce2O(CO3)2·H2O heated to 800 °C in nitrogen.
C. Electron microscopy
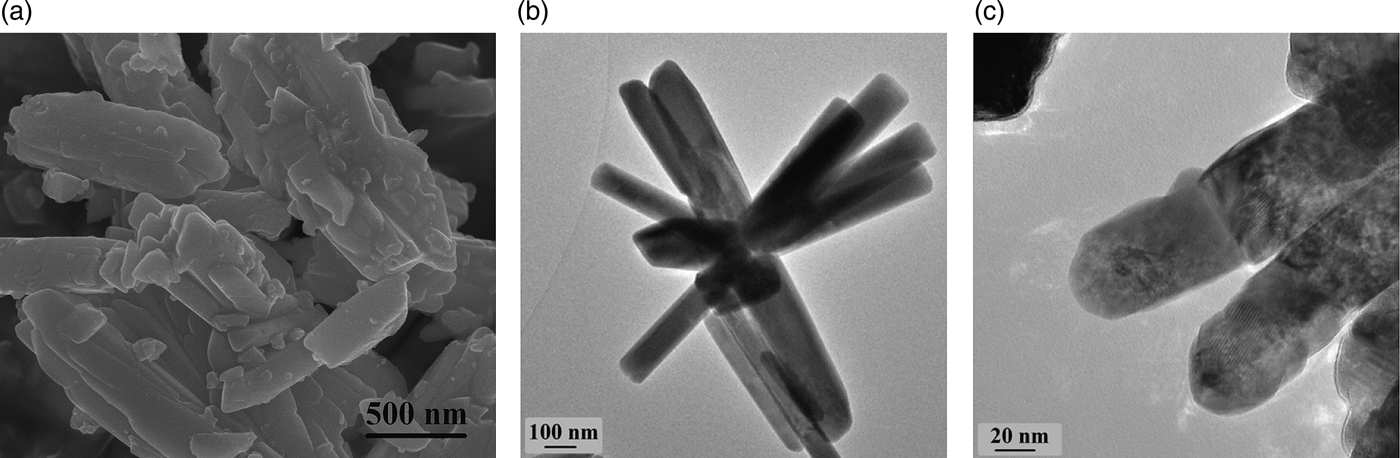
The SEM image of Ce2O(CO3)2·H2O in Figure 4(a) shows that the particles have a rod-shaped morphology with individual rods aggregated together. In Figure 4(b), the individual rods appear to grow from one shared nucleus and are approximately 100 nm in width and 500 nm in length. Following air calcination, the morphology is maintained with the individual rods comprised smaller cubic-shaped crystallites joined together by overlying facets [Figure 4(c)].
(a) SEM image of Ce2O(CO3)2·H2O, (b) TEM image of Ce2O(CO3)2·H2O, and (c) TEM image of CeO2 generated through calcination in air from Ce2O(CO3)2·H2O.
IV. CONCLUSION
CeO2-based catalysts exhibiting higher catalytic activity and stability have been associated with a high OSC and attributed to the presence of a high number of stable Ce3+ and vacancies. Nano-sized rather than micron-sized particles, and those with rod-shape morphology, generally possess a greater amount of these defects and surface-active sites. As the synthesis method is a major factor in the properties of the resulting catalyst, the transformation behaviour of Ce2O(CO3)2·H2O rod clusters synthesised from Ce(NO3)3·6H2O and urea was characterised using the XRD under a flow of both nitrogen and air. In a nitrogen atmosphere, the transformation occurs through an intermediate present between 430 and 540 °C with an unknown crystal structure and, above 500 °C, CeO2 began to form. In air, the transformation occurred at a lower temperature (250 °C). TGA data correspond with those results obtained using XRD and show a weight loss at 430 °C with a second at 465 °C. As expected, the crystallite size also increased with increasing temperature. These results may be used to optimise the synthesis methods of cerium-based catalysts.
ACKNOWLEDGEMENTS
We acknowledge the financial support provided by the Australian Government through its Cooperative Research Centre programme and through the Australian National Low Emissions Coal Research Development (ANLEC R&D) scheme. ANLEC R&D is supported by Australian Coal Association Low Emission Technology Limited and the Australian Government through the Clean Energy Initiative.