In plant ecology bush encroachment is generally viewed as a process in which there is an increase in woody vegetation with a reduction in grass layer (Roques et al. Reference ROQUES, O'CONNOR and WATKINSON2001). Encroachment has serious consequences for ecosystem functioning. Some of the noticeable impacts of encroachment in savannas are reduction in diversity and productivity (Roques et al. Reference ROQUES, O'CONNOR and WATKINSON2001). Reduction in diversity and productivity may have serious implications for ecosystem functioning.
The savanna landscape is shaped by rainfall, fire, herbivory and soil nutrients (Sankaran et al. Reference SANKARAN, HANAN, SCHOLES, RATNAM, AUGUSTINE, CADE, GIGNOUX, HIGGINS, LE ROUX, LUDWIG, ARDO, BANYIKWA, BRONN, BUCINI, CAYLOR, COUGHENOUR, DIOUF, EKAYA, FERAL, FEBRUARY, FROST, HIERNAUX, HRABAR, METZGER, PRINS, RINGROSE, SEA, TEWS, WORDEN and ZAMBATIS2005). Although rainfall is the most important determinant in arid and semi-arid savanna, the manipulation of fire regimes such as frequency and season of burning have a great impact on vegetation composition and patterning on the landscape (O'Connor et al. Reference O'CONNOR, PUTTICK and HOFFMAN2014). A reduction in fire frequency has the potential to support encroachment of grasslands by woody species (Archibald Reference ARCHIBALD2008). Likewise, overgrazing by livestock, deposition of seed in created gaps through dung (endozoochory), browsing, increasing atmospheric CO2 and climate change may further increase the spread of the encroaching species (O'Connor Reference O'CONNOR1995, O'Connor et al. Reference O'CONNOR, PUTTICK and HOFFMAN2014). However, the effect of fire control and maintenance of grazing or browsing on spatial patterning of encroaching woody species remains poorly understood.
Spatial processes are crucial for determining the structure and dynamics of populations and communities. In cases of failure to measure processes directly, knowledge of the biological system becomes important. Processes such as dispersal, competition, disturbance and spatially structured environmental predictors can be evident in point pattern analyses, leading to great inferential gain (McIntire & Fajardo Reference MCINTIRE and FAJARDO2009). In this study we seek to answer one question: what is the spatial patterning of two invading species, V. karroo (Hayne) Banfi & Glasso and V. nilotica (L.) Willd. ex Delile after fire suppression. We hypothesized that competition between the two species would be subtle due to facilitation that is common in harsh conditions of arid and semi-arid environments (Callaway et al. Reference CALLAWAY, BROOKER, CHOLER, KIKVIDZE, LORTIEK, MICHALET, PAOLINI, PUGNAIREQ, NEWINGHAM, ASCHEHOUG, ARMASQ, KIKODZE and COOK2002). Furthermore, maintenance of grazing and fire suppression could create regeneration niches with sufficient resources for plant encroachment resulting in clustering in those gaps.
The study was carried out at Matopos Research Station (20°23′S, 28°28′E) located in south-west Zimbabwe. The area receives a mean annual rainfall of ≤600 mm in a season spanning from November to March. The mean annual temperature is 23.6°C. The vegetation can be described as acacia tree-bush savanna. The common grasses are Heteropogon contortus, Hyparrhenia filipendula, Hyperthelia dissoluta, Themeda triandra and Cymbopogon plurinodis (Rattray Reference RATTRAY1957). Fire was suppressed for 5 y at the study site and a continuous grazing system used.
In order to assess the spatial distribution of invading V. karroo and V. nilotica, we marked a 20 × 20-m plot on the grassland patch using a tape measure. The plot was subdivided into smaller 1-m2 plots in order to increase accuracy of the Cartesian coordinates (x, y) of the plants for point pattern analysis. Height of plants was measured using a graduated pole and basal diameter using a forest calliper. The measured plants were further classified as shrubs (>0.5 m) and saplings (<0.5 m) in height.
We computed Voronoi tessellations for invading species point pattern using deldir package in R. A high number of tiles with hexagonal shape reflect a more regular pattern. We excluded all boundary Voronoi tiles from analysis because their area and number of sides is exaggerated. We applied the mark correlation function kmm (r) in order to check if the sizes of two nearby plants showed spatial correlation as influenced by their distance r.
The small-scale order of the mapped point patterns of the Vachellia species were analysed using both the pair-correlation function g(r) and Ripley's K(r) function, which use rings and circles, respectively (Velázquez et al. Reference VELÁZQUEZ, MARTÍNEZ, GETZIN, MOLONEY and WIEGAND2016). The pair correlation function determines the density of points at a given distance r of an arbitrary point, divided by the intensity λ of the pattern (Velázquez et al. Reference VELÁZQUEZ, MARTÍNEZ, GETZIN, MOLONEY and WIEGAND2016). The g(r) function is non-cumulative unlike the K(r) function, and also has the advantage that it is a probability density function, with the interpretation of a neighbourhood density, which is more intuitive than the K(r) cumulative measure (Wiegand & Moloney Reference WIEGAND and MOLONEY2004). Furthermore, the g(r) function has the advantage of isolating specific distances at which a given null model is violated. However, Ripley's K(r) is pertinent in detecting first-order effects, those effects that result from the environment rather than from the interaction of organisms under investigation (Wiegand & Moloney Reference WIEGAND and MOLONEY2004), and was therefore also applied. Departure from the Poisson null model of CSR for the summary functions g(r) and L(r) was evaluated using fifth-lowest and fifth-highest values of 199 Monte Carlo simulations to generate ~95% simulation envelopes. Summary functions were considered up to a radius of 5 m (Baddeley et al. Reference BADDELEY, DIGGLE, HARDEGEN, LAWRENCE, MILNE and NAIR2014). We used the L-transformation of the K-function for better visual interpretation of the patterns. The variance reduction of the K function is given by:
 $$\begin{equation*}
L\left( r \right) = {\rm{\ }}\frac{{\sqrt {K\left( r \right)} }}{\pi } - r
\end{equation*}$$
The univariate pair correlation function, g(r) is related to the derivative of Ripley's K(r) function, and is given by:
 $$\begin{equation*}
g\left( r \right) = {\rm{\ }}\frac{{K{\rm{'}}\left( r \right)}}{{2\pi r}}
\end{equation*}$$
To obtain information on the spatial relationships between the two species (V. karroo and V. nilotica) and tree classes (shrubs and saplings), we examined bivariate spatial interactions using the K 12(r) function, which is a generalization of K(r) for a bivariate point process (Goreaud & Pélissier Reference GOREAUD and PÉLISSIER2003). We also applied the bivariate pair correlation function g 12(r). In both cases, pattern 1 represents the shrubs and pattern 2 represents the saplings. We applied the null model of independence, where the distribution of saplings was assumed to be independent of shrubs because they belong to different cohorts (Goreaud & Pélissier Reference GOREAUD and PÉLISSIER2003). In order to reduce Type I error, significant departure from the null models was tested at α = 0.05 using the Diggle-Cressie-Loosmore-Ford (DCLF) test with 199 Monte Carlo simulations. To account for edge effects, we applied an isotropic correction in all the spatial point pattern analyses. All spatial point pattern analyses were carried out using spatstat in R.
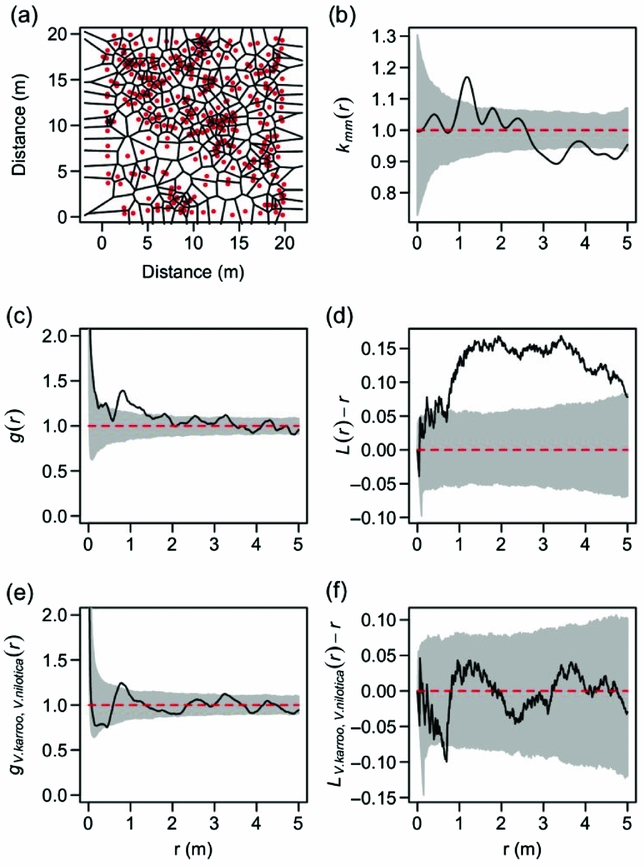
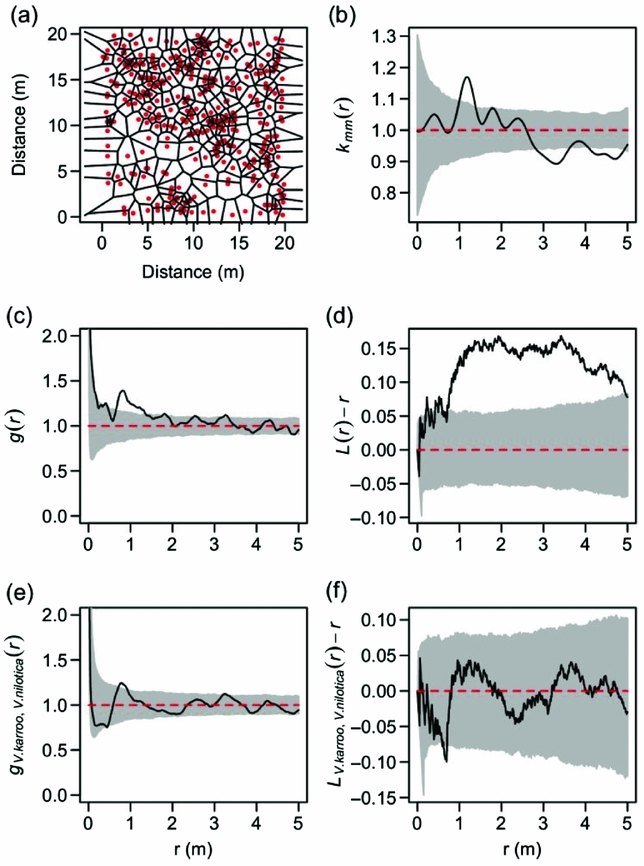
A total of 308 plants were recorded in the plot. The mean ± SE tile area and number of neighbours around each plant excluding boundary plants was 1.83 ± 0.10 m2 and 5.72 ± 0.1 m2, respectively. Although the number of sides for the Voronoi tiles is ~6, clustering is clearly visible in some sections of the plot (Figure 1a). Aggregation of encroaching plants could be typical at initial stages. We suggest the existence of facilitation, and mechanisms underlying this facilitation being improvement of microclimatic conditions and soil physical and chemical properties under shrub canopies leading to clustering (Figure 1a). Furthermore, clustering of the plants could be emanating from environmental heterogeneity (Pillay & Ward Reference PILLAY and WARD2012). Two neighbouring plants were significantly (P <0.05) positively correlated between 1 m and 1.5 m, indicating that the mean height of two neighbouring plants was larger than the population mean µ for the plot (Figure 1b). However, at scales between 2.8 and 3.6 m and 4.2 and 5 m, the mean height of two plants was significantly (P <0.05) smaller than the population mean µ for the plot (Figure 1b). This observation indicates that the encroaching Vachellia species facilitate each other at smaller distances (<2 m) and as the distance increases between individuals, facilitation becomes less important. The pair correlation function showed that the encroaching plants were significantly clustered (P <0.05) between 0.8 and 1.30 m and the pattern was generally random thereafter (Figure 1c). Ripley's L function showed significant (P <0.05) clustering between 1 m and 5 m (Figure 1d). Furthermore, the shape of Ripley's L function showed that there were no first-order effects, but rather, the observed pattern was emanating from second-order effects (plant to plant interactions). Directed seed dispersal by livestock through dung, rodents and dung beetles or normal dispersal from pods may lead to clustering. There is a possibility that as the seedlings establish and develop into other size classes (juveniles and shrubs) they improve conditions for plant establishment (facilitation), and this has been noted to be a common phenomenon in arid and semi-arid environments (Callaway et al. Reference CALLAWAY, BROOKER, CHOLER, KIKVIDZE, LORTIEK, MICHALET, PAOLINI, PUGNAIREQ, NEWINGHAM, ASCHEHOUG, ARMASQ, KIKODZE and COOK2002). However, V. karroo shrubs had a clustered distribution in humid savanna (Pillay & Ward Reference PILLAY and WARD2012), which may mean that regardless of environmental conditions (moisture, soil nutrients and temperature) these plants do not generally compete negatively at younger ages.
Voronoi tessellations around each plant (a), mark-correlation function kmm (r), solid line for the heights of encroaching tree species (b) at Matopos Research Station, south-west Zimbabwe. The univariate spatial pattern of Vachellia karroo and Vachellia nilotica in a 20 × 20-m plot, contrasted to random null models, using the pair-correlation function (c) and Ripley's L-function (d). Bivariate g 12 (r) and L 12 spatial association patterns between V. nilotica and V. karroo (e) and (f), respectively. Approximately 95% simulation envelopes were constructed using the fifth-lowest and fifth-highest values of 199 Monte Carlo simulations. Departure from null models is confirmed when the dark solid line falls below or above 95% confidence limit (grey area).
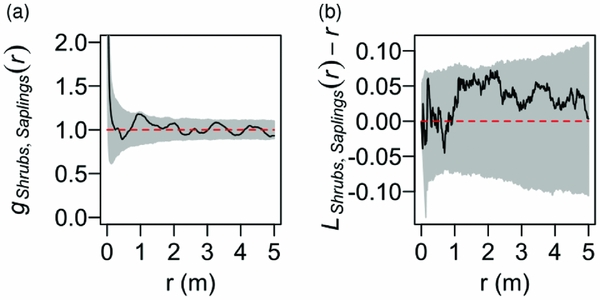
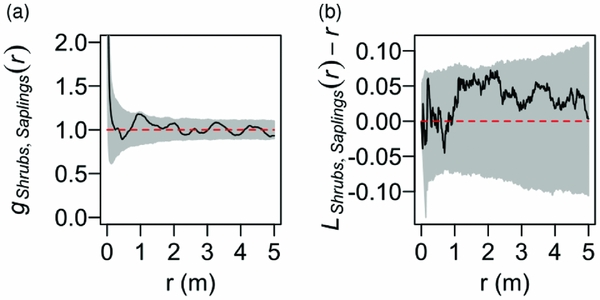
The bivariate pair correlation function showed that the two species V. karroo and V. nilotica were spatially random (Figure 1e). Lack of competition between the two species showed that they can co-exist at these early stages of development (Figure 1e, f). We suggest that since these shrubs would have not developed long roots and meaningful canopies, their zone of influence would not be extending further away from the stem. The interaction of juveniles and shrubs did not deviate from the null model (P >0.05) of complete spatial randomness (Figure 2a, b), which suggests that those two size categories had not yet reached a stage where they would outcompete each other, but rather nurse protégé could have been occurring at the microsites where shrubs had established. Lack of competition between plants can be attributed to lack of size asymmetry of competition during the encroachment phase (Rietkerk et al. Reference RIETKERK, BOERLIJST, VAN LANGEVELDE, HILLERISLAMBERS, VAN DE KOPPEL, KUMAR, PRINS and DE ROOS2002). Furthermore, the zones of overlap of shrubs and saplings are small hence clustering as observed in our plot of two encroaching plant species in this semi-arid savanna.
Summary of the bivariate g 12(r) (a) and L 12 (b) spatial association patterns between shrubs and saplings of Vachellia nilotica and Vachellia karroo in the sampled plot, at Matopos Research Station, south-west Zimbabwe. Approximately 95% simulation envelopes were constructed using the fifth-lowest and fifth-highest values of 199 Monte Carlo simulations of the random null models. Departure from null models is confirmed when the dark solid line falls below or above 95% confidence limits (grey area).
Our study has corroborated some previous studies where species in arid and semi-arid environments have shown facilitative tendencies. In harsh environments young plants do lack inter- and intraspecific competition resulting in accelerated establishment of species during the early stages of encroachment.
ACKNOWLEDGEMENTS
We would like to thank Juan Bonachela for offering insights into data analysis with spatstat.