Introduction
Residual stresses (RS), which commonly exist in engineering structures and parts due to thermal mismatch or mechanical/thermal processing, have significant effects on the mechanical behavior of materials, such as fatigue, fracture, corrosion, wear, and friction.[Reference Lu1] The measurement of RS in engineering structures is of great value for understanding and predicting their mechanical performance. Recently, a number of methods[Reference Suresh and Giannakopoulos2–Reference Ahn, Kim, Xu, Lee, Kim, Kim and Kwon20] have been proposed to estimate RS using instrumented indentation technique due to the advantages of simplicity, non-destruction, and convenience at various scales. These indentation methods can be divided into equibiaxial RS methods[Reference Suresh and Giannakopoulos2–Reference Chen, Liu and Sun14] and non-equibiaxial RS methods according to the type of residual stress.[Reference Kim, Choi, Kwon and Kim15–Reference Ahn, Kim, Xu, Lee, Kim, Kim and Kwon20]
For equibiaxial residual stress evaluation, it is not necessary to determine the directionality. Thus, the equibiaxial RS methods can only evaluate the magnitude of residual stress. As shown in Fig. S1, the basic principle is that the load–depth (F − h) curve is shifted upward by compressive residual stress and downward by tensile residual stress compared to the unstressed state, and the magnitude of residual stress can be related to easy-to-measure parameters, such as the load difference,[Reference Suresh and Giannakopoulos2, Reference Peng, Lu, Ma, Feng, Huan and Zhang13] or the loading curvature difference,[Reference Lu, Feng, Peng, Yang, Huan and Zhang8] or the mean contact pressure difference[Reference Tsui, Oliver and Pharr3, Reference Carlsson and Larsoon5] between stressed and unstressed samples. Most of the current indentation methods are equibiaxial RS methods, which are easy to carry out but have limitations in engineering due to the premise of equibiaxial RS.
For non-equibiaxial residual stress evaluation, both the magnitude and directionality of principal stresses should be determined. Generally, the calculation of magnitude is coupled with the determination of stress directionality. To determine stress directionality, it must be related to sensitive indentation characteristic parameters. Lee et al.[Reference Lee and Kwon17] claimed that the pile-up height shift has a linear relationship with the stress directionality and the shift in peak indentation depth also increases linear with the stress magnitude for conical Brale indentations on API X65 steel. Similarly, Shen et al.[Reference Shen, He, Liu, Gong, Zhang and Lei18] found the maximum pile-up height around a remnant impression is dependent on the direction of the maximum residual stress and the amount of pile-up can be related to the stress magnitude in spherical indentations. Both Lee et al.’s[Reference Lee and Kwon17] and Shen et al.’s[Reference Shen, He, Liu, Gong, Zhang and Lei18] methods adopted axisymmetric indenters and predicted stress directionality and magnitude from the asymmetric pile-up morphology around remnant indentation. Han et al.[Reference Han, Lee, Lee, Choi, Lee, Kim and Kwon21], Choi et al.[Reference Choi, Kang, Kang and Kwon22], and Rickhey et al.[Reference Rickhey, Lee and Lee16] noted that the load–depth curve is sensitive to the orientation of the Knoop indenter with respect to the principal stress directions. Recently, a theoretical model has been developed by Kim et al.[Reference Kim, Choi, Kwon and Kim15, Reference Kim, Ahn, Kwon and Kim19] to evaluate the magnitude and direction of principal RS through four Knoop indentations performed at 45° rotated angles. To sum up, the current indentation methods for evaluating non-equibiaxial RS either need conducting multiple indentations for Knoop indenters or require measuring pile-up morphology around the remnant impression for axisymmetric indenters. Conducting multiple indentations means the Knoop indentation methods do not measure the residual stress at a point but estimate the average residual stress within the tested region. This will decrease the testing resolution and accuracy. Measuring pile-up morphology of the remnant indentation has a high demand for 3D observation equipment, which restricts the application of these methods in engineering. Comparatively, the measurement of top-view morphology of the remnant indentation, which only needs 2D observation equipment, is more convenience.
In the current work, we tried to relate the asymmetric top-view morphology of remnant indentation to the non-equibiaxial RS. A large number of finite element simulations of spherical indentation on elastic-power-law strain-hardening solids with various non-equibiaxial RS were systematically implemented in ABAQUS to provide a deep insight into the influences of indentation depth, tensile stress and compressive stress on indentation load and asymmetric morphology of remnant indentation. The revealed correlations between RS and indentation parameters could be the basis of establishing a straightforward method for determination of the magnitudes and directions of non-equibiaxial RS.
Theoretical background
Model hypothesis
A rigid spherical indenter penetrated into a stressed sample was considered. It is assumed that the surface of sample is flat and the elastic–plastic behavior is described by a linear elastic-power-law strain-hardening constitutive model. The corresponding uniaxial stress-strain expressions can be written as
 $$\sigma = \left\{ {\matrix{ {E\varepsilon, \quad \quad \quad \quad {\rm for} \ \ \sigma \le \sigma_{\rm y}} \cr {\sigma_{\rm y}^{1-n} {(E\varepsilon )}^n, \quad {\rm for} \ \ \sigma \gt \sigma_{\rm y}} \cr}} \right.,$$
where σ is the effective stress, ε is the effective strain, E is the elastic modulus, σ y is the yield strength, n is the strain-hardening exponent, and ε y is the yield strain which equals the ratio of the yield strength to the elastic modulus.
Elastic–plastic contact
Taljat and Pharr[Reference Taljat and Pharr4] pointed out that the spherical indentation behaviors in the elastic–plastic transition regime are more sensitive to RS. Using the load–depth data in the elastic–plastic transition regime to estimate residual stress could have a better accuracy. Determination of the indentation depth range within which the deformation remains in the elastic–plastic transition regime is conducive to select an optimal indentation depth. In our previous work,[Reference Peng, Lu, Ma, Feng, Huan and Zhang13] based on the Hertz theory of elastic contact[Reference Hertz23] and Johnson's spherical cavity model,[Reference Johnson24] the corresponding indentation depth range for the elastic–plastic transition regime was found to mainly depend on the sample's yield strain, ε y,
 $$5.41\varepsilon _{\rm y}^2 \le \displaystyle{h \over R} \le 661.16\varepsilon _{\rm y}^2, $$
where h is the indentation depth and R is the radius of spherical indenter. In this paper, negative stress is regarded as compressive stress and positive stress indicates tensile stress.
Dimensional analysis
Indentation load
Considering a spherical indenter penetrating an unstressed sample, the indentation load, F 0, is a function of the following independent parameters: the elastic modulus, E, the Poisson's ratio, ν, the yield strength, σ y, and the strain-hardening exponent, n, of samples, the elastic modulus, E i, the Poisson's ratio, ν i, and the radius, R, of spherical indenter as well as the indentation depth, h, and it can be written as
 $$F_0 = f_0(E,\nu, \sigma _{\rm y},n;E_{\rm i},\nu _{\rm i},R;h).$$
When biaxial RS  $(\sigma _x^{\rm R}, \,\sigma _z^{\rm R} )$ exist in the sample, the influence of RS must be taken into account. The biaxial stresses can be decomposed into the equibiaxial part,
 $\sigma ^{\rm R} = (\sigma _x^{\rm R} + \sigma _z^{\rm R} )/2$, and the shear part,
 $\tau ^{\rm R} = \vert {\sigma_x^{\rm R} - \sigma_z^{\rm R}} \vert /2$, as shown in Fig. S1. The indentation load, F, can then be expressed by
 $$F = f\,(E,\nu, \sigma _{\rm y},n;E_{\rm i},\nu _{\rm i},R;h;\sigma ^{\rm R},\tau ^{\rm R}).$$
For commonly used alloys, the Poisson's ratio can take a fixed value of 0.3, and for diamond indenters, the elastic modulus is 1141 GPa and Poisson's ratio is 0.07. When these parameters are regarded as constants, Eqs. (3) and (4) can be simplified, respectively, to
 $$F_0 = f_0(E,\sigma _{\rm y},n;R;h),$$
and
 $$F = f\,(E,\sigma _{\rm y},n;R;h;\sigma ^{\rm R},\tau ^{\rm R}).$$
Applying the Π theorem[Reference Brand25] in dimensional analysis, Eqs. (5) and (6) can be rewritten, respectively, as
 $$\displaystyle{{F_{\rm 0}} \over {Eh^2}} = \Pi _0\left( {\displaystyle{{\sigma_{\rm y}} \over E},n;\displaystyle{h \over R}} \right),$$
and
 $$\displaystyle{F \over {Eh^2}} = \Pi \left( {\displaystyle{{\sigma_{\rm y}} \over E},n;\displaystyle{h \over R};\displaystyle{{\sigma^{\rm R}} \over {\sigma_{\rm y}}},\displaystyle{{\tau^{\rm R}} \over {\sigma_{\rm y}}}} \right).$$
From Eqs. (7) and (8), the relative change in load between stressed and unstressed samples, (F − F 0)/F 0, is given by
 $$\eqalign{\displaystyle{{F-F_0} \over {F_0}} & = \displaystyle{{\Pi \left( {\displaystyle{{\sigma_{\rm y}} \over E},n;\displaystyle{h \over R};\displaystyle{{\sigma^{\rm R}} \over {\sigma_{\rm y}}},\displaystyle{{\tau^{\rm R}} \over {\sigma_{\rm y}}}} \right)-\Pi _0\left( {\displaystyle{{\sigma_{\rm y}} \over E},n;\displaystyle{h \over R}} \right)} \over {\Pi _0\left( {\displaystyle{{\sigma_{\rm y}} \over E},n;\displaystyle{h \over R}} \right)}} \cr & = \Pi _{\rm F}\left( {\displaystyle{{\sigma_{\rm y}} \over E},n;\displaystyle{h \over R};\displaystyle{{\sigma^{\rm R}} \over {\sigma_{\rm y}}},\displaystyle{{\tau^{\rm R}} \over {\sigma_{\rm y}}}} \right).}$$
For a fixed value of h/R, Eq. (9) can be simplified to
 $$\left. {\displaystyle{{F-F_0} \over {F_0}}} \right \vert _{{h / {R = {\rm const}}}} = \Pi _{\rm F}\left( {\varepsilon_{\rm y},n;\displaystyle{{\sigma^{\rm R}} \over {\sigma_{\rm y}}},\displaystyle{{\tau^{\rm R}} \over {\sigma_{\rm y}}}} \right).$$
Asymmetric morphology of remnant indentation
The shear part of RS was regarded as the main reason to cause asymmetric morphology of remnant indentation. The asymmetric morphology can be characterized by the amount of asymmetry, λ, which was defined as
 $$\lambda = \displaystyle{{d_x-d_z} \over {d_z}},$$
where d x is the major axis and d z is the minor axis of the elliptical remnant indentation. Besides the shear part of RS, the equibiaxial part of RS, maximum indentation depth as well as the mechanical properties of samples and indenters will affect the asymmetry of remnant impression. Then λ can be expressed as
 $$\lambda = g(E,\nu, \sigma _{\rm y},n;E_{\rm i},\nu _{\rm i},R;h_{\rm m};\sigma ^{\rm R},\tau ^{\rm R}).$$
Similarly, assuming that diamond indenters are used and the Poisson's ratio of commonly used metals takes a fixed value of 0.3, and then applying the Π theorem[Reference Brand25] leads to
 $$\lambda = \Pi _\lambda \left( {\displaystyle{{\sigma_{\rm y}} \over E},n;\displaystyle{{h_{\rm m}} \over R};\displaystyle{{\sigma^{\rm R}} \over {\sigma_{\rm y}}},\displaystyle{{\tau^{\rm R}} \over {\sigma_{\rm y}}}} \right).$$
When the maximum relative indentation depth, h m/R, was fixed, Eq. (13) can be further simplified to
 $$\lambda = \Pi _\lambda \left( {\varepsilon_{\rm y},n;\displaystyle{{\sigma^{\rm R}} \over {\sigma_{\rm y}}},\displaystyle{{\tau^{\rm R}} \over {\sigma_{\rm y}}}} \right).$$
It could be found from Eqs. (10) and (14) that the relative load change and the asymmetric morphology of remnant indentation are mainly affected by sample's plastic properties and RS.
Finite element simulations
Since spherical indentation on an infinite half-space with biaxial RS is a symmetric problem, a one-fourth 3D contact model was constructed in ABAQUS as shown in Fig. S2. The indenter was considered as an analytical rigid sphere with a radius of 1.25 mm. A sample measuring 2.5 × 2.5 × 2.0 mm was regarded as the infinite half-space since the sample size is almost 100 times larger than the radius of the contact region. The mesh of sample consists of 52,094 C3D6 elements. In order to accurately measure the major and minor axes of remnant indentation, ultrafine elements were meshed near the contact boundary. Linear elastic-power-law strain-hardening constitutive model was employed to define the material property. The contact between indenter and sample was assumed to obey Coulomb's friction law and took a friction coefficient of 0.15. As shown in Fig. S2, uniform pressure  $\sigma _x^{\rm R} $ and
 $\sigma _z^{\rm R} $ were exerted on the outer surfaces of the sample to simulate biaxial RS.
As analyzed above, the maximum indentation depth should be kept in the elastic–plastic transition depth range to get better sensitivity to RS. According to Eq. (2), the relative indentation depth range to remain elastic–plastic transition regime will be 0.00002 ≤ h/R ≤ 0.00264 for ε y = 0.002, 0.00014 ≤ h/R ≤ 0.01653 for ε y = 0.005, and 0.00054 ≤ h/R ≤ 0.06612 for ε y = 0.01. To keep deformation in the elastic–plastic transition regime for 0.002 ≤ ε y ≤ 0.01, the relative indentation depth, h/R, should be no greater than 0.0026, which is too small to achieve sufficient reliability and accuracy in practical indentation tests. However, a larger relative indentation depth will lead the deformation to pass into the full plastic state for smaller yield strain. This means larger relative indentation depth is not applicable to most of the steels whose yield strain is around 0.002. In the current work, taking into account both reliability and application range, the maximum relative indentation depth, h m/R, was fixed at 0.01 which can guarantee the elastic–plastic transition regime for alloys (such as Ti Grade5, Al 2024 and Al 7075[Reference Yu, Feng, Yang, Peng, Lu and Zhang26]) whose yield strain ranges from 0.005 to 0.01.
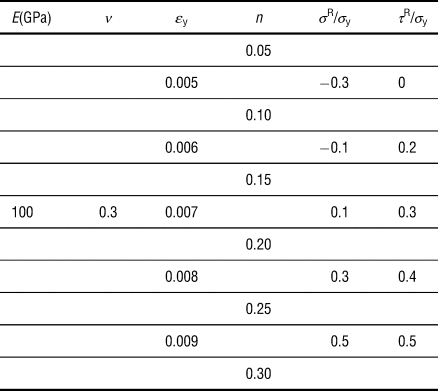
Equations (10) and (14) reveal that the relative load change and asymmetry of remnant indentation are mainly related to four key parameters, i.e., sample's yield strain, ε y, and strain-hardening exponent, n, the normalized equibiaxial stress part, σ R/σ y, and the normalized shear stress part, τ R/σ y. Several values, as listed in Table I, were taken for each parameter in the simulations to figure out the influence of these parameters on indentation responses. Since the elastic modulus, E, is not an important impact factor, it takes a fixed value of 100 GPa for convenience. To investigate the effect of indentation depth on spherical indentation behaviors, several materials with the same RS were penetrated to different normalized depths. The combination of these parameters yields more than 750 cases.
The mechanical parameters and RS employed in simulations.

Results and discussion
Influence of RS on remnant indentation
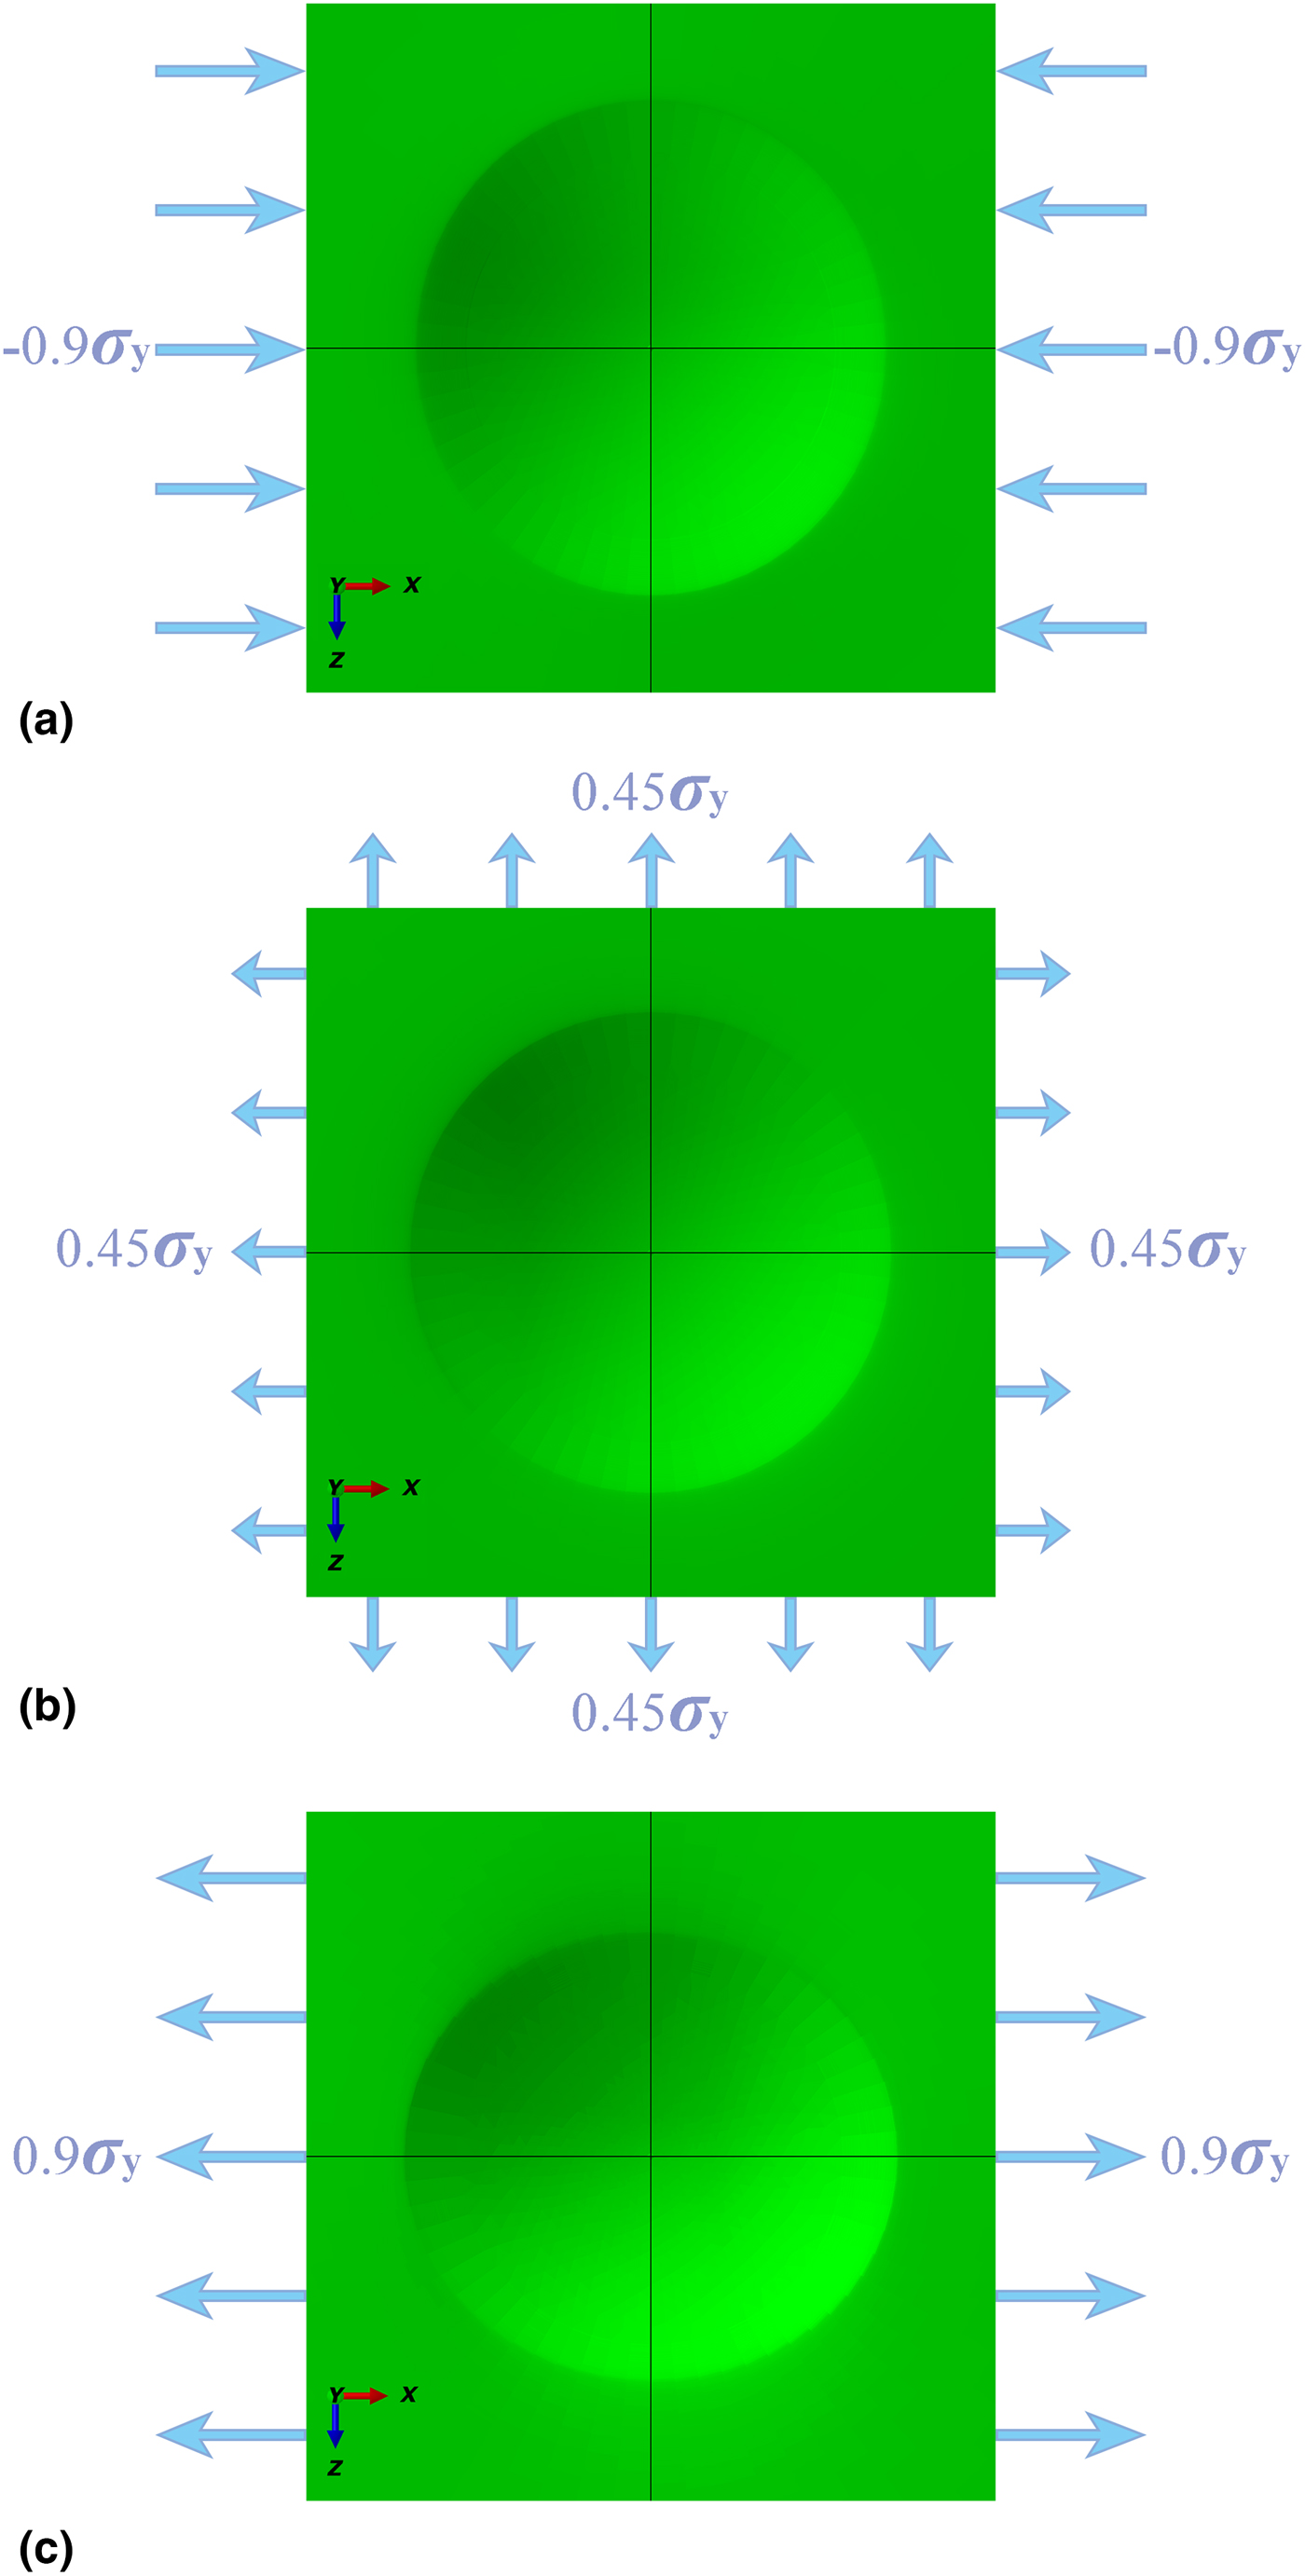
It is evident from Figs. 1(a) and 1(c) that non-equibiaxial RS cause elliptical remnant impression in spherical indentations. Furthermore, the major axis of elliptical impression indicates the direction of the maximum principal stress and the minor axis appears in the direction of the minimum principal stress. Thus, the directions of principal stresses could be straightforwardly determined from the asymmetric morphology of remnant indentation. According to Eq. (13), the amount of asymmetry in remnant indentation, λ, could be affected by the plastic properties of sample, the RS as well as the relative indentation depth. Figure S3 clearly shows that the amount of asymmetry decreases with increasing normalized indentation depth for each material. This agrees with the discussion in the Theoretical background section that the spherical indentation responses are more sensitive to RS in the elastic–plastic transition regime. It demonstrates the maximum relative indentation depth of h m/R = 0.01 is a preferable depth to achieve better sensitivity. Figure S3 also reveals that materials with larger yield strain and smaller strain-hardening exponent tend to have more asymmetric remnant indentation.
The remnant indentation of samples subjected to (a) uniaxial compressive stress, (b) equibiaxial tensile stress, and (c) uniaxial tensile stress.

Effects of RS (σ R, τ R) and sample's plastic parameters (ε y, n) on the asymmetry of remnant impression could be summarized from Fig. S4. For the same equibiaxial stress part, the amount of asymmetry in remnant indentation is found to increase almost linearly with the increase of the shear stress part. When the equibiaxial part of RS varies, these data could be fitted by a group of linear lines with an intercept of 0. And the slope of fitting lines increases with the increase of the equibiaxial stress part. By comparing Figs. S4(a)–S4(c), or Figs. S4(d)–S4(f), or Figs. S4(g)–S4(i), it is found that larger strain-hardening exponent leads to smaller slope of fitting lines. Similarly, the comparison of Figs. S4(a), S4(d) and S4(g), or Figs. S4(b), S4(e) and S4(h), or Figs. S4(c), S4(f) and S4(i) reveals that the increase in yield strain could cause the slope of fitting lines to increase. This means the slope of fitting lines is a function of the equibiaxial part of RS, the yield strain and strain-hardening exponent of samples. Equation (14) can then be further simplified to
 $$\lambda = f_\lambda \left( {\varepsilon_{\rm y},n;\displaystyle{{\sigma^{\rm R}} \over {\sigma_{\rm y}}}} \right)\displaystyle{{\tau ^{\rm R}} \over {\sigma _{\rm y}}}.$$
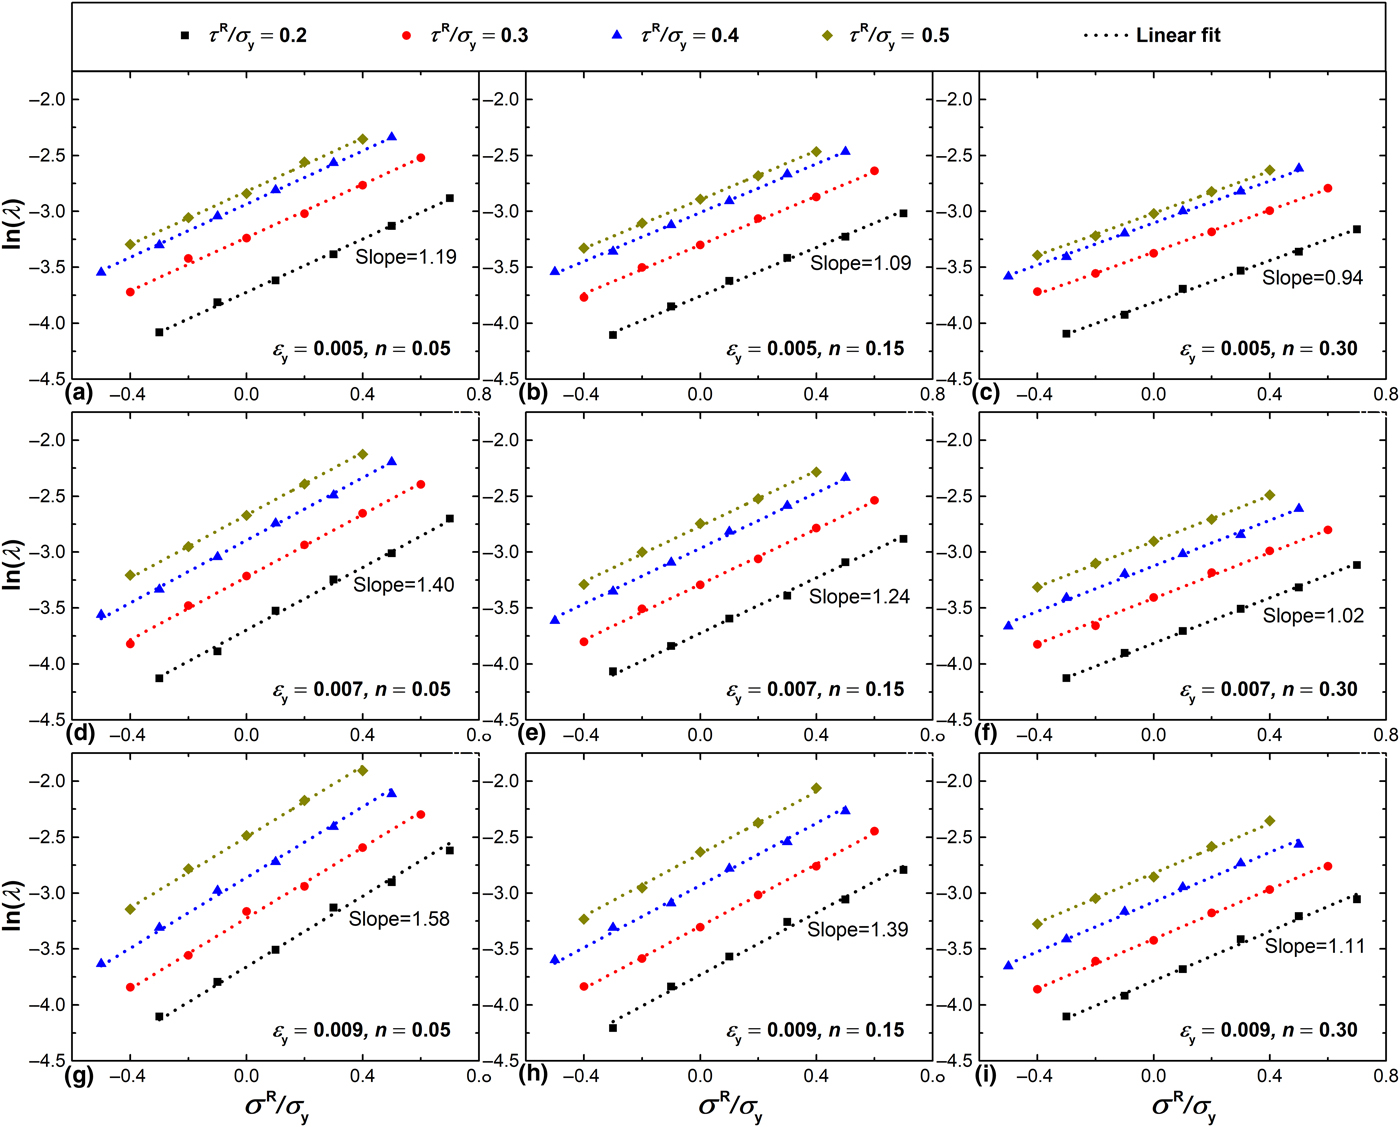
Alternatively, with the same simulation results, by plotting the equibiaxial part of RS as x-axis and the logarithm of the asymmetry of impression as y-axis in Fig. 2, it is easy to found that, for each material with the same shear stress part, ln (λ) increases linearly with increasing σ R/σ y. With the change of the shear part of RS, the data could be fitted by a group of parallel lines. It demonstrates the shear part of RS only affect the intercept but does not influence the slope of fitting lines. The slope of fitting lines is found to increase with increasing yield strain and decrease with the increase of strain-hardening exponent. This means materials with larger yield strain and smaller strain-hardening exponent tend to be more sensitive to RS. From Fig. 2, it could be summarized that the slope of the plot of ln (λ) versus σ R/σ y is a function of yield strain and strain-hardening exponent, and the intercept is a function of yield strain, strain-hardening exponent as well as the shear part of RS. Then, Eq. (14) can be rewritten as
 $$\ln \,(\lambda ) = f_{\lambda {\rm 1}}(\varepsilon _{\rm y},n)\displaystyle{{\sigma ^{\rm R}} \over {\sigma _{\rm y}}} + f_{\lambda {\rm 0}}\left( {\varepsilon_{\rm y},n;\displaystyle{{\tau^{\rm R}} \over {\sigma_{\rm y}}}} \right).$$
Variation of the asymmetry of remnant indentation with the normalized equibiaxial stress part under various shear stress parts for different materials: (a) ε y = 0.005 and n = 0.05, (b) ε y = 0.005 and n = 0.15, (c) ε y = 0.005 and n = 0.30, (d) ε y = 0.007 and n = 0.05, (e) ε y = 0.007 and n = 0.15, (f) ε y = 0.007 and n = 0.30, (g) ε y = 0.009 and n = 0.05, (h) ε y = 0.009 and n = 0.15, and (i) ε y = 0.009 and n = 0.30.

Based on Eq. (16), by fitting all the simulation data, the function, f λ1, is obtained as
 $$\eqalign{f_{\lambda {\rm 1}}(\varepsilon _{\rm y},n) & = (46710.5263\varepsilon _{\rm y}^2 -818.4211\varepsilon _{\rm y} + 1.9243)n \cr & + (94.0789\varepsilon _{\rm y} + 0.7844),}$$
and the function, f λ0, is given as
 $$f_{{\rm \lambda 0}}\left( {\varepsilon_{\rm y},n;\displaystyle{{\tau^{\rm R}} \over {\sigma_{\rm y}}}} \right) = (-1.8815n + 4.0934)\displaystyle{{\tau ^{\rm R}} \over {\sigma _{\rm y}}}-4.4811.$$
Influence of RS on load–depth curve
Lee and Kwon[Reference Lee and Kwon17] pointed out that it is the equibiaxial part of RS shifts the load–depth curve and the shear part of RS does not affect indentation load in sharp indentations. This is not suitable for spherical indentations. As shown in Fig. S5(a), if there is no shear stress part, larger equibiaxial stress part leads to larger amount of shifting in indentation load. From Fig. S5(b), however, it is obvious that the existing of shear stress part tends to shift downward the load–depth curves even if the equibiaxial stress part is identical. This means the existing of shear stress part decreases the relative load change for compressive stresses, but increases the relative load change for tensile stresses. Due to space limit, only typical load–depth curves are presented in Fig. S5. Similar results were also found for other materials and other residual stress states.
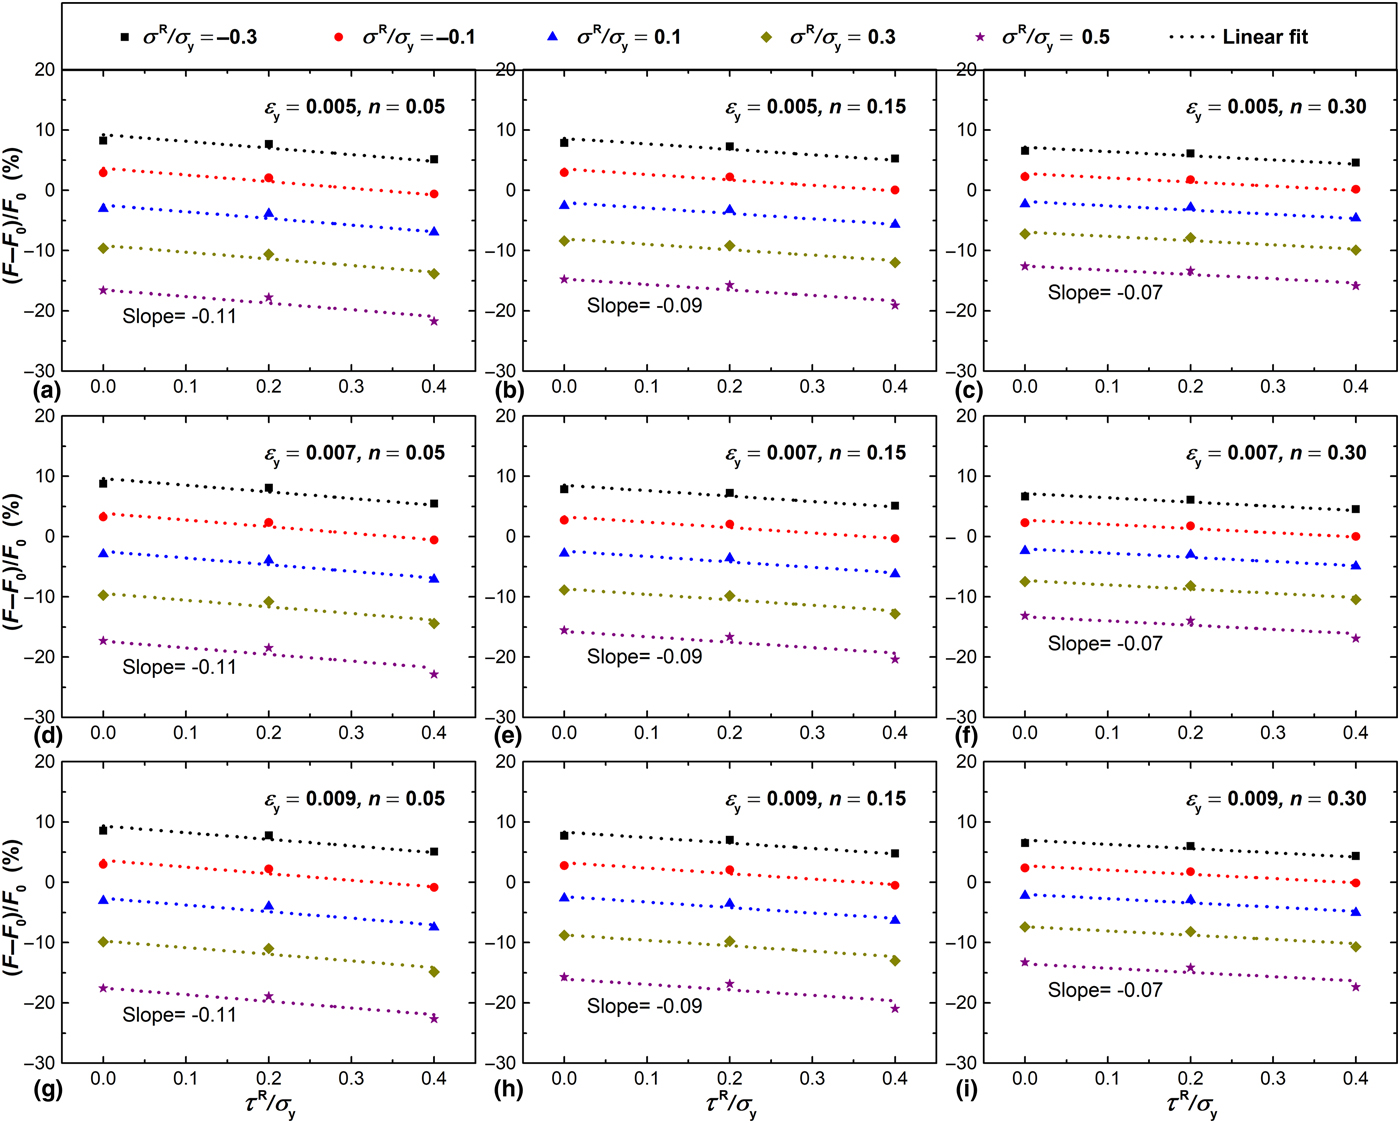
To quantitatively investigate the effects of the equibiaxial part and shear part of RS on indentation load, the relative load change at the maximum depth,  $[(F-F_0)/F_0]_{h_{\rm m}/R = 0.01}$, versus the normalized shear stress part, τ R/σ y, is plotted in Fig. 3. The relationships between the relative load change and the shear part of RS could be approximately fitted by a group of parallel lines. Furthermore, the slope of these parallel fitting lines keeps almost unchanged for different yield strain and only decreases slightly with the increase of strain-hardening exponent. Equation (10) can then be simplified to
 $$\left. {\displaystyle{{F-F_0} \over {F_0}}} \right \vert _{{{h_{\rm m}} / {R = {\rm 0}{\rm. 01}}}} = f_{{\rm F1}}(n)\displaystyle{{\tau ^{\rm R}} \over {\sigma _{\rm y}}} + f_{{\rm F0}}\left( {\varepsilon_{\rm y},n;\displaystyle{{\sigma^{\rm R}} \over {\sigma_{\rm y}}}} \right).$$
Variation of relative load change with the normalized shear stress part under various equibiaxial stress parts for typical materials: (a) ε y = 0.005 and n = 0.05, (b) ε y = 0.005 and n = 0.15, (c) ε y = 0.005 and n = 0.30, (d) ε y = 0.007 and n = 0.05, (e) ε y = 0.007 and n = 0.15, (f) ε y = 0.007 and n = 0.30, (g) ε y = 0.009 and n = 0.05, (h) ε y = 0.009 and n = 0.15, and (i) ε y = 0.009 and n = 0.30.

By fitting the slope data for all materials, the function, f F1, is easily obtained as
 $$f_{{\rm F1}}(n) = -0.2667n^2 + 0.2533n-0.1220.$$
When the shear part of RS is equal to 0, Eq. (19) degenerates into
 $$\left. {\displaystyle{{F-F_0} \over {F_0}}} \right \vert _{{{h_{\rm m}} / {R = {\rm 0}{\rm. 01}}}} = f_{{\rm F0}}\left( {\varepsilon_{\rm y},n;\displaystyle{{\sigma^{\rm R}} \over {\sigma_{\rm y}}}} \right).$$
It is only need to consider spherical indentation on samples with equibiaxial stresses. This helps figure out the exact expression of the intercept function. As shown in Fig. S6, for each material, a bilinear relationship exists between the relative load change and the normalized equibiaxial stress part. By comparing the slopes for compressive and tensile stresses, the indentation load is found to be more sensitive to tensile stresses. According to the bilinear relationship, Eq. (21) could be further simplified to
 $$f_{{\rm F0}}\left( {\varepsilon_{\rm y},n;\displaystyle{{\sigma^{\rm R}} \over {\sigma_{\rm y}}}} \right) = f_{{\rm F2}}(\varepsilon _{\rm y},n)\displaystyle{{\sigma ^{\rm R}} \over {\sigma _{\rm y}}}.$$
By fitting the slope data of all materials, the exact expression of the intercept function is figured out as
 $$f_{{\rm F0}}\left( {\varepsilon_{\rm y},n;\displaystyle{{\sigma^{\rm R}} \over {\sigma_{\rm y}}}} \right) = \left\{ \matrix{\lpar {0.3253n-0.3621} \rpar \displaystyle{{\sigma^{\rm R}} \over {\sigma_{\rm y}}}, \quad{\rm for} \quad F \le F_0 \hfill \cr \lpar {0.3008n-0.3240} \rpar \displaystyle{{\sigma^{\rm R}} \over {\sigma_{\rm y}}}, \quad {\rm for} \quad F \gt F_0 \hfill} \right..$$
Through Eqs. (16) and (19), the equibiaxial and shear parts of RS are related to the sample's plastic properties, the amount of asymmetry in remnant indentation as well as the relative load change at the depth of h/R = 0.01. The plastic parameters, ε y and n, can be extracted from the unstressed sample using spherical indentation method[Reference Yu, Feng, Yang, Peng, Lu and Zhang26–Reference Zhang, Yu, Peng and Feng28] or uniaxial tensile tests. Theoretically, the equibiaxial and shear parts of RS could be calculated when the amount of asymmetry, λ, and relative load change,  $[(F-F_0)/F_0]_{h_{\rm m}/R = 0.01}$, are measured from the remnant indentation and load–depth curves, respectively.
Influence of RS on plastic zone
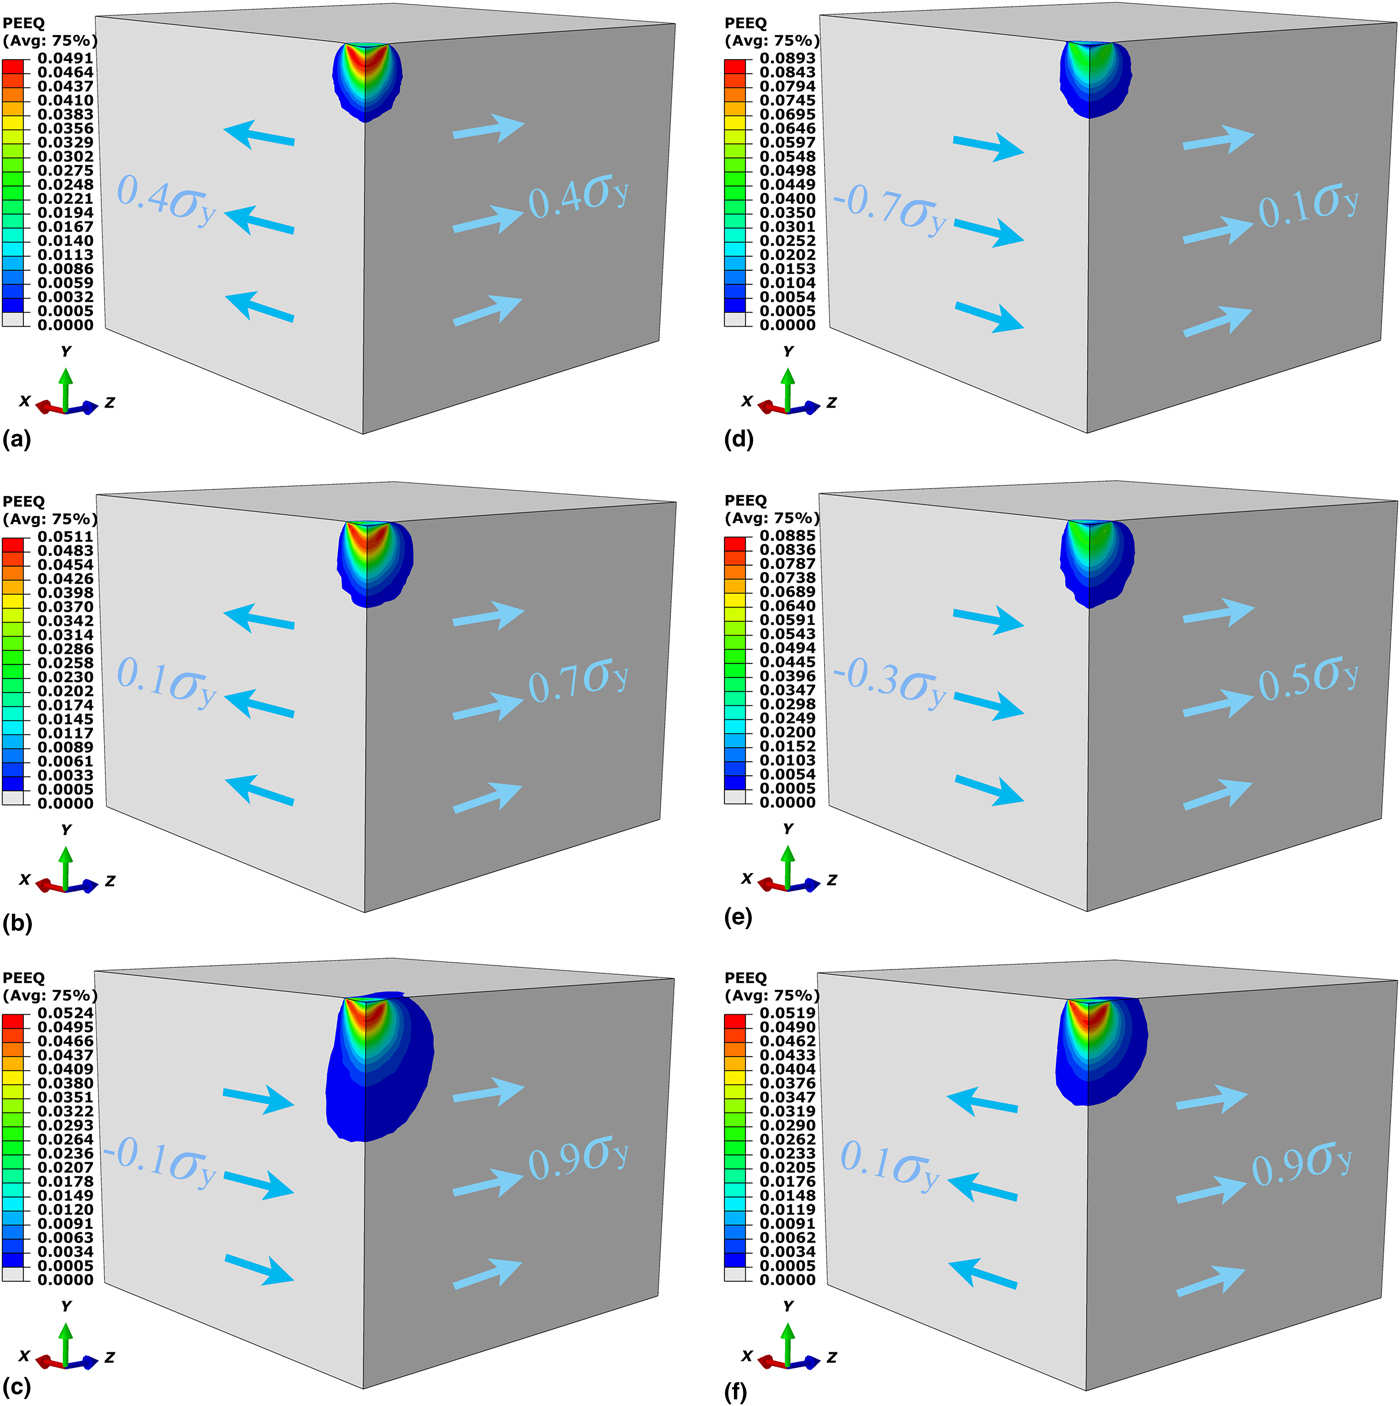
Investigation of the influence of RS on plastic deformation can give a deep insight into the affecting mechanism of RS on indentation responses. Figures 4(a)–4(c) show the plastic zones at the indentation depth of 0.01R for the same material subject to RS with an identical equibiaxial part of 0.4σ y and different shear parts of 0, 0.3σ y, and 0.5σ y, respectively. As shown in Fig. 4(a), the plastic zone is symmetric when there is no shear stress part. It is clear from Figs. 4(b) and 4(c) that the asymmetry of plastic zone becomes more obvious with the increase of the shear stress part. Statistic of the volume of plastic zone in Figs. 4(a)–4(c) reveals that the volume of plastic zone increases with the increase of shear stress part. According to Mises or Tresca yield criteria, it is the shear stress that mainly causes yielding and leads the material to flow. Thus, the existing of shear stress part can make the material yield more easily and drive the material to flow along the shearing direction. This means higher shear stress part could cause larger plastic zone and lead plastic zone to evolve more asymmetrically. Generally, the morphology of the remnant indentation is dominated by the plastic deformation during indentation. Then, it is reasonable that the asymmetry of remnant indentation increases with the shear part of RS as shown in Fig. S4. Furthermore, the carrying capacity of material decreases after the material's yielding. With the increase of shear stress part, the volume of plastic zone increases. Larger plastic zone leads to lower carrying capacity. This explains why the shear part of RS tends to shift downward the load–depth curve even if the equibiaxial stress part is identical [see Fig. S5(b)].
The plastic zones for the same material (ε y = 0.007, n = 0.15) under different RS: (a) σ R = 0.4σ y and τ R = 0, (b) σ R = 0.4σ y and τ R = 0.3σ y, (c) σ R = 0.4σ y and τ R = 0.5σ y, (d) σ R = −0.3σ y and τ R = 0.4σ y, (e) σ R = 0.1σ y and τ R = 0.4σ y, and (f) σ R = 0.5σ y and τ R = 0.4σ y.

Figures 4(d)–4(f) show the plastic zones at the indentation depth of 0.01R for the same material subject to RS with an identical shear part of 0.4σ y and different equibiaxial parts of −0.3σ y, 0.1σ y, and 0.5σ y, respectively. The asymmetry of plastic zone is found to be more evident as the equibiaxial part of RS increasing. The main reason is that equibiaxial compressive stress will restrict the plastic flow of materials and the expansion of plastic zone, while equibiaxial tensile stress is conducive to the plastic flow of materials. Under the same shear stress part, higher equibiaxial stress part can drive more materials to flow along the shear direction and thus generate a more asymmetric plastic zone. This explains why the asymmetry of remnant indentation increases with increasing equibiaxial stress part as shown in Fig. 2.
Numerical verification of obtained indentation relationships
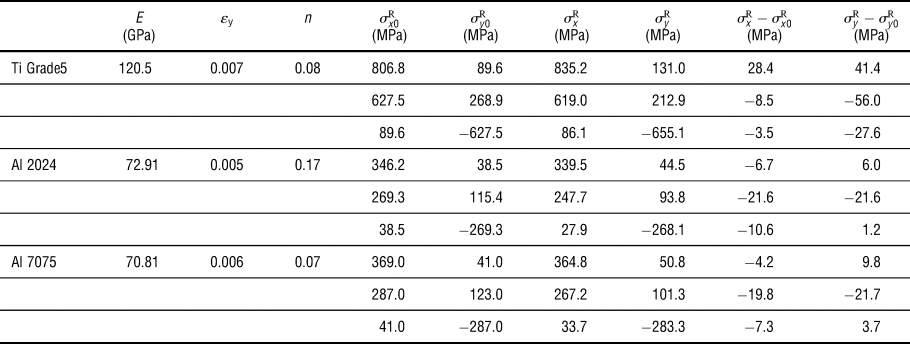
Equations (16)–(23) show the relationships between the equibiaxial and shear parts of RS, the sample's plastic properties, the amount of asymmetry in remnant indentation and the relative load change at the depth of h/R = 0.01. To validate these relationships, extra finite element simulations of spherical indentation on three specific materials, i.e., Ti Grade5, Al 2024, and Al 7075, with various applied stresses were implemented in ABAQUS. The input mechanical properties which are obtained from Ref. Reference Yu, Feng, Yang, Peng, Lu and Zhang26 and applied stresses are listed in Table II. When the simulations were completed, the asymmetry in remnant indentation, λ, and the relative load change,  $[(F-F_0)/F_0]_{h_{\rm m}/R = 0.01}$, could be measured from the remnant indentation and load–depth curves, respectively. Substituting the measured λ and
 $[(F-F_0)/F_0]_{h_{\rm m}/R = 0.01}$ and plastic parameters, ε y and n, into Eqs. (16)–(23), the RS can then be determined. The comparison of applied stress and the measured stress listed in Table II shows that the maximum error is 56.0 MPa and most of the errors are less than 30.0 MPa which is acceptable for metals. This demonstrates that Eqs. (16)–(23) are valid for measuring non-equibiaxial RS.
The comparison of measured stresses (σ xR, σ yR) and applied stresses (σ x0R, σ y0R) for Ti Grade5, Al 2014, and Al 7075.

Conclusions
The finite element simulations indicate that non-equibiaxial RS can cause elliptical remnant indentation in spherical indentation. Both theoretical and numerical analyses reveal that the asymmetry of remnant indentation is the most obvious when the maximum indentation depth is within the elastic–plastic transition range, namely,  $5.41\varepsilon _{\rm y}^2 \le h/ R \le 661.16\varepsilon _{\rm y}^2 $. An arbitrary biaxial residual stress can be decomposed into the equibiaxial part,
 $\sigma ^{\rm R} = (\sigma _x^{\rm R} + \sigma _z^{\rm R} )/2$, and the shear part,
 $\tau ^{\rm R} = \vert {\sigma_x^{\rm R} -\sigma_z^{\rm R}} \vert /2$. The asymmetry of remnant impression is found to increase with the increase of shear part and equibiaxial part of RS. The reason is that the shear stress part is the primary factor that drives materials to plastic flow along the shearing direction to form elliptical remnant indentation, and the equibiaxial stress part could restrict plastic flow of material if it is compressive stress and be conducive to plastic flow of material if it is tensile stress. Furthermore, different from the argument of Lee and Kwon[Reference Lee and Kwon17] that the shear part of RS does not affect indentation load in sharp indentations, the shear stress part is found to shift downward indentation load–depth curves for spherical indentations. It is mainly because the existing of shear stress part can make the material yield more easily, and generate larger plastic zone which leads to lower load capacity.
Through Eqs. (16)–(23), the equibiaxial and shear parts of RS are related to the sample's plastic properties, the amount of asymmetry in remnant indentation and the relative load change at the fixed relative depth, h/R = 0.01. Theoretically, when these parameters are extracted or measured from the load–depth curves and the remnant indentation, the equibiaxial part and the shear part of RS could be evaluated. Then, the two principal RS  $(\sigma _x^{\rm R}, \,\sigma _z^{\rm R} )$ can be calculated. In addition, from the orientation of the elliptical remnant indentation, the directions of the principal stresses could be straightforwardly determined. These findings provide foundations to establish spherical indentation method for evaluation of non-equibiaxial RS. Numerical verification results demonstrate that Eqs. (16)–(23) could determine non-equibiaxial RS with good accuracy. However, these equations still need further validation by experiments.
Supplementary material
The supplementary material for this article can be found at https://doi.org/10.1557/mrc.2018.240
Acknowledgments
The authors would like to gratefully acknowledge the support from the National Natural Science Foundation of China (Grant Nos. 11727803, 11772302, 11672356, 11402233, and 11502235) and Public Welfare Project of Zhejiang Province (2015C31074).